Development of a database linked to a GIS for coupling with groundwater modelling tools
7
0
0
Texte intégral
(2) rated zone, geomorphology, and climate are increasingly being used. Some of the techniques for measurement of hydrogeological parameters (sampling, monitoring of hydraulic heads and flow rates, geophysical techniques) show a steady improvement. All these data need to be managed, and this can be done in databases and particularly in GIS databases. Storing data implies data analysis, conceptual design of data models, and data representation. In hydrogeology, because of a limited number of sample locations, point-attribute data also need to be processed by applying adequate kinds of interpolation or modeling algorithms. The derived data also need to be managed. 2.2 Basic concepts of GIS as applied in hydrogeology A GIS is defined as a system for input, storage, manipulation, and output of geographically referenced data (Goodchild 1996). GIS provides a means of representing the real world through integrated layers of constituent spatial information (Corwin 1996). Geographic information can be represented in GIS as objects or fields. The object approach represents the real world through simple objects such as point, lines, and areas. The objects, representing entities, are characterized by geometry, topology, and non-spatial attribute values (Heuvelink 1998). In hydrogeology, some examples of spatial objects are wells, piezometers, boreholes, galleries, and zones of protection. Attribute values of objects could be the number of a well, the ownership, the diameter of a gallery or drain. The field approach represents the real world as fields of attribute data without defining objects, some examples are strata elevation, hydraulic head, and vulnerability zones. This approach provides attribute values in any location. In GIS, this distinction between objects and fields is often associated with vector data models and raster data models. The vector model represents spatial phenomena through differences in the distribution of properties of points, lines, and areas. In this system, each layer is an adapted combination of one or more classes of geometrical features. A raster model consists of a rectangular array of cells with values being assigned to each cell. In the raster model, each cell is usually restricted to a single value. Thus, representing the spatial distribution of a number of parameters or variables requires multiple layers. 2.3 Groundwater Models The process-based models used in hydrogeology include the simulation of steady or transient state groundwater flow, advection, hydrodynamic dispersion, adsorption, desorption, retardation, and multi-component chemical reaction. Very often, exchanges with the unsaturated zone and with rivers are also addressed. In these models, equations based on physical processes are solved. Modelling groundwater flow and contaminant transport in aquifers represents a spatial and temporal problem that requires integration of process-based models. Each model parameter or variable can be represented on a three- or four-dimensional (x, y, z, and time) information layer. Due to the heterogeneity of the geology, managing these data can be done most effectively through GIS. Data used in groundwater modelling consists of four categories: (1) the aquifer-system stress factors, (2) the aquifer-system and strata geometry, (3) the hydrogeological parameters of the simulated process, and (4) the main measured variables (historical data needed for calibration and validation). Stress factors for groundwater flow include: effective recharge, pumping volumes, water-surface flow exchanges, etc. In contaminant transport modelling, the input and output contaminant mass flows are stress factors. These stress factors are imposed on the model through “boundary” conditions or “source/sink” terms. An appropriate aquifer-system geometry can be determined using geological information (maps and cross sections), topographical maps, and contour maps of the upper and lower limits for the aquifer strata and aquitards. Initial estimates of the distributed values and spatial distributions of the hydro geological parameters (hydraulic conductivity, storage coefficient, dispersivity, etc.) need to be made using raw data and interpretations. Maps and vertical cross sections are used. For a groundwater flow problem, the main measured variable is usually the hydraulic head, and for contaminant transport problems, concentrations. These consist of point values measured at different time periods in the entire aquifer. Historical measurements are required for model calibration and validation..
(3) 2.4 Databases linked to a GIS The geo-referenced database can be linked to a GIS project, by spatial queries and a Structured Query Language (SQL) connection (existing GIS function). The data stored in the database can be easily updated and represented on the map. All points of the map are linked to the database by their unique number. Powerful spatial analysis is feasible once the database is established. Maps representing database attribute queries (time- and space-dependent parameter values) can be created. Simple statistics related to hydro-geological entities can be displayed on the screen or printed on paper support maps. Geo-statistical procedures (i.e. kriging) complete the analysis. Some of the tools needed to achieve the objectives are already implemented in the base software package, but most of them require knowledge of GIS techniques, database philosophy, and targeted programming using specific programming languages. 2.5 GIS linked to Groundwater Modelling Links can be organized between models and GIS using three techniques: loose coupling, tight coupling, and embedded coupling. Loose coupling is when the GIS and the model represent distinct software packages and the data transfer is made through input/output model pre-defined files. GIS software is used to pre-process and post-process the spatial data. An advantage of this solution is that the coupled software packages are independent systems, facilitating potential future changes in an independent manner. In tight coupling, an export of data to the model from GIS is performed, but the GIS tools can interactively access input model subroutines. In this case, the data exchange is fully automatic. An example of this coupling is the Groundwater Modeller link (Steyaert & Goodchild 1994) between the ERMA Spatial database scheme (supported by Modular GIS Environment, Intergraph 1995) and MODFLOW, MODPATH, MT3D finite-difference software packages. When a model is created using the GIS programming language or when a simple GIS is assimilated by a complex modelling system, embedded coupling is used. Tight coupling as well as embedded coupling involves a significant investment in programming and data management that is not always justified. Also, this could be constraining when a high flexibility is required. For simulating the groundwater flow and transport in saturated and unsaturated zones, our own developed finite element code SUFT3D (Carabin & Dassargues 1999) is used. The well known Groundwater Modeling System (GMS) is here used as a powerful pre-processor and post–processor (Engineering Computer Graphics Laboratory 1998) for our numerical modelling operations. The hydrogeological-attribute data can be directly introduced or they can be imported from a specific format file. The need for importing data in GMS exists in the three steps of groundwater flow modelling: conceptual model design, model construction, and calibration. Starting from the defined conceptual model, the model can be built within GMS using “feature objects” defining the conceptual model to generate a 2D mesh. The 3D mesh is built using the 2D mesh and TINs. 3 ADVANCED APPROACH FOR MANAGING HYDROGEOLOGICAL DATA: THE HYGES DATABASE SCHEME Recognizing that field hydrogeologists, modelers, and regulators all need to manage data, the purpose of developing the hydrogeological database concept (called HYGES) was to integrate the main data and information that the hydrogeologist uses. The objectives for the final database were: (1) to provide an organised scheme for capturing, storing, editing, and displaying geographically referenced hydrological data and information, (2) to process and analyse spatially distributed data, (3) to properly support aquifer vulnerability assessments, (4) to easily provide values for numerical models parameters and variables, and (5) to create hydrogeological maps. Existing and required data types were examined in order to design the database scheme. Parameters and information were reclassified and regrouped several times. Many hydrogeological parameters and relationships were analyzed in order to be placed in the database. Maximum storage of data with a minimum data redundancy, reduction storage capacity, and optimum re-.
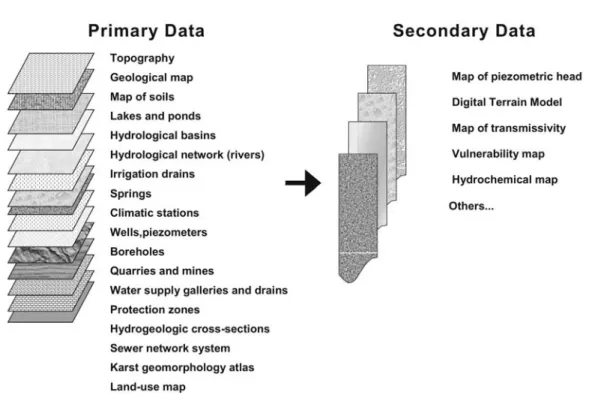
(4) trievability of data for analysis were the constraints that defined the final scheme. Dataintegration limits were imposed because of different restrictions concerning the hardware and software storage capacity and limitations in current activities and in available information. 3.1 HYGES Database Construction Data analysis is an important consideration in database construction. In order to identify the data needs and to provide the optimal data representation, accurate assessments of all types of data and data formats are extremely important before designing a database. The data-collection operation showed that hydrological and hydrogeological data come from very different sources: water regulators, water companies, environmental agencies, geological services, research offices, and many others. In this case, the main data providers were Ministry of Walloon region, Walloon Society for Water Distribution (SWDE), Water Supply Company of Liege (CILE), Water Supply Company of Brussels (CIBE), Belgian Geological Survey, Laboratory of Engineering Geology, Hydrogeology and Geophysical Prospecting (LGIH), and others. These various sources have strong dissimilarities in data type, in quality and in quantity, as well as in storage media. All the data were analyzed for import to a single system. Data that appear to be redundant had to be specified in the database scheme to avoid loss of information. Such decisions were based on (1) pumping schedules, (2) data registration formats, (3) uncertainty of existing data (measures and registration), and (4) insufficiency in data registration system. Depending on the accepted conceptual data-model (basic assumptions) and needs, additional data could appear. Also, data that were not explicit or sufficient needed to be flagged or supplied with fields of information or even entire tables. An example is the case where flow-rate registrations related to several wells were available, without distinguishing the pumping schedule of each well. There, a field containing wells sharing the same flow rate value had to be specified. Data formats are also an important issue, because the pre-treatment of data consists of hours of encoding or of writing import/export codes. Data coming from paper sources, such as tables, maps, and singular data, as well as different spreadsheets and data existing in databases having distinct schemes, were analysed in order to create a unified database system. After structuring the spatial database scheme, hydrological and hydrogeological data coming from Ministry of Walloon region, SWDE, CILE, and elsewhere, were introduced into a GIS project using Arc/Info (ESRI) with Access (Microsoft). This solution was chosen after analysing the software platforms used by different hydrological and hydrogeological research teams, Belgian regulators, water companies, and authorities, in order to ensure compatibility in future data-exchange operations. In the first step, the information was collected for the following hydrogeological entities: wells and wells systems, piezometers, drains, water-supply galleries, and quarries and mines exploited for water. For these features, the following characteristics were incorporated: location (in Belgian Lambert coordinates), address, altitude, depth, local aquifer information, and owners. More than 50 years (1947–2003) of time-dependent data were encoded, including hydraulic heads and annual and monthly pumping rates. Quality data represented by 284 water-quality parameters determined on 4077 groundwater samples are now registered in the database. The information was supplemented with digital maps showing geology and strata elevation, land-use maps, zones of hydrogeological protection, and others. 3.2 HYGES Database Scheme Data and information specific to geomorphologic, geologic, and hydrological conditions were divided in two parts, primary and secondary data. The primary-data section contains layers of general environmental information, such as topography, geological maps, soils maps, hydrological and hydrogeological raw data, or data undergoing an initial minor pre-treatment; and information related to hydrogeological investigations and development means, such as wells, piezometers, drains, mines, quarries; and land-use maps. Secondary data consist of data derived from processed primary data; examples are maps of hydraulic head, hydraulic-conductivity maps, vulnerability maps, etc (Fig.1)..
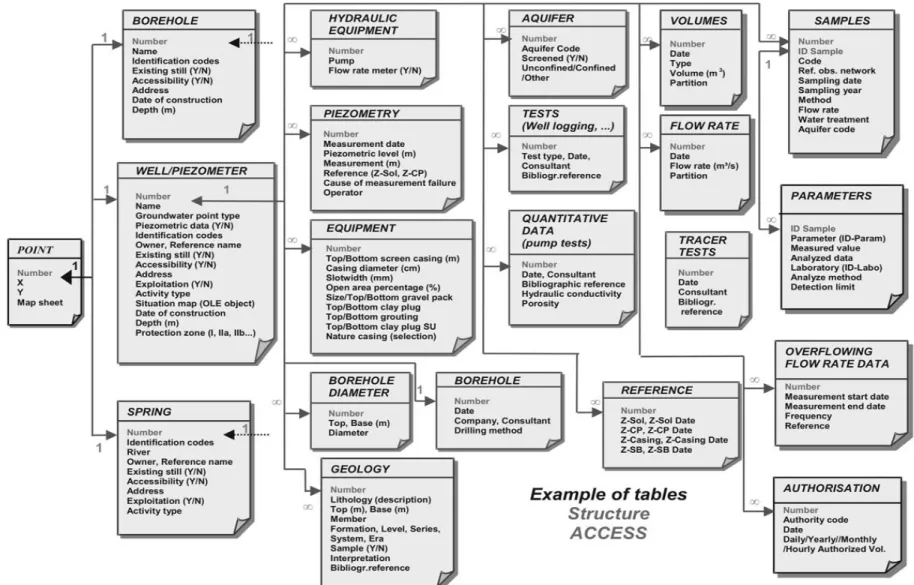
(5) Figure 1. Overview of the hydrogeological database structure. A spatial reference for the represented hydrogeological features was used based on the topographical map of Belgium with a scale of 1:25,000. This map is uses the Lambert Conformal Conic projection with the following parameters (Belgium Lambert): spheroid International 1909; 1st standard parallel 49°50'0.002" N; 2nd standard parallel 51°10'0.002" N; central meridian 4°22'2.952" E; latitude of projection’s origin 90°0'0.000"; false easting (meters) 150000.01300; and false northing (meters) 5400088.43800. The current geological map of Belgium uses the same scale and the same projection as the topographical map. The information contained in the Access database is divided in three main groups following the geometrical characteristic of the information (associated to a point, an arc or a polygon). An example of “point” tables contained in the primary database is shown in the figure 2. 3.3 Applications of the database ‘HYGES’ One of the applications of this georelational database is the development of the hydrogeological maps. Coupling a Geographical Information System (GIS) and the hydrogeological database provides a powerful tool for groundwater management. Therefore these maps are realized with a GIS software (ArcView-ESRI). This connection allows an automatic update of the GIS project for punctual elements (wells, piezometers, springs, climatic stations, river-gauging stations,…) every time a new record is added to the database (with its geographic coordinates). Polylines (galleries, isopiestic lines,…) and polygons (protection zones, watersheds,…) are digitized in the GIS project and their attributes are actively related to the database by a unique number. The hydrogeological database can be consulted starting from the map thanks to an ArcView extension called BDHydro, developed by the hydrogeolocical cell of the Faculty of Applied Sciences of Mons, (Belgium). It opens a window by clicking on one of the element on the map and allows the user to display in the GIS project for example a hydraulic head evolution, a hydrochemical analysis table, the lithological log diagram of a well,….
(6) Figure 2 : Example of a simplified version of the point attribute data scheme, particularly ‘Wells and Piezometers’.
(7) 4 COUPLING THE DATABASE TO THE GMS INTERFACE Different programs were developed to automatically use the attributes of wells, rivers, and drains in GMS for the mesh of the finite-element models. They allow maintenance of the coupled software packages as independent systems, facilitating any future changes in the spatial database scheme or in any particular module of the software. The presented scheme can satisfy the hydrogeologist’s immediate needs in term of research and various environmental studies. However, hydrogeologists are advised that a complete GIS structure is more that a database scheme. 5 CONCLUSION The hydrogeological GIS database described in this paper offers capabilities for hydrogeological modelling as well as other hydrogeological studies. The presented database schema is implemented in the Hydrogeology Group of the University of Liege in Belgium. The software support is Arc/Info (ESRI) in connection to Access (Microsoft). The schema could be applied to other GIS and Relational Database Management Systems (RDBMS) that can be connected. The spatial database was conceived as being modular. Users that are using only a RDBMS in the absence of a GIS tool can handle the attribute data. New developments are also underway. ACKNOWLEDGEMENTS We thank the Walloon Region of Belgium for the different projects supporting entirely the development of the exposed tools. A part of this work has also been funded through the EUMANPORIVERS project (ICA4-CT-2001-10039). REFERENCES Gogu R.C., Carabin G., Hallet V., Peters V. & Dassargues A. 2001. GIS-based hydrogeological database and groundwater modelling. Hydrogeology Journal 9 : 555-569 Carabin G. & Dassargues A. 1999. Modelling groundwater with ocean and river interaction. Water Resources Research 8:2347-2358 Corwin L.D. 1996. GIS applications of deterministic solute transport models for regional-scale assessment of non-point source pollutants in the vadose zone. In: Corwin DL and Loague K (eds) Applications of GIS to the modelling of non-point source of pollutants in the vadose zone, Soil Science Society of America. Madison, USA. 48:69-100 Engineering Computer Graphics Laboratory 1998. Groundwater modelling system reference manual (GMS v2.1). Brigham Young University, Provo, Utah, USA. ESRI 1997. The Arc/Info version 7.1 & ArcView 3.2 software package documentation. Environmental Systems Research Institute, Inc., USA. GMS version 2.1 1998. Groundwater Modeling System. The Department of Defense. Reference Manual. Engineering Computer Graphics Laboratory, Brigham Young University. Goodchild M.F. 1996. The application of advanced information technology in assessing environmental impacts. In: Corwin DL and Loague K (eds) Applications of GIS to the modelling of non-point source of pollutants in the vadose zone, Soil Science Society of America. Madison, USA. 48:1-17 Heuvelink G.B.M. 1998. Error propagation in environmental modelling with GIS. Taylor & Francis Ltd, UK Intergraph 1995. Working with Environmental Resource Management Applications groundwater modeller for the Windows NT Operating system. Intergraph Corporation, Huntsville, USA. Steyaert L.T. & Goodchild M.F. 1994. Integrating geographic information systems and environmental simulation models: A status review. In: Michener WK, Brunt JW and Stafford SG (eds) Environmental Information Management and Analysis: Ecosystem to Global Scales, Taylor & Francis Ltd, UK, 21: 333-355.
(8)
Figure
Documents relatifs
Cross-referencing catchment data: how R can provide essential tools for the development of hydrological models for flood prediction.. 15th edition of the International R
A Prototype Implementation of a Failure Database for Information Sharing with the General Public: A Case Study on Radiation Risk Information after Fukushima Nuclear Disaster..
Search screen permitting to search for certain expression patterns (A.) for microarray data (the example query shown is “Show the genes which are upregulated by a factor
The entities TREE, DNA-SAMPLE, PHENOTYPE and MOLECULAR DATA allow multi-annual observations to be stored as individual samples of individual trees, even if the nature of
Deep in vivo two-photon imaging of blood vessels with a new dye encapsulated in pluronic nanomicelles.. Mathieu Maurin, Olivier Stéphan, Jean-Claude Vial, Seth Marder, Boudewijn van
Si cette destination n’était pas celle dont il avait rêvé, bien que son arrière grand-oncle, Paul Boyer, ait été, comme il aimait le rappeler, l’un des fondateurs de
information such as: the aims and scope of the journal, the topics covered, the presence of a reviewers' committee, the existence of an impact factor from JCR®, the link
5 , we will study numerically the properties of the composite scattering matrix S, using random matrix theory (RMT), and show that the currents through the chain of quantum dots
