Potential Benefits from Multitrait Evaluation - an Example in
Selection for Mastitis Resistance Based on Somatic Cell Score and
Udder Conformation. A Simulation Study
Nicolas Gengler and Ab F. Groen
Unité de Zootechnie, Faculté Universitaire des Sciences Agronomiques Passage des Déportés 2, B-5030 Gembloux, Belgium
and
Department of Animal Breeding, Wageningen Institute of Animal Sciences P.O. Box 338, NL-6700 AH Wageningen, The Netherlands
Abstract
Multitrait evaluation methods have potential benefits when used to select for mastitis resistance. Six
alternatives were simulated where 1000 sires having 10 different grand sires had 50 (27) or 100 (55)
daughters for somatic cell scores (figures for udder conformation), with a distribution expressed as
standard deviation of 0 (0), 10 (5) and 20 (10) (figures for udder conformation).
Indirect evaluation methods for not observed mastitis resistance using a multitrait method were
always better than indirect evaluation methods based on genetic regression on somatic cell scores, fore
udder attachment and udder depth. Evaluations were nearly as accurate as direct evaluation using single
trait evaluation of mastitis resistance, especially for low numbers of daughters per sire. Correlations
between true breeding values and estimates were between 0.55 and 0.71 for direct and 0.52 and 0.62 for
indirect selection using the multitrait method.
Combined evaluation, grouping direct information on mastitis resistance and indirect through
somatic cell score and udder conformation, consistently gave higher correlations between true and
estimated breeding values for mastitis resistance relative to evaluation from direct recording only, with
values between 0.65 and 0.77.
1. Introduction
Direct selection for mastitis resistance is difficult but highly desirable as mastitis is a major disease in dairy cattle. Also consumer acceptance for dairy products is partly dependant on udder health in order to avoid use of antibiotics. On farm mastitis losses can be explained by direct labour and veterinarian costs and indirect costs as early culling and lower production. Two types of mastitis can be distinguished, clinical and subclinical. Even if genetic correlations between these traits are not necessarily one (Emanuelson et al., 1988), selection could be done on clinical that is easier to observe. Nordic countries are following this approach, but in most countries mastitis is not or only partially
logical alternative approach is the use of indicator traits that are recorded, for the trait mastitis resistance (MR) that is not recorded. The most important trait is the somatic cell count (SCC) often represented as a logarithmic function of SCC called somatic cell score (SCS). The genetic correlations between SCS and MR are considered important and negative (e.g., Emanuelson et al., 1988; Shook, 1989; Rogers, 1996). Also udder conformation is considered important for MR. Heritabilities for udder traits are normally considered moderate to high (e.g., Misztal et al., 1992; Gengler et al., 1997a). Udder conformation traits as udder depth (UD) and fore udder attachment (FU) are genetically linked to better MR, less depth and stronger attachment being related to higher MR
literature, especially milking speed. Milking speed is not systematically recorded in all countries and the recorded traits are not always the same (e.g., mean or maximum milking speed, scored or measured by farmers or technicians) as reported in a recent INTERBULL study (INTERBULL, 1996). Therefore this trait was not included in this study.
The problem is now how to evaluate MR? In dairy cattle evaluations, single trait models are still very common. The reasons are the complexity of multitrait (MT) models (e.g., high number of equations, convergence issues and different fixed effects per trait). Also the difficulty to get good covariance estimates is limiting their use for the moment. If, MR is known for all or at least a major part of the animals, MR could be directly evaluated using a single trait model (ST).
However, in most countries MR is not recorded itself (INTERBULL, 1996), therefore needs to be predicted out of correlated traits. The most common approach is to use a selection index where the trait we want to select on is MR (or udder health), and the information vector contains the estimated breeding values (EBV) for SCS, UD and FU (e.g., De Jong and Lansbergen, 1996). This leads to multiple genetic regression equations (Harris et al., 1992) where selection index like b coefficients are computed and applied on EBV for SCS, UD and FU. Another indirect approach would be to include unrecorded MR in a MT model were evaluation is done directly out of the mixed model equations. The first objective of this paper was therefore to study the possible benefits of a MT model over other indirect evaluation methods for MR.
A logical extension of such a MT model would be to introduce recorded MR together with other related traits as SCS, FU and UD in a MT system. Such a system can be called combined selection. A certain number of other methods exists to combine direct and indirect information (e.g., Weigel, 1996), but the simplest and most flexible is the MT method using directly MR, SCS, FU and UD. Therefore the second objective of this study was to test the advantage of the combined method using a MT model over direct or indirect evaluations.
2. Material and Methods
2.1. Covariances
Covariances needed for this study were obtained using the correlations and heritabilities shown in Table 1. These values were based on literature compilations done by De Jong and Lansbergen (1996) and were similar to values reported by others (e.g., Rogers, 1996).
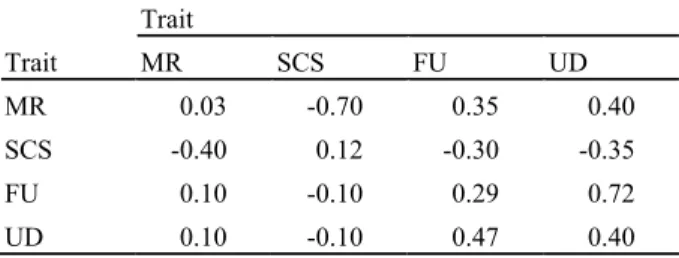
Table 1. Assumed genetic correlations (above diagonal), heritabilities (on diagonal) and phenotypic correlations (below diagonal) Trait Trait MR SCS FU UD MR 0.03 -0.70 0.35 0.40 SCS -0.40 0.12 -0.30 -0.35 FU 0.10 -0.10 0.29 0.72 UD 0.10 -0.10 0.47 0.40 MR is mastitis resistance
SCS is somatic cell score FU is fore udder attachment UD is udder depth
Heritability for MR was considered very low with 0.03. Estimate used for SCS was slightly higher with 0.12. Heritabilities for the other traits were 0.29 for FU and 0.40 for UD.
Absolute genetic correlations were considered strongest between MR and SCS, what is mostly accepted, but still not negligible for MR with FU and UD with values around 0.4. Phenotypic correlations were lower. Correlations between FU and UD were very similar to most literature values (e.g., Gengler et al., 1997a).
2.2. Simulations
Six data sets representing a different alternative were simulated in order to test two types of numbers of daughters per sire and three distributions of daughters. Ten sire families were simulated considering the 10 unrelated foundation sires
where
gFS is a vector of known true breeding values
(TBV) for MR, SCS, FU and UD for every foundation sire,
L is the lower Cholesky decomposition matrix of the genetic variance-covariance matrix G = LL' and
n is a vector of standardized independent normal deviates.
Hundred sons with daughters were simulated per foundation sire, dams of sons were considered unknown. True breeding values for every sire were simulated as
gS = 0.5gFS +sqrt(0.75)Ln (2)
where
gS is a vector of TBV for MR, SCS, FU and UD
for every sire with daughters
gFS, L and n are defined as for (1).
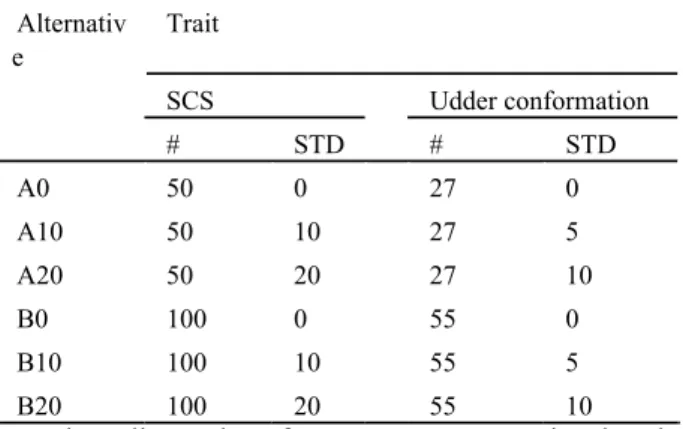
Foundation sires and sires were only simulated once, for every sire, daughters were simulated using the assumptions described in Table 2. These assumptions were based on values suggested by G. de Jong (personal communication). Six alternatives were simulated.
Table 2. Average number of daughters (#) and standards deviation on the number of daughters (STD) per sire in the simulated alternatives, specified for somatic cell score (SCS) and udder conformation
Alternativ e Trait SCS Udder conformation # STD # STD A0 50 0 27 0 A10 50 10 27 5 A20 50 20 27 10 B0 100 0 55 0 B10 100 10 55 5 B20 100 20 55 10
True breeding values for every cow were simulated as
gC = 0.5gS +sqrt(0.75)Ln (3)
where
gC is a vector of TBV for MR, SCS, FU and UD
gS, L and n are defined as for (1) and (2).
Records were simulated as
yC = c + gC + Kn (4)
where
yC is a vector of phenotypic values for MR, SCS,
FU and UD for every cow
c is a vector of constants
K is the lower Cholesky decomposition matrix of the residual variance-covariance matrix R = KK'
gC and n are defined as for (3).
If SCS or FU and UD were not recorded for this cow the corresponding phenotypic values were put to missing. For MR two options were considered, all cows had MR records or no cow had a MR record. As no fixed effect was simulated number of daughters was equal to effective number of daughters.
2.3. Genetic evaluations
Genetic evaluations were made using an animal model. All animals, foundation sires, sires and cows were analyzed. Variance-covariance components were considered known. As the objectives were to estimate potential benefits of multitrait evaluations for indirect and combined evaluation of MR through knowledge of SCC and udder conformation the following five evaluations were made:
I. Single trait evaluation of MR (ST-MR) II. Multiple regression on single trait EBV using
selection index theory:
Estimated breeding values for SCS, FU and UD obtained using ST models were weighted with constant, pre-determined regression coefficients, based on an assumed variance-covariance matrix between these indicator traits. Simplified assumptions on the reliability/accuracy of the single trait EBV and on the number of records on relatives were used. Multiple regression coefficients were computed as:
Cov(MR, indicator traits)*[Var(indicator traits)]-1
Two different sets of multiple regression coefficients were computed:
a. Regression coefficients obtained by ignoring covariances between indicator traits (SI-STC):
SI-STC: SBVMR = ! 0.701*SBVSCS
+ 0.350*SBVFU
+ 0.400*SBVUD
b. Regression coefficients obtained with full knowledge on covariances (SI-MTC):
SI-MTC: SBVMR = ! 0.636*SBVSCS
+ 0.065*SBVFU
+ 0.131*SBVUD
where
SBV is the standardized estimated breeding value (EBV divided by the genetic standard deviation).
For the first method (SISTC) the relative importance of SCS, FU and UD were 0.63, 0.16 and 0.21. For the second method (SI-MTC) the corresponding figures were 0.95, 0.01 and 0.04. The use of the MT regression coefficients increased the weight of SCS in the indirect evaluation of MR.
III. Multitrait EBV
In MT methods, regression coefficients are calculated ‘internally’, accounting for full knowledge on covariances, and on the amount of information per individual bull. Two different situations were considered:
a. MT (MR missing):
Mastitis resistance was not recorded. This option corresponds to an indirect evaluation based on the knowledge of the indicator traits SCS, FU and UD.
b. MT (MR known):
Mastitis resistance was recorded. This option provides an combined evaluation as both direct (MR records) and indirect (SCS, FU and UD records) are used.
The two MT evaluations were made using a canonical transformation adapted for missing values as described by Gengler et al. (1997b). The program allows use of missing values for different traits and
computes approximate reliabilities (Gengler and Misztal, 1996) if required. Single trait runs were also done using this program by forcing covariances between traits to zero. This computer program is written in standard Fortran 77 and is available from the first author on request.
2.4. Comparisons
In order to allow comparisons across models and data sets, only sires with records were compared. Pearson correlation coefficients were computed between the known TBV and the recorded EBV. Also variance of (EBV-TBV) for these sires were computed as observed prediction error variance (PEV). Results were expressed relative to the genetic variance and to the single trait MR evaluation (ST-MR) as the simulated sire population was the same, only simulated daughter populations were different in each alternative.
3. Results and discussion
Table 3 shows the results from the comparison of the five evaluations for MR using the six different alternatives. A first observation was that because of the low heritability for MR, correlations between TBV and EBV were always rather low to moderate with values that ranged from 0.47 to 0.77. Correlation were higher when more information was available. Also PEV expressed in percent of genetic variance was between 82% for the worst prediction and 36% for the best prediction. Prediction error variance decreased with more data. Relative PEV expressed in percent of PEV associated with ST direct evaluation of MR was between 173% for the worst and 79% for the best situation.
Results for direct ST evaluation of MR (Table 3) showed that correlations between TBV and EBV were between 0.55 and 0.71. Prediction error variance ranged from 61% to 44% of genetic variance. As obviously expected with increased numbers of daughters the correlations increased and the PEV decreased, but heterogeneity of numbers of daughters had only very limited influence on quality of evaluation, and this even in an opposite direction to what might be expected (higher correlations, lower PEV). This result is difficult to explain, but might be due to sampling errors.
In most countries very limited direct information is known for MR. Therefore indirect evaluation methods are needed. Table 3 gives the results for the three indirect evaluation methods tested in this study.
Table 3. Correlations between true and estimated breeding values for mastitis resistance, prediction error variances (PEV) expressed in % of genetic variance and relative prediction error variances (Rel PEV) in % compared to single trait mastitis resistance for the 6 alternative and the 5 models, results for 1000 sires with daughters
Alternative Evaluation models
Direct Indirect Combined
ST-MR SI-STC SI-MTC MT (MR missing) MT (MR known) A0 (50 " 0 / 27 " 0) Correlations 0.55 0.48 0.51 0.52 0.65 PEV 61 82 64 64 50 Rel PEV 100 134 105 105 82 A10 (50 "10 / 27 " 5) Correlations 0.60 0.52 0.54 0.55 0.68 PEV 56 75 61 61 47 Rel PEV 100 134 110 109 84 A20 (50 "20 / 27 " 10) Correlations 0.58 0.52 0.55 0.56 0.69 PEV 58 74 60 60 46 Rel PEV 100 128 104 104 79 B0 (100 " 0 / 55 " 0) Correlations 0.70 0.56 0.62 0.62 0.76 PEV 45 78 54 54 37 Rel PEV 100 173 120 120 82 B10 (100 " 10 / 55 " 5) Correlations 0.70 0.52 0.61 0.62 0.76 PEV 44 75 54 54 37 Rel PEV 100 170 123 122 84 B20 (100 " 20 / 55 " 10) Correlations 0.71 0.56 0.61 0.61 0.77 PEV 44 74 55 55 36 Rel PEV 100 169 126 126 82 MR is mastitis resistance
ST-MR is single trait mastitis resistance
MT (MR known) is multitrait, mastitis resistance known for all animals
SI-STC is a selection index type multiple regression of MR on other traits, using single trait assumptions SI-MTC is a selection index type multiple regression of MR on other traits, using multitrait assumptions
The first indirect evaluation method (SI-STC) based on a simplified multiple regression for MR on ST SCS, FU and UD EBV showed low correlations between TBV and EBV with values between 0.48 and 0.56. Also PEV were extremely high with values between 74% and 81% of genetic variance showing the problem of predicting accurately using this simplified method. If compared with the ST-MR evaluation, correlations between TBV and EBV were always lower and PEV up to 70% higher.
The second indirect evaluation method (SI-MTC) considered covariances between SCS, FU and UD. As expected it was able to improve the evaluations. Correlations went up to values between 0.51 and 0.62. Prediction error variances were strongly reduced going down to nearly the level of ST-MR and was only between 5% and 26% higher than for the ST direct evaluation. Therefore better indirect evaluations can be obtained using the second set of equations (SI-MTC) obtained with full knowledge of covariances between indicator traits.
The MT method with MR missing showed a slight improvement over the multiple regression method with full knowledge of covariances (SI-MTC) with correlation between 0.55 and 0.62. Prediction error variances were also very similar to those found with (SI-MTC) and were between 54% and 61% of the additive variance.
A MT system that predicts an unrecorded trait is theoretically the most accurate way of procedure. The reason is that the mixed model equations of Henderson (1984) directly in the calculations use the correct selection index like weights to weight information. The SI-MTC method uses the right covariance matrix as MT, but simplified assumptions were made on the information for each sire. In this study, the distribution of daughters was not very heterogeneous and the heritability for MR was also extremely low, so accurate indirect evaluation could already be done using simple selection index theory. But for a general use the MT model has practical advantages as the direct computation of EBV for MR. Also the fact, that if, eventually limited, MR data becomes available, it can be easily integrated leading to a combined evaluation of MR, is an important advantage of this method.
Table 3 shows the results for the combined evaluation based on the MT method using known MR records. As expected, the inclusion of recorded MR in a MT system improved dramatically the
correlations were now between 0.65 and 0.77. Associated was a drop in PEV expressed relative to the ST model between 16% and 21%. These results indicate that traits with low heritability, but correlated to other more heritable traits, can be better evaluated using a MT system.
4. Conclusions
Potential benefits from multitrait evaluation were shown for situations where information on mastitis resistance and strongly correlated traits are available. This result is not surprising as the use of all available information together should give the best evaluation. In situations where no direct mastitis observations are available, using accurate selection index weights (developed using the correlations among these traits) can already give good results. But a more flexible method would be the integration of MR as unrecorded trait in a MT system with SCS, FU and UD being, at least partially recorded. Such a method would also be a good approach if limited MR data is or becomes available as it can integrate these easily. Similar conclusions were made by Weigel (1996) for the use of correlated traits to improve accuracy of early evaluation of length of productive life. Also he concluded that a MT system would directly provide the combination of direct and indirect information if available and would be very easy to use. A conclusion that we can support given our results.
5. Implications of multitrait methods
From a more technical point of view, the use of MT methods, even if their theoretical advantages are clear, is limited because of some problems. First the presence of missing records as in our case for MR, SCS, or FU and UD can complicate the implementation of MT model. Here recent advances as described by Gengler et al. (1997b) based on Ducrocq and Besbes (1993) may have cleared the way to use a canonical transformation to simplify the MT model. Another problem is the fact that different models should be used, as in our example for MR, SCC and udder conformation. We avoided this problem by not simulating fixed effects. Different possibilities can be imagined to solve it. First the different models can be directly taken care of in the mixed model equations (Henderson, 1984). But this approach makes the use of computational
simplifications as canonical transformation impossible or at least difficult. Recently two new ideas emerged that could help solve this problem. First, a method that is currently discussed for test day yield evaluation (Wiggans and Goddard, 1996) would be to split the general model in two parts, or two steps. A first part, grouping trait specific fixed effects and a second part that is common for all traits. Iterative solving of both parts or steps using the results from the other step to adjust the data, would yield BLUE estimates for all fixed effects, specific or not, and MT BLUP evaluations for all traits. A second idea would be to use a MT type method based on MACE (Multiple Across Countries Evaluation) like procedures (Schaeffer, 1994). This method would combine daughter yield deviations or deregressed proofs for MR, SCS, or FU and UD in new combined evaluations for MR and also SCS, FU and UD. The disadvantage of MACE is that it is more complicated to use and does not yield interdependent sets of equations, as preliminary genetic evaluations for the different traits or blocks of traits do not use feed-back from the MT step as in the two step model.
6. Acknowledgements
Nicolas Gengler who is Chargé de Recherches of the FNRS, Brussels, Belgium, wants to acknowledge its financial support.
References
De Jong, G. and Lansbergen, L. 1996. Udder health index: selection for mastitis resistance. In: Proc. of the International Workshop on the Improvement of Functional Traits in Cattle, Gembloux, Belgium, INTERBULL Bulletin No
12, Uppsala, Sweden, pp. 42-47.
Ducrocq, V. and Besbes, B. 1993. Solution of multiple trait animal models with missing data on some traits. J. Anim. Breed. Genet. 110, 81-92. Emanuelson, U., Danell, B. and Philipsson, J. 1988.
Genetic parameters for clincal mastitis, somatic cell counts, and milk production estimated by multiple-trait restricted maximum likelihood. J.
Dairy Sci. 75, 467-476.
Gengler, N., and Misztal, I. 1996. Approximation of reliability for multiple-trait animal models with
Gengler, N., Wiggans, G.R., Wright J.R., Norman, H.D. and Wolfe, C.W. 1997a. Estimation of (co)variance components for Jersey type traits using a repeatability model. J. Dairy Sci., in press.
Gengler, N., Wiggans, G.R., Wright J.R., Norman, H.D. and Wolfe, C.W. 1997b. Application of canonical transformation with missing values to multitrait evaluation of Jersey type. J. Dairy Sci., in press.
Harris, B.L. Freeman, A.E. and Metzger, E. 1992. Analysis of herd life in Guernsey dairy cattle. J.
Dairy Sci. 75, 2008-2016.
Henderson, C.R. 1984. Application of linear models
in animal breeding. University of Guelph,
Guelph, Canada, 462 pp.
INTERBULL. 1996. Sire evaluation procedures for non-dairy production and growth & beef production traits prectised in various countries.
INTERBULL Bulletin No 13, Uppsala, Sweden,
pp. 201.
Misztal, I., Lawlor, T.J., Short, T.H. and Van Raden, P.M. 1992. Multiple-trait estimation of variance components of yield and type traits using an animal model. J. Dairy Sci. 75, 544-551.
Rogers, G.R. 1996. Using type for improving health of the udder and feet and legs. In: Proc. of the International Workshop on the Improvement of Functional Traits in Cattle, Gembloux, Belgium,
INTERBULL Bulletin No 12, Uppsala, Sweden,
pp. 33-41.
Shook, G.E. 1989. Selection for disease resistance. J.
Dairy Sci. 72, 1349-1362.
Schaeffer, L.R. 1994. Multiple-country comparision of dairy sires. J. Dairy Sci. 77, 2671-2678. Weigel, K.A. 1996. Use of correlated trait
information to improve the accuracy of early predictions of breeding value for length of productive life. In: Proc. of the International Workshop on the Improvement of Functional Traits in Cattle, Gembloux, Belgium,
INTERBULL Bulletin No 12, Uppsala, Sweden,
pp. 125-135.
Wiggans, G.R. and Goddard, M.E. 1996. A test day model for genetic evaluation of yield traits: possible benefits and an approach for implementation. J. Dairy Sci. 79(suppl. 1), 144.