RESEARCH ARTICLE
Deterministic modelling of seed dispersal
based on observed behaviours of an endemic
primate in Brazil
Nima RaghunathanID1,2☯¤*, Louis Franc¸ois1☯, Eliana Cazetta2☯, Jean-Luc PitanceID1☯,
Kristel De VleeschouwerID3,4☯, Alain Hambuckers1☯
1 UR SPHERES, University of Liege, Liège, Belgium, 2 Graduate Program in Ecology and Biodiversity Conservation, Applied Ecology and Conservation Lab, Universidade Estadual de Santa Cruz, Ilhe´us, BA, Brazil, 3 Centre for Research and Conservation, Royal Zoological Society of Antwerp, Antwerpen, Belgium,
4 Bicho do Mato Research Institute, Belo Horizonte, MG, Brazil ☯These authors contributed equally to this work.
¤ Current address: WWF-Belgium, Bruxelles, Belgium
*nima_toad@hotmail.com
Abstract
Plant species models are among the available tools to predict the future of ecosystems threatened by climate change, habitat loss, and degradation. However, they suffer from low to no inclusion of plant dispersal, which is necessary to predict ecosystem evolution. A vari-ety of seed dispersal models have been conceived for anemochorous and zoochorous plant species, but the coupling between vegetation models and seed dispersal processes remains rare. The main challenge in modelling zoochoric dispersal is simulating animal movements in their complex habitat. Recent developments allow straightforward applica-tions of hidden Markov modelling (HMM) to animal movements, which could ease generali-zations when modelling zoochoric seed dispersal. We tested the use of HMM to model seed dispersal by an endangered primate in the Brazilian Atlantic forest, to demonstrate its poten-tial simplicity to simulate seed dispersal processes. We also discuss how to adapt it to other species. We collected information on movement, fruit consumption, deposition, and habitat use of Leontopithecus chrysomelas. We analysed daily trajectories using HMM and built a deterministic Model Of Seed Transfer (MOST), which replicated, with good approximation, the primate’s movement and seed deposition patterns as observed in the field. Our results suggest that the dispersal behaviour and short daily-trajectories of L. chrysomelas restrict the species’ role in large-scale forest regeneration, but contribute to the prevalence of resource tree species locally, and potentially maintaining tree diversity by preventing local extinction. However, it may be possible to accurately simulate dispersal in an area, without necessarily quantifying variables that influence movement, if the movement can be broken down to step-length and turning angles, and parametrised along with the distribution of gut-transit times. For future objectives, coupling MOST with a DVM could be used to test hypoth-eses on tree species survival in various scenarios, simulating regeneration and growth at regional scales by including data on main dispersal agents over the area of interest, distribu-tion of tree species, and land use data. The principal advantage of the MOST model is its functionality with data available from the literature as the variables are easy to parametrise.
a1111111111 a1111111111 a1111111111 a1111111111 a1111111111 OPEN ACCESS
Citation: Raghunathan N, Franc¸ois L, Cazetta E,
Pitance J-L, De Vleeschouwer K, Hambuckers A (2020) Deterministic modelling of seed dispersal based on observed behaviours of an endemic primate in Brazil. PLoS ONE 15(12): e0244220.
https://doi.org/10.1371/journal.pone.0244220 Editor: Francesco Rovero, Universita degli Studi di
Firenze Dipartimento di Biologia, ITALY
Received: June 10, 2020 Accepted: December 4, 2020 Published: December 28, 2020
Copyright:© 2020 Raghunathan et al. This is an open access article distributed under the terms of theCreative Commons Attribution License, which permits unrestricted use, distribution, and reproduction in any medium, provided the original author and source are credited.
Data Availability Statement: All relevant data are
within the manuscript and itsSupporting Informationfiles.
Funding: NR: Fonds pour la formationà la Recherche dans l’Industrie et dans l’Agriculture (F. R.S.-FRIA), Belgium, Wallonie-Bruxelles International (WBI), Belgium, Direction Administration de Recherche et De´ve´loppement (DIR-ARD) NR & EC: Coordenac¸ão de Aperfeic¸oamento de Pessoal de Nı´vel Superior -Brasil (CAPES) - Finance Code 001https://www.
We suggest using the coupled model to perform experiments using only available informa-tion, but varying the numbers and species of seed dispersers, or modifying land cover or configuration to test for possible thresholds preventing the extinction of selected tree species.
Introduction
In tropical ecosystems particularly, zoochory is the dominating mechanism by which tree seeds are dispersed. The animals’ movement guided by several environmental factors, coupled with gut transit time, ultimately determines seed deposition pattern [1]. Many studies have shown that the movement of animals (or groups of animals) within their home ranges depends on the spatial distribution of resources like fruiting tree species, or more generally, their food resources, water bodies, or sleeping sites (e.g. [2,3]). Other factors that could influence trajec-tories, such as canopy cover, might limit visibility to predators and increase connectivity. The presence of liana conglomerates might offer protection from rain and high temperatures, while proximity to humans, and seasonality or weather conditions may also influence species’ daily paths [4–6]. Also, for territorial species, potential conflict zones with other neighbouring individuals or groups can also influence their daily trajectories [7].
Tree species are sessile organism whose survival depends on seed dispersal processes, face a dual risk from climate change, besides an immediate risk from defaunation (i.e. loss of frugi-vores), that can restrict their survival. Indeed, we are facing the sixth mass extinction event [8]. This current wave of species extinction could be attributed to a synergy among processes such as habitat loss, ecosystem degradation, and climate change. In areas where moving in altitude remains a possibility, the number of plant species is increasing on the mountain summits of Europe [9], species are at higher risk on their warmer trailing edge, as, for instance, demon-strated with the retreat of the Atlas cedar in Moroccan mountains during the last decades [10]. In lowlands, plant migration largely lags behind climate warming [11]. The ability to foresee how these threats could affect biodiversity in the future is of paramount importance for con-servation planning. It can be suggested that in lowland areas, opportunities for seeking appro-priate climate are limited.
In theory, Dynamic Vegetation Models (DVMs) could simulate future plant composition and productivity for terrestrial ecosystems under different transitory environmental condi-tions (see for instance [12,13]). DVMs could also be coupled with agent-based models predict-ing land use change [14], thus giving the opportunity to map the evolution in the course of time of suitable areas and their connections. However, vegetation modelling often suffers from low to no inclusion of plant dispersal, while this is necessary to predict the evolution of forest ecosystems [15]. To include plant dispersal in modelling, an approach was developed relying on a cellular automaton that limits pixel occupancy on a suitability map for future time slices, by computing dispersal from already occupied pixels [16]. While very useful to estimate dis-persal rates, this method does not permit computing the disdis-persal rate while taking into account any variations in environmental conditions. Another approach is based on the mathe-matical description or on the mechanical modelling of the dispersal processes. This was previ-ously done for seeds of wind-dispersed tree species [17–19] animal-dispersed species [20] and also in theory [21].
The main challenge in modelling zoochoric dispersal is simulating animal movements in their complex habitat. This problem is reflected in the variety of approaches implemented in
frs-fnrs.be/fr/ http://www.wbi.be/ https://www. capes.gov.br/. The funders had no role in study design, data collection & analysis, decision to publich, or preparation of the manuscript.
Competing interests: The authors have declared
the models described above and their limited scope because of a lack of operating instructions to include several animal species. For example, i) Russo et al. [20] focused on the seeds’ move-ment rather than on animal movemove-ments which imply intensive field studies, ii) Levey et al. [22] conceived a movement sub-model very specific for the conditions they studied (harvested patches in a mature forest), iii) Boyer & Lo´pez-Corona [21] finely analysed the effect of the dis-tribution of animal plant resources but their methods remained theoretical and the models seem difficult to parametrise, iv) Bialozyt et al. [23] needed a deep knowledge of behaviour of their focal dispersing agent as well as environmental characteristics to build an agent-based model, which may be delicate to parametrise while, v) Nield et al. [24] made an in-depth statis-tical analysis of the trajectories but without taking into account the influence of habitat hetero-geneity. However, recent developments allow a straightforward application of Hidden Markov Modelling (HMM) to animal movements, which could ease the generalization of a model of animal seed dispersal. In HMM, the time series of positioning data are processed to obtain angle and step time series. These new series are used for the identification of changes in state or behaviour (step lengths, and turning angles) and the computation of probabilities of switch-ing between states also takswitch-ing into account local environmental parameters [25–28].
Our objective was to build a deterministic model of seed dispersal by a primate species that could be further adapted to other animal species. We collected field data to parameterize and validate the projected model. We focused the observations on a group of the endangered spe-ciesLeontopithecus chrysomelas (Golden-headed lion tamarins, hereafter tamarins) in
Brazil-ian Atlantic Forest (BAF) interacting with fruits produced byPourouma spp. trees. We first
established the daily trajectory of a habituated group of tamarins, and recorded fruit consump-tion and seed deposiconsump-tion events, in combinaconsump-tion with environmental variables. Then, we ana-lysed the movement within the home range using HMM in relationship with environmental variables. Finally, we conceived and coded, using Fortran 90 programming language [29], a model of seed deposition with random components by combining HMM results, habitat char-acteristics and gastrointestinal transit time, which could be validated by comparing its outputs with the deposition data from the field. We further examined how to couple with a DVM and adapt to other animal and plant species.
Methods
Study sites
The fieldwork took place in 2015–2016 in the district of Coloˆnia, within the municipality of Una, Southern Bahia, Brazil (15˚ 17’ 8” & 39˚ 8’ 1”; SISBIO permit number 47178–1). The for-est is classified as lowland Atlantic rainforfor-est. The region has an average annual precipitation of ~2000 mm/year, and average annual temperature of 24˚C. The study area (hereafter Colo ˆ-nia) is comprised mostly of regenerating areas, that were formerly rubber (Hevea brasiliensis),
or rubber and cacao (Theobroma cacao) plantations. Some areas within the mosaic are still
active for shade-grown cacao harvesting or banana production, with some plantations har-bouring a combination of rubber with banana. De Vleeschouwer and Oliveira [30] describe the characteristics of the rubber plantations in this area, suggesting potential reasons for the tamarins to frequent such areas, despite anthropogenic activity that occurs within this habitat. The forested area is interspersed with some manioc plantations (Manihot esculenta), not used
by the tamarins, and therefore not considered as part of their home range. We also used loca-tion data from two other tamarin groups, which came from a 2006 study that took place in the Una Biological Reserve. Una Biological Reserve is comparable to Coloˆnia since both areas are situated in the Una municipality, with similar rainfall patterns and a largely proportion of regenerating forests area. At Una Biological Reserve however, there are no anthropogenic
activities, and there is a larger proportion of advanced secondary forests, largely due to its pro-tected status and undisturbed natural regeneration [31].
Pourouma trees in the study site
We focus this study on tamarin dispersal ofPourouma seeds due to the fact that Pourouma
seeds are one of the largest that tamarins can swallow (~11.9 mm by 10.5 mm), and also due to the long fruiting season of the species each year (typically from mid/end October to late April). In areas with high levels of defaunation, large-seeded species are at higher risk of local extinc-tion [32]. The level of defaunation was not directly quantified in our study site, but the region is known to be defaunated [33]. There were at least 3 species ofPourouma in the Coloˆnia study
area, and we observed that the fruiting period began and ended between November and April.
Primate groups
All applicable institutional and/or national guidelines for the care and handling of animals were followed. Animal handling complied with the protocols approved by the Ethics Committee on Animal Experimentation at the Universidade Estadual de Santa Cruz (number 13/07). At Colo ˆ-nia, we studied one group of tamarins composed of 4 adults (2 males, 2 females) in the begin-ning of the study, and four adults, one juvenile, and one infant at the end of the study. In Una Biological Reserve the two groups had 6 individuals each (group 1: 4 adults, 1 juvenile, 1 sub-adult; group 2: 3 adults, 1 juvenile, 2 sub-adults). The habituation process [34] was completed prior to the onset of observations for all the three groups and followed the protocol described by Dietz et al. [35]. At least one adult individual in each group had a radio collar affixed, to follow the groups using radio-telemetry. The groups were observed from sleeping site to sleeping site (i.e. from the moment they left the sleeping site in the morning, until the end of the day when they return to the same or a different sleeping site). Every 20 minutes, we noted the coordinates using a Garmin etrex 30 GPS. Only complete observation days were used for analyses (26 days for Coloˆnia group, 46 and 50 for the two Una Biological Reserve groups). In both study sites (Colonia and Una Biological Reserve), groups were followed between 4 to 6 days per month, with at least one day per week of complete observations. Weather was the principal reason for “incomplete” days, i.e. not able to remain in the field until the group reached their sleeping site.
For the Coloˆnia group, behaviours relating to feeding, territoriality, predator presence, were recorded using all-occurrence sampling, while resting/grooming/play, were recorded using scan sampling, though were not used in this analysis. Territoriality behaviours included direct encounters with other groups. Vocalisations linked to territoriality were recorded, but not used in the analyses. Predator presence was recorded both via alarm calls (not all predators were visible), and vigilance behaviours. Any movement away from a position following an alarm call was considered a direct response to predator presence. Additionally, for the Coloˆnia group, faecal samples were collected ad libitum. Locations of all scat deposits withPourouma
seeds were marked with GPS, and dispersal distances from parent-trees were estimated, based on average gut-transit time. The estimated average gut retention times inLeontopithecus rosa-lia was 74 minutes (+/- 18 minutes) [36]. In this field study, the time difference between the deposition of the faecal sample containing a seed of interest, and the feeding behaviour obser-vations permitted an average calculation of seed transit time of 75.20 minutes (standard devia-tion = 19.50;S2 Fig), which was concordant withL. rosalia. We estimated passage through
digestive tract calculating the interval between defecation containing seeds (faecal samples without seeds were not included in the analyses) and the prior feeding behaviour of the species’ in the sample by analysing the combination of seeds found in the faecal sample. When the most likely parent tree was corroborated (in some instances, a mean distance was calculated if
the group consumed fruits from individuals of the same species within minutes and metres of each other), the defecation distance between the faecal sample and parent tree was calculated, using ArcMAP v. 10.5.1. The seasonal home range area was also calculated using the minimum convex polygon in ArcMap10.5.1., though we also identified the 95% kernel (P95%)–i.e. the zones where the probability of encountering the group is 0.95. For the purposes of this study, the home range was calculated during one fruiting season ofPourouma. This should be
con-sidered a seasonal home range, as the full extent of the group’s home range was not evaluated due to the limited field time. For the two groups from Una, complete days covered a whole year, for this reason the observation days was almost two times higher.
Environmental data from Colo
ˆnia de Una (Coloˆnia)
To test for possible environmental variables that could influence tamarin movement and vali-date the model, we set up 14 transects spaced 50 m from each other. In each transect we installed 15x15 m plots each 15 m apart. The number of plots within each transect varied based on transect length that range from 2 to 9, and we ended with a total of 70 (15m x 15m) plots in the home-range corresponding to the fruiting season. The number of plots per transect varied based on the length of the transect, which ran south-north between the southernmost and northernmost limits of the home-range corresponding to the fruiting season of Pourouma species. The distance between 15m x 15m plots was 50m, and the distance between one plot and the next along the same transect (i.e. from the northernmost side of one plot and the southernmost side of the next) was 15m. In each plot we evaluated the basal area of fruit resources, and the leaf area index. We did not distinguish between male and females of dioe-cious species. Individuals of species known as fruiting resources were considered as potential resources and the basal area was calculated. In each plot, the trees were identified (at least to family level) for all individuals with a DBH > 5cm and the basal area of the known fruit trees was calculated based on the DBH. To estimate leaf area index, we took hemispherical pictures of the canopy. The pictures were taken using a Sigma 8mm f/4 circular Fisheye lens (Equi-angular projection) following the methods described in Bequet et al. (2012) [37] at 9 points in each plot; the pictures were analysed with Hemisfer v.2.16 software [38,39].
Additionally, over a one-week period, during the fruiting peak of the species, we identified and mapped more than 600Pourouma individuals and calculated the Fournier score [40] to obtain a snapshot ofPourouma fruit availability during the season. To obtain a Fournier score,
the percentage of fruits (ripe and unripe) available was scored on a scale of 0 (no fruit) and 1 to 4 (25% to 100%). Less than 25% of thePourouma individuals have mature fruit at any given time
during the fruiting season. The fruit availability index was calculated by multiplying the Fournier score for presence of ripe or unripe fruit with the diameter at breast height (DBH) of all Pour-ouma fruit trees that the tamarins consumed. Finally, we interpolated fruit availability index
(FAI), basal area (BA), and leaf area index (LAI) over the entire seasonal home range, using ordi-nary kriging in ArcMAP to obtain continuous maps. Note that for the two primate groups from Una Biological Reserve, comparable environmental data was not available. The behavioural data from Una Biological Reserve were collected at an earlier date, as part of a separate research proj-ect. The behavioural data collection methods were identical, and therefore comparable between Coloˆnia and Una Biological Reserve groups, but data on other biotic and abiotic characteristics were not available for Una Biological Reserve to allow similar analysis at the time of this research.
Golden-headed lion tamarin movements
Markov modelling requires positioning data at regular time slices. For each primate group, we prepared a single time series, by joining the successive coordinates of all the complete
observation days end-to-end. We used the gamma distribution for the step lengths and the von Mises’ distribution for the angles, based on the goodness of fit. We determined the num-ber of states, by comparing the Akaike information criterion (AIC) of the possible models. Various “physical” environmental variables (FAI, BA and LAI from the kriging maps) were tested as covariates, for increased model fitness. Other factors, more linked to group behav-iour, include distance from the GPS location to: sleeping site, fruiting trees, bromeliads, preda-tors, other groups (i.e. encounter behaviours), and resting sites. Not all possible model
combinations were evaluated. After comparing the AIC values for individual covariates against the null hypothesis, we selected those covariates with the lowest values and tested fitness of combinations. We used distances to these sites as a proxy for “attractors” and movement towards the “closest attractor”, exceptions being predators and encounters. We used the moveHMM v1.2 R package [41] to perform the analyses. The transitions between states were also computed by the package with the equations provided in [41].
Deterministic Model of Seed Transfer (MOST)
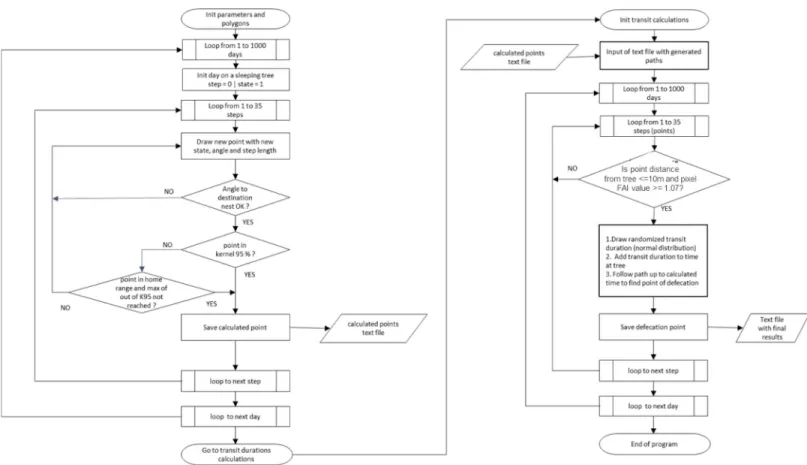
The model (MOST for Model Of Seed Transfer) was written in Fortran 90 [29] to allow spatial extensions and further coupling with a DVM (CARbon Assimiliation In the Biosphere, CAR-AIB) also written in this language [13]. Most of the constants describing the home range, the movements and the animal behaviour, may be changed in a parameter file before executing MOST. We considered plantations and agricultural zones as “no-go” zones (non-habitat areas), in this iteration of MOST, to simplify the real-world observations. This was also due to the fact that noPourouma trees are kept in agro-forestry systems, so no seed swallowing or
def-ecation took place in these areas. In the case of Coloˆnia group, the main sleeping site was also situated at the edge of a plantation area, and the trajectories reflect the short paths that cross a small part of the no-go zone. The model (Fig 1) starts by reading coordinates of the home range and kernel 95% as well as sleeping site positions. A day path counts a succession of 35 steps (successive positions separated by 20 minutes), corresponding to an average day-length of 700 minutes, outside sleeping sites. The initial (morning) and the next selected (evening) sleeping sites were drawn from the re-use frequency. The simulation is initiated by setting the initial state of the HMM to one (note that we selected a two-state HMM) to know which of the distributions to use for angle and step. Accordingly, the first step and the first angle are drawn to reach the first position from the starting sleeping site, using the gamma (step) and the Von Mise’s (angle) distributions. Then, MOST verifies where the position is located within the 95% kernel using the "Winding Number" algorithm (Sunday 2001:http://geomalgorithms.com/ a03-_inclusion.html#wn_PnPoly()). If the position is not within the kernel but still in the home range and maximum count out of the 95% kernel is not reached (see below) then posi-tion is validated. Otherwise, new angles and steps are redrawn until the condiposi-tions are satis-fied. The characteristics of the new position are recorded and based on the new state the next angle and step to reach the next position. To simulate the end of the day, i.e. arbitrary after 26 steps, on average corresponding in the field to the moment where the animals seemed to head to the sleeping-site, the drawn angles are progressively restricted from 360˚ to 22.5˚ to reach the selected sleeping site while the last step automatically drives the group to the selected sleep-ing site position; possibly, they can arrive sooner when their position are less than 10 m. To be able to match the generated position frequencies within the P95%, we first analysed the density distribution of the number of positions of the observed trajectories outside the P95% using the fitdistrplus R package [42]. The obtained distribution with its parameters was used to generate a table of probable numbers of positions outside P95%. MOST records the trajectories, and stores for each of them its number of positions outside P95% and finally keeps only a
subsample of trajectories providing the same numbers of positions outside P95% as table gen-erated from the observed kernel.
Pourouma seed swallowing was simulated if the position was within a distance of 10 m of a Pourouma density pixel larger than 1, and if the pixel value of Pourouma mature fruit score was
above 0.30. This information is read from the kriging maps. The distance has to be introduced because the likelihood that a given generated position will coincide directly with a fruit tree is very low. The three thresholds were selected after tuning. We examined the normality of the observed gut-transit time (Shapiro-Wilk normality test;S2 Fig). Seed gut-transit time is simu-lated by drawing random values with corresponding distribution in the 95% confidence interval of the mean of the observed values, which allows the computation of the coordinates of their deposition further on the trajectory. The simulated spatial dispersal kernels could finally be cal-culated by recording the distances between the fruit trees and the defecation events.
For the validation of MOST’s results, chi-squared tests for frequency were calculated, to evaluate the model’s success at reproducing the observed distances of seeds in faeces from par-ent trees, as well as the distances to the closest congeneric.
Results
Colonia study site, group behaviour, and seasonal home range
The home range corresponding to the fruiting season ofPourouma genus trees for the
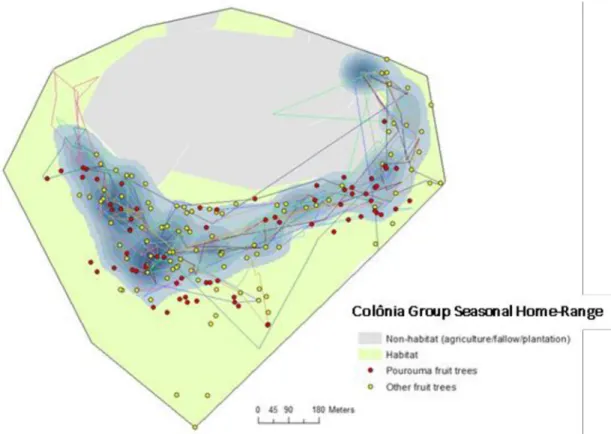
Coloˆ-nia group was approximately 18.77 ha, composed mostly of secondary forest in various
Fig 1. Deterministic Model of Seed Transfer (MOST) algorithm created in Fortran 90 programming language, using parameters extracted from HMM’s two state model.
stages of succession (Fig 2). Six sleeping sites were observed in use during this season, with one sleeping site used more than 75% of the times during the study, i.e. the group returned to the same sleeping site as they left in the morning 75% of the times. The seasonal average of the daily path length for the group was 1,867 m, while the recorded positions outside the P95% could be considered as following a zero-inflated Poisson distribution (S3 Fig). During thePourouma fruiting period, over the 26 complete observation days, we observed the
group consuming fruits from 148 fruiting trees and flowers from 21 non-tree (bromeliads or lianas) individuals, from at least 30 identified species. Only four species had more than five visits (Inga affinis, I. thibaudiana, Pourouma spp, as well as Artocarpus heterophyllus),
with onePourouma fruit tree having 26 visits during the observation period. Of the 168
for-aged individuals (147 fruiting trees, 21 non-tree individuals), 75 were visited only once dur-ing the observation period. 79 individual fruit trees belonged to thePourouma species, of
which 7 individuals had more than 10 visits during the fruiting season, 17 otherPourouma
individuals had between 3–10 visits, and the remaining 55 individuals were visited once during the fruiting season (S1 Table).
In the seventy plots, we recorded 2,216 trees, from 203 species, though 103 individual trees were identified only to family level and were excluded as potential fruiting sources. 50% of the species identified are consumed by tamarins, and thePourouma genus represented 3% of the
sampled individuals.Pourouma mature fruit FAI varied between 0 and 1.99, BA between 18.43
and 40.85 m2/ha, and LAI ranged between 0.088 and 2.005 (seeS4,S5andS6Figs for kriging maps of LAI, BA, andPourouma FAI).
Fig 2. Home range ofLeontopithecus chrysomelas from Coloˆnia group, Coloˆnia de Una, Brazil during Pourouma genus
fruiting season (November to April). Coloured lines show some examples of daily trajectories of group (complete days) used for
HMM analyses, blue areas show the 95% kernel within the seasonal home range.
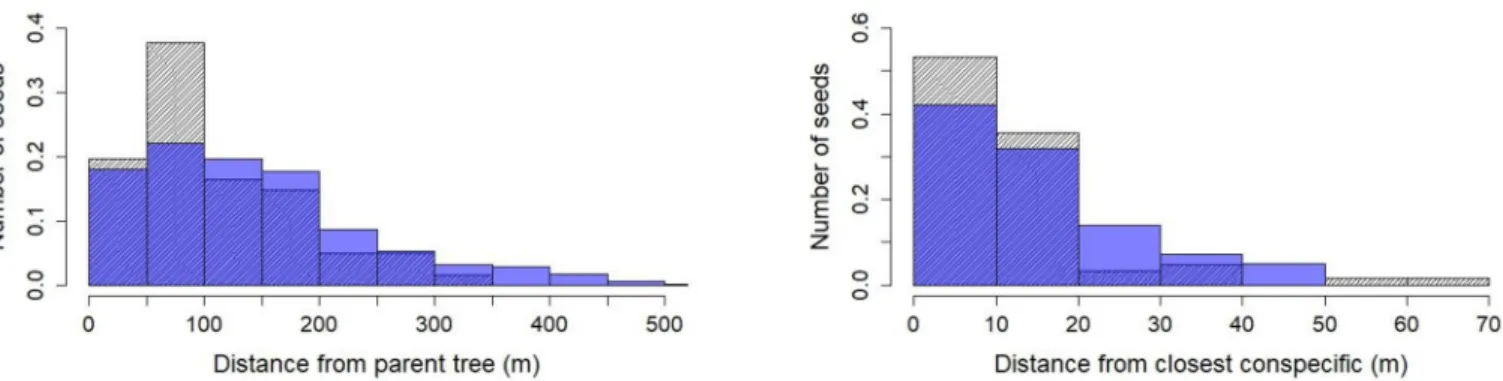
Average gut-transit times follows a normal distribution (S2 Fig). During thePourouma
fruiting season, the Coloˆnia group visited Pourouma trees daily. Average dispersal distances of
Pourouma seeds was 111 m, with peak number of seeds deposited between 60 and 90 m (Fig 3). Given the average transit time in the digestive tract and habitat use, most of the seeds were defecated near congenerics. 80% of all observed defecation events containingPourouma seeds
took place within 30m of a congeneric, 20% within 5m of a congeneric tree (Fig 3).
Model of Seed Transfer (MOST)
For the Coloˆnia group, we selected a two-state HMM, with basal area of fruiting species, along with distance from sleeping sites being key predictors of transition (S2andS3Tables), based on the AIC. Parameters used to change from state 1 to state 2 are also provided (transition probabili-ties). State 1 comprised the longest step lengths, shorter turning angles, and fewer pauses, while state two was characterised by shorter step lengths, larger angles, and more pauses. Testing the model with other co-variates demonstrated higher AIC values and all model combinations’ AIC values were still higher than that of basal area and distance to fruiting trees (S2andS3Tables).
MOST correctly reproduced the trajectories within the Coloˆnia group’s seasonal home range (Fig 4) but the simulation of seed deposition was sensitive to the threshold value for mature fruit and the distance toPourouma to provoke swallowing, and the final values were
obtained through fine-tuning (distance of 10 m andPourouma FAI of 0.3 (Fig 5), see alsoS7 Fig). According to the chi-squared tests, the simulated distances of seed deposition were not significantly different from those observed (Figs3,4and5) but the test p-values were close to the thresholds. Distances from parent tree showed a longer tail as expected but it did not appear in distance from closest congeneric.
Discussion
The deterministic Model Of Seed Transfer (MOST) replicated, with good approximation, tama-rins’ movement and seed deposition patterns, as observed in the field. Relative to other seed dis-persal models, this method is simpler and can be used to simulate seed disdis-persal, relying mainly on data obtained from literature, to parametrise or calibrate the model. Such data includes, posi-tion data obtained at regular intervals, distribuposi-tion of key feeding resources, gut transit times. Any additional data on environmental characteristics may be included, such as “go” and “no-go” zones, as we used here. In a more complex home range, or when longer-term data are available, nuances in defining habitat or non-habitat may be relevant. For example, De Vleeschouwer &
Fig 3. Observed (shaded) and simulated (blue) defecated seed distance densities from parent tree ofLeontopithecus chrysomelas from Coloˆnia group,
Coloˆnia de Una, Brazil (chi-squared = 11.738, df = 6, p-value = 0.06807; left) and from closest Pourouma congeneric trees (chi-squared = 78.1645, df = 4, p-value = 0.08573; right).
Oliveira [30] demonstrated that monkeys do in fact useHevea plantations, only when fruit
resources and/or bromeliads are available. A frequency table of presence in different habitats can be calculated with more sampling years, to be incorporated into MOST.
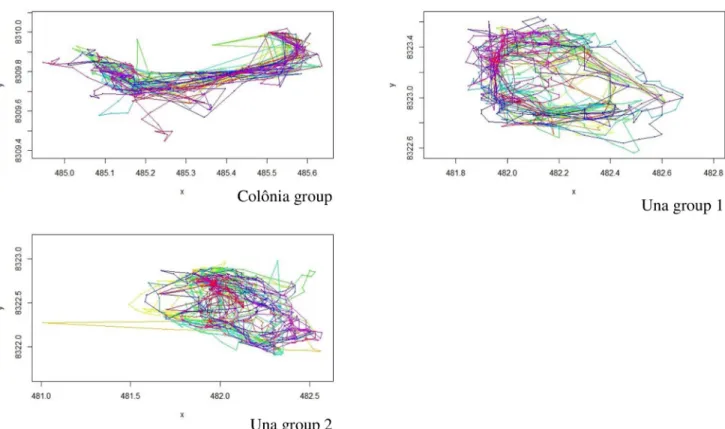
Fig 4. Trajectories of 3 groups (Coloˆnia seasonal trajectories, Coloˆnia de Una, 26 days; Una biological reserve group 1 –annual trajectories, 46 days; group 2 –annual trajectories, 50 days, Brazil), UTM coordinates (UTM Zone 24) on axis. Each colour represents one daily trajectory (of complete days,
sleeping-site to sleeping-site).
https://doi.org/10.1371/journal.pone.0244220.g004
Fig 5. Map of sub-set of simulated defecation events, with distance toPourouma genus tree of 10 m and mature fruit threshold of 0.3, from MOST and observed
defecation events within the seasonal home range of tamarins (left) and sub-set of simulated trajectories (right), in Coloˆnia de Una, Brazil. https://doi.org/10.1371/journal.pone.0244220.g005
The daily trajectories of the tamarin group, and the local factors influencing them are con-cordant with the literature on variables influencing animal movements: food resource and sleeping site distribution [e.g.39,40,43]. Parameters used to initialise HMM analyses there-fore are influenced by habitat composition and home range size. As the choice between the states (2 or more) relies on thorough biological knowledge of the group or individuals of inter-est, the parameters appropriate for one group may not be relevant for others, as evidenced by the differences between the Coloˆnia and Una Biological Reserve groups (Fig 4), or in another study on macaques in Thailand [44]. The HMM two-state model parameters are directly linked to the home range characteristics of the groups and of course of the species, therefore for each application of the MOST model, environmental characteristics of the home range must be supplied, and this is consistent notably with the theoretical analysis of Boyer & Lo ´pez-Corona [21] who found that the number of movement states should depend on home range heterogeneity. Once the step-length and turning angle are characterised, with as specific as data as possible, updating MOST with parameters is a simpler process than other simulation models, which are too theoretical, agent-based, or lack habitat heterogeneity [21,23,24].
The observed dispersal distances are consistent with other studies onLeontopithecus genus
andSaguinus species [45]. However, it is important to note that in the case of generalist frugi-vores, smaller home range areas with a uniform distribution of fruit resources might dilute any potential patterns in behaviour, particularly linked to feeding. More importantly, our results sug-gest that within a degraded, mosaic habitat, tamarins may maintain their habitat at a local level or eventually improve the availability of its resource species, but mostly inside their P95% sea-sonal home ranges. This should not be disregarded because it is probably a mechanism fostering plant species local abundance and preventing local extinction. We hypothesise, that in this spe-cific context of degraded and defaunated areas, species like tamarins had a disproportionate importance. Of course, complementary studies from other frugivores will be very important to ascertain the contribution of tamarins. As they can swallow only up to a certain seed-size, they can help disperse their main fruit resources and maintain tree regeneration within a small area. However, the movement and dispersal patterns of tamarins suggest that they disperse seeds within the habitats where germination and growth is viable, and can therefore at least maintain resource availability. This potential maintenance of the habitat by tamarins is simply that–it does not imply that natural regeneration processes via endozoochory could restore the full level of plant diversity. While it is suggested that zoochoric maximal dispersal distance could be related to home range size [46,47], this could give a false image of the real dispersal efficiency since it does not take into account seed dispersal away from congenerics.
MOST was able to simulate trajectories resembling the observed data. However, due to the statistical way the HMM is computed, it had to verify that each new step remained inside the home range or in the 95% kernel and if not, redraw values. The moveHMM package uses succes-sions of distances and turning angles for its simulations making it difficult for the simulated movements to mimic real-world constraints that keep animals in a more confined range (R. Langrock, personal communication). However, the package is easy to apply provided the coordi-nates of the animals are regularly spaced in time and the effort is high enough. We evaluated it as a convenient way to model the trajectories. The seed distribution patterns simulated by MOST were less similar to the observed data. Since more events were simulated rather than observed, we expected to get more extreme dispersal distance values. However, this only hap-pened with distance from parent trees and not with distance from congenerics. This could be caused by the fact that MOST does not use real positions ofPourouma and their fruit availability
index but kriging maps, which are only extrapolations of real conditions. Moreover, we found that the simulated dispersal distances was affected by the thresholds set for distance from fruiting tree, and fruit availability index which trigger seed swallowing. It may be possible to improve the
fit, if necessary, as the user may have an option to simulate scenarios of higher or lower densities of fruiting trees of interest, which can be applied toin-situ conservation measures.
Since it could be locally important to compute the seed rain, the modelling of this impor-tant ecosystem characteristic has to be included in vegetation models. In order to make the connection between the DVM and MOST and thus simulate the growth of the dispersed seeds, it is first cardinal to take into account the scale of the processes. On the one hand, MOST simu-lates processes occurring between individuals (trees and animals) on area of some sq. km (here, the home range size was only 0.18 sq. km) while the tree species range can cover areas of thousands of sq. km. Also, DVMs generally consider the growth of the species over domains of this size (i.e. several thousands of square kilometres) returning mean value for whole pixel, not for individuals. Thus, an interface between the DVM and MOST should record tree individual growth from the pixel prediction of the DVM.
The second point to take into account is that seed dispersal generally happens through a network of many animal species. MOST has to be applied for each animal species of interest, for the coupling to reflect the whole dispersal processes of the species of interest. Long-range dispersal is obviously fulfilled by birds, bats and large mammals while the smaller species like tamarins maintain or (possibly) improve tree patches more locally. In our field site, we cannot confirm any potential effect of intraspecific, or intrageneric competition.Pourouma saplings
(> 10 cm height) were found within short distances of each other, though only in some forest types. In Stevenson (2007), while they found distance-effects on seedlings ofP. bicolor, the
evi-dence for intraspecific competition was not conclusive [48]. In this study, we indeed routinely observed birds and bats during field work as well as other species likeCallithrix kuhlii (Wied’s
marmoset), orPotos flavus (kinkajou) reported in the eastern Atlantic Forest [49], feeding on thePourouma. Bats are considered good dispersers because they can travel several kilometres
each day, and defecate when flying [50] but it is worthy to note that they generally show high fidelity to swarming sites [51–53] which should produce highly directional dispersal kernel. Seed dispersal by species identified as legitimate dispersers should occur also mainly in their P95% and may also contribute to the clumping of the animal dispersed species [54].
The third point is that it seems nearly impossible to simulate real situations because this requires general, and comprehensive knowledge on density and the home range of all the ani-mal species involved in the processes of dispersion and the distribution of every specimen of the focal tree species over a given area. This exercise would require considerable information and extensive field-work. Some information is available from literature, such as variations in species’ home range size or the gut transit times, and technology progresses will help. Land-scape structure is already largely available from remote sensing with increasing precision, up to the possibility to identify tree species, through the use of small drones [55]. Also, animal presence using camera-traps and tracking with GPS systems becomes easier and cheaper [56–
59], to compute the HMM characteristics.
The seed dispersal process is affected by habitat loss and fragmentation, and ultimately cli-mate change. As habitats shrink, this causes disturbances in frugivore communities, which carry over on plant communities, due to reduced dispersal. For example, Babweteera and Brown [60] demonstrated that the loss of larger-bodied frugivores decreased the assemblages of larger-seeded, climax tree species in disturbed forest fragments. This was due in part to the specific dependency that larger seeded species had on the presence of large-bodied frugivores, and because the small- & medium-bodied frugivores dispersed the seeds at smaller distances. The scale of fragmentation can affect how individuals or groups interact with distances to find habitat, and therefore alter their typical behavioural states [61]. Animal species that may be highly territorial, or have emigrating individuals, that end up with a large density in a small patch of habitat may suffer from local extinctions if they are unable to broaden their home
range [62]. Additionally, in fragmented or degraded landscapes that impact the animal move-ment, due to varying degrees of permeability within a mosaic, the seed dispersal services can be strongly altered both by loss of vegetation producing fruits [63] or change in fruits charac-teristics [64] but also due to behavioural constraints of frugivores [54]. Finally, climate change might alter availability of plant resources for the frugivores in the future [13] and it might eventually directly challenge animal survival [65]. Such complex factors may be slightly harder to capture when coupling MOST with a DVM, though various scenarios can be simulated with more or less fragmented landscapes, and more or fewer dispersal agents. Simulating scenarios with fewer or more dispersal agents can help gain a better understanding of the possible impacts of defaunation on habitat regeneration. Similarly, severely fragmented habitats can limit dispersal opportunities, and further degrade habitats. Simulating dispersal movements using MOST could serve as an opportunity to identify potential zones for connectivity and assisted regeneration when chances of relying on natural dispersal mechanisms are limited due to landscape characteristics.
Conclusion
Movement pattern of our focal species in relation to local habitat characteristics were easily captured using HMM. The information can be transferred in a relatively simple simulator of seed deposition MOST written in Fortran 90. Since simulations with MOST were able to gen-erate quite realistic seed deposition patterns, we concluded that it is valid. Combined with a DVM, MOST can be a useful tool to test hypotheses of tree species survival under climate change by simulating tree regeneration and growth at regional scale. This requires the inclu-sion of behavioural (trajectories), physiological (gut retention times) and abundance data for the main dispersal agents (spectrum of home range sizes with potential animal densities) over the area of interest, the distribution of the tree (abundance) and land use. When resource con-straints preclude field data collection to test on the ground, a feasible approach would be to use the model combination as described above, to perform experiments using already available information, and varying the numbers and the types of dispersers, as well as land and tree con-figuration to test the existence of thresholds preventing the extinction of selected tree species. Bibliographic literature on species movements, habitat preferences, dispersal behaviour is often more readily accessible and can be valuable inputs to adapting the MOST algorithm.
Supporting information
S1 Fig. (TIF) S2 Fig. (TIF) S3 Fig. (TIF) S4 Fig. (TIF) S5 Fig. (TIF) S6 Fig. (TIF)S7 Fig.
(TIF)
S1 Table. Frequency of visits of feeding trees in Coloˆnia de Una, during Pourouma fruiting season (November–April).
(DOC)
S2 Table. Selection of the hidden Markov model (HMM) simulating animal movements within the home range ofLeontopithecus chrysomelas.
(DOC)
S3 Table. Selected model: BA+SS (basal area of fruiting trees + distance to sleeping sites).
(DOC)
Acknowledgments
The Centre for Research and Conservation at the Royal Zoological Society of Antwerp (CRC-RZSA), Belgium, provided in-situ infrastructure and support. We would also like to acknowl-edge the support from: all field assistants, Pr. Roland Langrock, and last but not least, Pr. Julien Hambuckers. We would also like to acknowledge our reviewers, whose eye for detail helped refine this manuscript to an important degree.
Author Contributions
Conceptualization: Nima Raghunathan, Alain Hambuckers. Data curation: Nima Raghunathan.
Formal analysis: Nima Raghunathan, Alain Hambuckers. Funding acquisition: Nima Raghunathan, Alain Hambuckers.
Investigation: Nima Raghunathan, Kristel De Vleeschouwer, Alain Hambuckers.
Methodology: Nima Raghunathan, Louis Franc¸ois, Eliana Cazetta, Kristel De Vleeschouwer,
Alain Hambuckers.
Project administration: Eliana Cazetta, Alain Hambuckers. Resources: Eliana Cazetta, Kristel De Vleeschouwer. Software: Jean-Luc Pitance.
Supervision: Louis Franc¸ois, Eliana Cazetta, Alain Hambuckers. Validation: Louis Franc¸ois, Jean-Luc Pitance.
Writing – original draft: Nima Raghunathan, Alain Hambuckers.
Writing – review & editing: Louis Franc¸ois, Eliana Cazetta, Jean-Luc Pitance, Kristel De
Vleeschouwer.
References
1. Holbrook KM. Home range and movement patterns of toucans: implications for seed dispersal. Biotro-pica. 2011; 43: 357–364.
2. Albert A, Savini T, Huynen MC. The role of Macaca spp. (Primates: Cercopithecidae) in seed dispersal networks. Raffles Bull Zool. 2013; 61: 423–434.
3. Plante S, Colchero F, Calme´ S. Foraging strategy of a neotropical primate: How intrinsic and extrinsic factors influence destination and residence time. J Anim Ecol. 2014; 83: 116–125.https://doi.org/10. 1111/1365-2656.12119PMID:23957316
4. Brotcorne F, Maslarov C, Wandia IN, Fuentes A, Beudels-Jamar RC, Huynen MC. The role of anthropic, ecological, and social factors in sleeping site choice by long-tailed Macaques (Macaca fasci-cularis). Am J Primatol. 2014; 76: 1140–1150.https://doi.org/10.1002/ajp.22299PMID:24810544
5. Granier N, Hambuckers A, Matsuzawa T, Huynen M-C. Density estimates and nesting-site selection in chimpanzees of the Nimba Mountains, Coˆ te d’Ivoire, and Guinea. Am J Primatol. 2014; 76: 999–1010. https://doi.org/10.1002/ajp.22278PMID:25099739
6. Neumann W, Martinuzzi S, Estes AB, Pidgeon AM, Dettki H, Ericsson G, et al. Opportunities for the application of advanced remotely-sensed data in ecological studies of terrestrial animal movement. Mov Ecol. 2015; 3: 8.https://doi.org/10.1186/s40462-015-0036-7PMID:25941571
7. Bateman AW, Lewis MA, Gall G, Manser MB, Clutton-Brock TH. Territoriality and home-range dynam-ics in meerkats, Suricata suricatta: A mechanistic modelling approach. J Anim Ecol. 2015; 84: 260–271. https://doi.org/10.1111/1365-2656.12267PMID:24995457
8. Barnosky AD, Matzke N, Tomiya S, Wogan GOU, Swartz B, Quental TB, et al. Has the Earth’s sixth mass extinction already arrived? Nature. 2011; 471: 51–57.https://doi.org/10.1038/nature09678PMID:21368823
9. Steinbauer MJ, Grytnes JA, Jurasinski G, Kulonen A, Lenoir J, Pauli H, et al. Accelerated increase in plant species richness on mountain summits is linked to warming. Nature. 2018; 556: 231–234.https:// doi.org/10.1038/s41586-018-0005-6PMID:29618821
10. Cheddadi R, Henrot AJ, Franc¸ois L, Boyer F, Bush M, Carre´ M, et al. Microrefugia, climate change, and conservation of Cedrus atlantica in the Rif Mountains, Morocco. Front Ecol Evol. 2017; 5: 1–15.https:// doi.org/10.3389/fevo.2017.00114
11. Bertrand R, Lenoir J, Piedallu C, Riofrı´o-Dillon G, de Ruffray P, Vidal C, et al. Changes in plant commu-nity composition lag behind climate warming in lowland forests. Nature. 2011; 479: 517–520.https://doi. org/10.1038/nature10548PMID:22012261
12. Raghunathan N, Franc¸ois L, Dury M, Hambuckers A. Contrasting climate risks predicted by dynamic vegetation and ecological niche-based models applied to tree species in the Brazilian Atlantic Forest. Reg Environ Chang. 2018.https://doi.org/10.1007/s10113-018-1405-8
13. Raghunathan N, Francois L, Huynen MC, Oliveira LC, Hambuckers A. Modelling the distribution of key tree species used by lion tamarins in the Brazilian Atlantic forest under a scenario of future climate change. Reg Environ Chang. 2015; 15: 683–693.https://doi.org/10.1007/s10113-014-0625-9
14. Fontaine CM, Dendoncker N, De Vreese R, Jacquemin I, Marek A, Van Herzele A, et al. Towards partic-ipatory integrated valuation and modelling of ecosystem services under land-use change. J Land Use Sci. 2014; 9: 278–303.https://doi.org/10.1080/1747423X.2013.786150
15. Reid JL, Holl KD, Zahawi RA. Seed dispersal limitations shift over time in tropical forest restoration. Ecol Appl. 2015; 25: 1072–1082.https://doi.org/10.1890/14-1399.1PMID:26465043
16. Engler R, Guisan A. MigClim: Predicting plant distribution and dispersal in a changing climate. Divers Distrib. 2009; 15: 590–601.https://doi.org/10.1111/j.1472-4642.2009.00566.x
17. Na¨ther W, Wa¨lder K. Experimental Design and Statistical Inference for Cluster Point Processes–with Applications to the Fruit Dispersion of Anemochorous Forest Trees. Biometrical J. 2003; 45: 1006– 1022.https://doi.org/10.1002/bimj.200390058
18. van Putten B, Visser MD, Muller-Landau HC, Jansen PA. Distorted-distance models for directional dis-persal:: A general framework with application to a: Wind-dispersed tree. Methods Ecol Evol. 2012; 3: 642–652.https://doi.org/10.1111/j.2041-210X.2012.00208.x
19. Nuttle T, Haefner JW. Seed dispersal in heterogeneous environments: Bridging the gap between mech-anistic dispersal and forest dynamics models. Am Nat. 2005; 165: 336–349.https://doi.org/10.1086/ 428298PMID:15729664
20. Russo SE, Portnoy S, Augspurger CK. Incorporation Animal Behavior into Seed Dispersal Models: Implications for Seed Shadows. Ecology. 2006; 87: 3160–3174.https://doi.org/10.1890/0012-9658 (2006)87[3160:iabisd]2.0.co;2PMID:17249240
21. Boyer D, Lo´pez-Corona O. Self-organization, scaling and collapse in a coupled automaton model of for-agers and vegetation resources with seed dispersal. J Phys A Math Theor. 2009; 42: 434014.https:// doi.org/10.1088/1751-8113/42/43/434014
22. Levey DJ, Tewksbury JJ, Bolker BM. Modelling long-distance seed dispersal in heterogeneous land-scapes. J Ecol. 2008; 96: 599–608.https://doi.org/10.1111/j.1365-2745.2008.01401.x
23. Bialozyt R, Flinkerbusch S, Niggemann M, Heymann EW. Predicting the seed shadows of a Neotropical tree species dispersed by primates using an agent-based model with internal decision making for move-ments. Ecol Modell. 2014; 278: 74–84.https://doi.org/10.1016/j.ecolmodel.2014.02.004
24. Nield AP, Nathan R, Enright NJ, Ladd PG, Perry GLW. The spatial complexity of seed movement: Ani-mal-generated seed dispersal patterns in fragmented landscapes revealed by animal movement mod-els. Buckley Y, editor. J Ecol. 2020; 108: 687–701.https://doi.org/10.1111/1365-2745.13287
25. Patterson TA, Basson M, Bravington M V., Gunn JS. Classifying movement behaviour in relation to environmental conditions using hidden Markov models. J Anim Ecol. 2009; 78: 1113–1123.https://doi. org/10.1111/j.1365-2656.2009.01583.xPMID:19563470
26. Langrock R, King R, Matthiopoulos J, Thomas L, Fortin D, Morales JM. Flexible and practical modeling of animal telemetry data: Hidden Markov models and extensions. Ecology. 2012; 93: 2336–2342. https://doi.org/10.1890/11-2241.1PMID:23236905
27. Nabe-Nielsen J, Tougaard J, Teilmann J, Lucke K, Forchhammer MC. How a simple adaptive foraging strategy can lead to emergent home ranges and increased food intake. Oikos. 2013; 122: 1307–1316. https://doi.org/10.1111/j.1600-0706.2013.00069.x
28. Pyke GH. Understanding movements of organisms: It’s time to abandon the L??vy foraging hypothesis. Methods Ecol Evol. 2015; 6: 1–16.https://doi.org/10.1111/2041-210X.12298
29. Redwine C. Upgrading to Fortran 90. New York, NY: Springer New York; 1995.https://doi.org/10. 1007/978-1-4612-2562-1
30. De Vleeschouwer KM, Oliveira LC. Report on the presence of a group of golden-headed lion tamarins (<i>Leontopithecus chrysomelas</i>), an endangered primate species in a rubber plantation in southern Bahia, Brazil. Primate Biol. 2017;4: 61–67.https://doi.org/10.5194/pb-4-61-2017
31. Catenacci LS, De Vleeschouwer KM, Nogueira-Filho SLG, Bahian S, Forest A. Seed Dispersal by Golden-headed Lion Tamarins Leontopithecus chrysomelas in Bahian. Biotropica. 2009; 41: 1–7. https://doi.org/10.1111/j.1744-7429.2009.00530.x
32. de Paula Mateus D, Groeneveld J, Fischer R, Taubert F, Martins VF, Huth A. Defaunation impacts on seed survival and its effect on the biomass of future tropical forests. Oikos. 2018; 127: 1526–1538. https://doi.org/10.1111/oik.05084
33. Canale GR, Peres CA, Guidorizzi CE, Gatto CAF, Kierulff MCM. Pervasive defaunation of forest rem-nants in a tropical biodiversity hotspot. PLoS One. 2012;7.https://doi.org/10.1371/journal.pone. 0041671PMID:22905103
34. Gazagne E, Hambuckers A, Savini T, Poncin P, Huynen M. Toward a better understanding of habitua-tion process to human observer: A statistical approach in Macaca leonina (Primates: Cercopithecidea). Raffles Bull Zool. 2020; 68: 735–749.https://doi.org/10.26107/RBZ-2020-0085
35. Dietz, R., Riget, F., Johansen P. Dietz et al, 1996.pdf. 1996.
36. Lapenta MJ, Proco´pio-de-oliveira P. Some aspects of seed dispersal effectiveness of golden lion tamarins (Leontopithecus rosalia) in a Brazilian Atlantic Forest Some aspects of seed dispersal effectiveness of golden lion tamarins (Leontopithecus rosalia) in a Brazilian Atlantic forest. 2008; 1: 122–139.
37. Bequet R, Kint V, Campioli M, Vansteenkiste D, Muys B, Ceulemans R. Influence of stand, site and meteorological variables on the maximum leaf area index of beech, oak and Scots pine. Eur J For Res. 2012; 131: 283–295.https://doi.org/10.1007/s10342-011-0500-x
38. Schleppi P, Conedera M, Sedivy I, Thimonier A. Correcting non-linearity and slope effects in the estima-tion of the leaf area index of forests from hemispherical photographs. Agric For Meteorol. 2007; 144: 236–242.https://doi.org/10.1016/j.agrformet.2007.02.004
39. Thimonier A, Sedivy I, Schleppi P. Estimating leaf area index in different types of mature forest stands in Switzerland: a comparison of methods. Eur J For Res. 2010; 129: 543–562.https://doi.org/10.1007/ s10342-009-0353-8
40. Fournier LA. Un me´todo cuantitativo para la medicio´ n de caracterı´sticas fenolo´gicas en a´rboles. Tur-rialba. 1974; 24: 422–423.
41. Michelot T, Langrock R, Patterson TA. moveHMM: An R package for the statistical modelling of animal movement data using hidden Markov models. Methods Ecol Evol. 2016 [cited 24 Aug 2016].https://doi. org/10.1111/2041-210X.12578
42. Delignette-Muller ML, Dutang C. fitdistrplus: An R Package for Fitting Distributions. J Stat Softw. 2015;64.https://doi.org/10.18637/jss.v064.i04
43. Albert A, Huynen MC, Savini T, Hambuckers A. Influence of Food Resources on the Ranging Pattern of Northern Pig-tailed Macaques (Macaca leonina). Int J Primatol. 2013; 34: 696–713.https://doi.org/10. 1007/s10764-013-9690-z
44. Gazagne E, Pitance JL, Savini T, Huynen MC, Poncin P, Brotcorne F, et al. Seed shadows of northern pigtailed macaques within a degraded forest fragment, Thailand. Forests. 2020; 11: 1–24.https://doi. org/10.3390/f11111184
45. Cardoso NA, Le Pendu Y, Lapenta MJ, Raboy BE. Frugivory patterns and seed dispersal by golden-headed lion tamarins (Leontopithecus chrysomelas) in Una Biological Reserve, Bahia, Brazil. Mamma-lia. 2011; 75: 327–337.https://doi.org/10.1515/MAMM.2011.042
46. Palminteri S, Powell G V., Peres CA. Advantages of granivory in seasonal environments: Feeding ecol-ogy of an arboreal seed predator in Amazonian forests. Oikos. 2012; 121: 1896–1904.https://doi.org/ 10.1111/j.1600-0706.2012.20456.x
47. Pakeman RJ. Plant migration rate and seed dispersal mechanisms. J Biogeogr. 2001; 28: 795–800. https://doi.org/10.1046/j.1365-2699.2001.00581.x
48. Stevenson PR. A test of the escape and colonization hypotheses for zoochorous tree species in a West-ern Amazonian forest. Plant Ecol. 2007; 190: 245–258.https://doi.org/10.1007/s11258-006-9205-5
49. Helgen K, Kays R, Pinto C, Schipper J. Bassaricyon medius. In: The IUCN Red List of Threatened Spe-cies 2016: e.T48637802A48637905. 2016.
50. Oleksy R, Giuggioli L, McKetterick TJ, Racey PA, Jones G. Flying foxes create extensive seed shadows and enhance germination success of pioneer plant species in deforested Madagascan landscapes. PLoS One. 2017; 12: 1–17.https://doi.org/10.1371/journal.pone.0184023PMID:28877248
51. Glover AM, Altringham JD. Cave selection and use by swarming bat species. Biol Conserv. 2008; 141: 1493–1504.https://doi.org/10.1016/j.biocon.2008.03.012
52. Gonsalves L, Law B. Seasonal activity patterns of bats in North Sydney, New South Wales: implications for urban bat monitoring programs. Aust Mammal. 2018; 40: 220.https://doi.org/10.1071/AM17031
53. Bologna S, Mazzamuto MV, Molinari A, Mazzaracca S, Spada M, Wauters LA, et al. Recapture of a banded Bechstein’s bat (Chiroptera, Vespertilionidae) after 16 years: An example of high swarming site fidelity. Mamm Biol. 2018; 91: 7–9.https://doi.org/10.1016/j.mambio.2018.03.001
54. Trolliet F, Forget PM, Doucet JL, Gillet JF, Hambuckers A. Frugivorous birds influence the spatial orga-nization of tropical forests through the generation of seedling recruitment foci under zoochoric trees. Acta Oecologica. 2017; 85: 69–76.https://doi.org/10.1016/j.actao.2017.09.010
55. Cruzan MB, Weinstein BG, Grasty MR, Kohrn BF, Hendrickson EC, Arredondo TM, et al. Small Unmanned Aerial Vehicles (Micro-Uavs, Drones) in Plant Ecology. Appl Plant Sci. 2016; 4: 1600041. https://doi.org/10.3732/apps.1600041PMID:27672518
56. Trolliet F, Huynen M-C, Vermeulen C, Hambuckers A. Use of camera traps for wildlife studies. A review. Biotechnol Agron Soc Environ. 2014; 18: 446–454.https://doi.org/10.1016/0308-0161(78)90006-6
57. Lehrke RM, McGregor L, Dyer J, Stanley MC, Dennis TE. An inexpensive satellite-download GPS receiver for wildlife: field trial on black swans. Wildl Res. 2017; 44: 558.https://doi.org/10.1071/ WR17064
58. Taylor PD, Crewe TL, Mackenzie SA, Lepage D, Aubry Y, Crysler Z, et al. The motus wildlife tracking system: A collaborative research network to enhance the understanding of wildlife movement. Avian Conserv Ecol. 2017;12.https://doi.org/10.5751/ACE-00953-120108
59. Fischer M, Parkins K, Maizels K, Sutherland DR, Allan BM, Coulson G, et al. Biotelemetry marches on: A cost-effective GPS device for monitoring terrestrial wildlife. PLoS One. 2018; 13: 1–15.https://doi. org/10.1371/journal.pone.0199617PMID:30063710
60. Babweteera F, Brown N. Can remnant frugivore species effectively disperse tree seeds in secondary tropical rain forests? Biodivers Conserv. 2009; 18: 1611–1627. https://doi.org/10.1007/s10531-008-9546-6
61. Cattarino L, Mcalpine CA, Rhodes JR. Spatial scale and movement behaviour traits control the impacts of habitat fragmentation on individual fitness. J Anim Ecol. 2015; 168–177.https://doi.org/10.1111/ 1365-2656.12427PMID:26250334
62. Henle K, Davies KF, Kleyer M, Margules C, Settele J. Predictors of species sensitivity to fragmentation \t. Biodivers Conserv. 2004; 13: 207–251.https://doi.org/10.1023/B:BIOC.0000004319.91643.9e
63. Pessoa MS, Rocha-Santos L, Talora DC, Faria D, Mariano-Neto E, Hambuckers A, et al. Fruit biomass availability along a forest cover gradient. Biotropica. 2016; 49: 45–55.https://doi.org/10.1111/btp.12359
64. Pessoa MS, Hambuckers A, Benchimol M, Rocha-Santos L, Bomfim JA, Faria D, et al. Deforestation drives functional diversity and fruit quality changes in a tropical tree assemblage. Perspect Plant Ecol Evol Syst. 2017; 28: 78–86.https://doi.org/10.1016/j.ppees.2017.09.001
65. Boyles JG, Seebacher F, Smit B, McKechnie AE. Adaptive thermoregulation in endotherms may alter responses to climate change. Integr Comp Biol. 2011; 51: 676–690.https://doi.org/10.1093/icb/icr053 PMID:21690108