HAL Id: hal-02296282
https://hal.archives-ouvertes.fr/hal-02296282
Submitted on 25 Sep 2019
HAL is a multi-disciplinary open access
archive for the deposit and dissemination of
sci-entific research documents, whether they are
pub-lished or not. The documents may come from
teaching and research institutions in France or
abroad, or from public or private research centers.
L’archive ouverte pluridisciplinaire HAL, est
destinée au dépôt et à la diffusion de documents
scientifiques de niveau recherche, publiés ou non,
émanant des établissements d’enseignement et de
recherche français ou étrangers, des laboratoires
publics ou privés.
Accurate small bowel lesions detection in wireless
capsule endoscopy images using deep recurrent attention
neural network
Rémi Vallée, Antoine Coutrot, Nicolas Normand, Harold Mouchère
To cite this version:
Rémi Vallée, Antoine Coutrot, Nicolas Normand, Harold Mouchère. Accurate small bowel lesions
de-tection in wireless capsule endoscopy images using deep recurrent attention neural network. IEEE 21st
International Workshop on Multimedia Signal Processing (MMSP 2019), Sep 2019, Kuala Lumpur,
Malaysia. �hal-02296282�
Accurate small bowel lesions detection in wireless
capsule endoscopy images using deep recurrent
attention neural network
R´emi Vall´ee
LS2N UMR CNRS 6004 University of Nantes Nantes, France [email protected]Antoine Coutrot
LS2N UMR CNRS 6004 University of Nantes Nantes, France [email protected]Nicolas Normand
LS2N UMR CNRS 6004 University of Nantes Nantes, France [email protected]Harold Mouch`ere
LS2N UMR CNRS 6004 University of Nantes Nantes, France [email protected]Abstract—Wireless capsule endoscopy (WCE) allows medical doctors to examine the interior of the small intestine with a non-invasive procedure. This methodology is particularly important for Crohn’s disease (CD), where an early diagnosis improves treatment outcomes. However, the viewing and evaluation of WCE videos is a time-consuming process for the medical experts. In this work, we present a recurrent attention neural network for the detection in WCE images of CD lesions in the small bowel. Our classifier reaches 90.85% accuracy on our own dataset annotated by experts from the Hospital of Nantes. The model has also been tested on a public endoscopic dataset, the CAD-CAP database used for the GIANA competition, and achieves high performance on detection task with an accuracy of 99,67%. This automatic lesion classifier will greatly reduce the amount of time spent by gastroenterologists in reviewing WCE videos, which will likely foster the development of this technique and speed-up the diagnosis of CD.
Index Terms—Deep learning, recurrent attention model, Crohn’s disease, medical images classification
I. INTRODUCTION
Since the mid-1990s, the development of wireless capsule endoscopy (WCE) improves the diagnosis of the Crohn’s disease (CD) and its early treatment [1]. This minimally invasive technology offers significant diagnostic performance due to its ability to fully explore the 3 to 4 metres of the small bowel. It is now well accepted by the entire scientific community [2]. As angiodysplasia, its establishment is largely based on the detection of intestinal lesions that can be more easily detected with WCE aid. The diagnosis of CD is based on two scores: the Capsule Endoscopy Crohn’s Disease Activity Index (CECDAI) [3] and Lewis’ score [4]. These indicators depend on the number of lesions, their types and locations in the small bowel. As these scores are related to the number and precise identification of the lesions, it is necessary for gastroenterologists to view all 50,000 images generated by the WCE for each patient, which can be very time-consuming (30-60 minutes per read in most studies [5]).
Various systems have been developed to limit the time required for gastroenterologists to analyze data. Many efforts have been made to detect intestinal lesions from images obtained by
WCE. These works can be classified into two main cate-gories: algorithms based on ad hoc techniques presented in section II-A and algorithms based on convolutional neural networks (CNN), presented in section II-B. These networks allow the automatic extraction of features that make them more resilient and accurate, but also more complex to train because of the large amount of labeled ground truth required to learn their parameters.
To gather enough data to train neural networks, we set up a collaboration between the Hospital of Nantes and the Digital laboratory of Nantes. 3128 labeled WCE images have been collected and will continue to be totted. The choice was therefore made to create a recurrent neural network with attention in the manner of Mnih et al. [6]. This network, rather than taking the entire image as an input, chooses several patches successively extracted from the original image through unsupervised learning that will allow a classification decision to be made after multiple views of the same image. We hypothesize this framework to be particularly efficient with WCE images.
II. RELATED WORKS
A. Ad hoc methods
The first category of algorithms, not based on deep learning, focuses on the extraction of features from WCE images. A classifier is trained to make the link between the characteristics and image classes. Yu et al. [7] use the Local Binary Pattern (LBP) descriptor and the Scale Invariant Feature Transform (SIFT) descriptor before classification using an SVM to detect images containing ulcers. Other algorithms, such as the one developed by Li et al. [8], are based on extracting the colors of the images based on the observation that the color of the ulcers is predominantly white/yellow, then using a network of multilayer perceptrons to perform the classification. There are also techniques based on texture extraction as in Chen et al. [9]. The problem with theses approaches is that they are not very robust to variations in lighting, angle of view and often specific to a type of lesion, making it more difficult to apply in real situations.
B. Deep learning methods
Over the past 4 years, new algorithms based on deep neural networks have been developed to segment and detect lesions from WCE images. These networks stand out for their different architectures and the data used to train them. Aoki et al. propose a network based on an architecture called Single Shot multibox Detector [10]. This network learns to generate delimitation boxes around areas considered pathological. Fan et al. propose a detection algorithm using the AlexNet network [11] driven on their own database containing 8000 WCE images. There is also a deep neural network in the literature called TernausNetV2 [12], a network for image segmentation. This algorithm was applied to the segmentation of images from WCE [13] and was awarded first place in the GIANA competition. Since these different algorithms are tested on different databases, it is difficult to compare their performance.
III. NETWORK ARCHITECTURE
In this article, attention is considered as a sequential decision-making process of an agent interacting with a visual environment. The network is based on the one presented by Mnih et al. 2014 [6] and on the REINFORCE algorithm of Williams 1992 [14]. From this base network, the local features extraction of the What? Network has been improved thanks to a pre-trained VGG16. The memory process has also been upgraded by the addition of a Gated Recurrent Unit (GRU). The ability to control the patch size has been given to the network and is learn by reinforcement learning (RL). A. Recurrent attention neural network
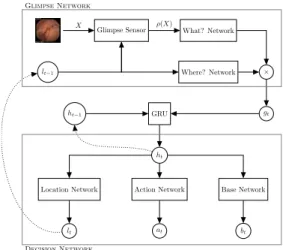
The global architecture of the network is described in Fig. 1. An endoscopic imageX is provided as input to the network. The Glimpse Sensor will then extract a patch ρ(X) from the original image according to lt = (x, y, z) where the
coordinatesx and y are normalized in the interval [−1; 1], i.e. (0, 0) is the center of the image, and z is a zoom coefficient between ]0; 1]. With sx × sy the resolution of the original
image, we get a resolution patch (sx× z) × (sy× z). This
patch is then resized to keep a fixed size at the network input. The subnetwork What? Network, based on VGG16 [15] with batch normalization, pre-trained on ImageNet [16], allows to extract the characteristics of the patch ρ(X). Only the 12 first layers of VGG16 and the first fully-connected layer have been preserved. In parallel, information about extracting the patch lt crosses the Where? Network composed of 2
fully-connected layers, thus allowing the extraction of the characteristics relative to the extraction position of the patch ρ(X). The two characteristic vectors produced by this network are of identical size and multiplied before being subjected to ReLu non-linearity. The new characteristic vector gt at the
output of the non-linearity then contains the “Where?” and “What?” information extracted by the Glimpse Network at time t. A Gated Recurrent Unit [17] (GRU) allows to merge the characteristics extracted at time t by the network with those extracted at the previous time contained in the previous internal stateht−1 of the GRU. This internal state of the GRU
Glimpse Sensor What? Network
lt−1 Where? Network × X ρ(X) gt GRU ht−1 ht
Action Network Base Network Location Network
at bt
lt
Glimpse Network
Decision Network
Fig. 1. Architecture of the RANN : At each time t, we provide the Glimpse sensorwith an endoscopic image X and the location lt−1 of the patch to
extract from the original image. Two independent neural networks, the What? Networkand the Where? Network, will then extract information related to the content and location of the patch. A Gated Recurrent Unit (GRU) will then merge the characteristics previously extracted by the network to produce the current system state ht. From this state, three subnets will independently
produce lt, the position of the next patch to extract, at, a vector containing a
score associated with each class and bt, the baseline from which is calculated
the reward for RL.
will be reused at the next time step.
From the new internal state produced by the GRU, the Action network will produce a vector associating a score to each class. The Baseline Network will allow it to calculate the reward associated with a prediction so that it can train the Location Network by reinforcement. Learning by reinforce-ment is unsupervised and associates to each action of the network a reward that should be maximized by the network. Thus the network will increase the probability of locations maximizing the reward function. If the network classifies the image correctly, the reward is worth the number of views placed on the image minus the sum of baselines calculated by the network.
B. Loss function
The network cost function is a sum of three cost sub-functionsLa,Lb andLr. First, the cross entropy functionLa
computes the network classification error at the last glance at the image with the network prediction ˆYi and the ground
truthYi: La=−1 n n X i=1 Yilog( ˆYi) . (1)
Then, functionLbcalculates the mean square error between
theRi
treward and the btbaseline established by the network
(2). The reward is equal to the number of glances placed on the image if the latter has been correctly classified, 0 otherwise. This baseline, depending on the present and past contexts, allows the reward to be adjusted in order to push the network to improve on its previous results.
TABLE I
CONFUSION MATRIX ONCAP-CADTEST DATASET PROVIDED BYGIANAORGANIZERS. Non-pathological Pathological
Normal Inflammatory-lesions Vascular-lesions
Normal 289 0 3
Inflammatory-lesions 0 297 25 Vascular-lesions 0 28 258
TABLE II
NEURAL NETWORK PERFORMANCE EVALUATION ONGIANAANDCROHN-IPIDATASETS. 3 classes 2 classes
Dataset Accuracy Accuracy Specificity Sensitivity F1 F2 GIANA 93.78% 99.67% 100.00% 98.97% 99.24% 99.51% CROHN-IPI - 90.85% 91.47% 90.22% 90.44% 90.67% Lb= 1 n n X i=1 T X t=1 (bt− Rit)2 (2)
FunctionLrallows to set up the unsupervised RL (3). The
principle is as follows: a strategy π(τj; θ), depending on the
network parametersθ associates a probability to the path τj. A
path is a succession of actionsut, in our case the change of the
location of the patch extraction. Each action results in a new statest, in our case a new patch at the system input. This new
state then influences the system that will produce a new action that will lead to a new state. The objective of the reinforcement algorithm is to maximize the probability of trajectories that maximize the reward (Rt− bt) and a contrario to decrease
the probability of trajectories leading to a low reward. We use Monte Carlo methods to estimate the expected return from a state by averaging the return from M multiple rollouts of a policy. Lr=−1 n 1 M n X i=1 M X j=1 T X t=1 logπ(ujt|s j i:t; θ)(R j t− bt) (3)
IV. EXPERIMENTALRESULTS ANDDISCUSSIONS
The different medical image segmentation and detection algorithms mentioned in above were each tested on different databases, not all containing the same types of lesions. Cur-rently, results of the different methods presented during the Giana competition on the CAP-CAD database [18] are not available but will be published shortly.
A. Results on GIANA
The training dataset contains 1800 images obtained by WCE divided into 3 classes: 600 images with vascular lesions, 600 with inflammatory lesions and 600 containing no pathology. The images of the training base undergo random transfor-mations (rotations, y-mirroring and elastic distortion) during training in order to increase the diversity of examples, thus making it easier for the network to generalize its knowledge. 80% of the images in the database are used to train the network and 20% for validation. The confusion matrix presented in
table III-A show results obtained on the test dataset of the GIANA competition that contains 900 images.
An accuracy of 93.78% is obtained for the three-class classi-fication task (inflammatory lesion, vascular and normal). Since our problem deals with the detection of lesions, the classes vascular-lesions and inflammatory-lesions have been grouped into a “pathological” class. The maximum accuracy on the two-class classification task (pathological, non-pathological) is 99.67%, i.e., about one error for 300 images. Table III-A summarizes different metrics evaluations.
B. Results on CROHN-IPI
The CROHN-IPI (CI) database includes 3218 images di-vided into 7 different classes, 6 corresponding to different types of pathological lesions (aphtoid ulceration, ulceration from 3 to 10 mm, ulceration greater than 10 mm, edema, stenosis, erythema) and a class containing images of non-pathological intestines. These data have been annotated by two gastroenterologists and come from 39 different patients. The dataset contains 1590 pathological images and 1628 non-pathological ones. 70% of the images in the database are used to train the network, 10% for validation and 20% for evaluation. The results obtained are grouped in table III-A. An average accuracy of 89.26% is obtained after 10 cross-validations, for an architecture using 4 views of resolution 80× 80 on the images from WCE and 7 rollouts network from Monte-Carlo sampling.
C. Discussion
The results obtained are inferior on the CI database than on the GIANA database (one error every 10 images on CI versus one error every 300 images on GIANA). There are several reasons for this discrepancy. First, vascular lesions in angiodysplasia are significantly easier to recognize by their bright red color than lesions in Crohn’s disease. Secondly, the GIANA dataset includes 600 images of each of the lesions and 600 non-pathological images, allowing the network to train on 300 examples before being tested. For CI, some classes of lesions such as stenosis or erythema are under-represented (less than 70 examples). Then, it can also be explained by the
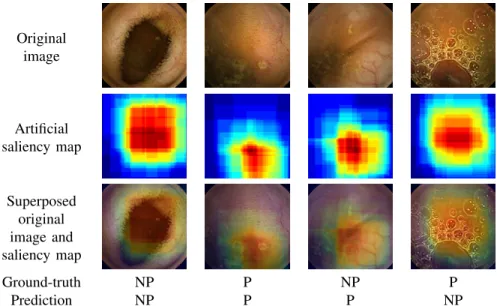
Original image Artificial saliency map Superposed original image and saliency map Ground-truth NP P NP P Prediction NP P P NP
Fig. 2. Examples of artificial saliency maps according to the detection result (with P for the pathological class and NP for the non-pathological one).
way GIANA’s images were chosen compared to those of CI. GIANA images seem much cleaner, containing less image noise (blurred, low light) and intestinal activity noise (fewer bubbles on the images).
As we can see in Fig. 2, the network looks at relevant parts of the image to make the classification decision. These artificial saliency maps are generated by plotting the 4 glimpses for the 7 rollouts networks from Monte-Carlo sampling.
V. CONCLUSION
This article presents the implementation of a recurrent atten-tion neural network architecture. It was trained and tested on two different datasets: GIANA and CI obtaining an accuracy of 99.78% and 90.85% respectively.
The prediction on CI, the dataset built in partnership with the Hospital of Nantes, are less accurate due to the number of complex and more realistic images it contains. The addition of new examples to this database, selected thanks to the understanding of where the network focuses, should allow the network to integrate new cases and thus improve results.
REFERENCES
[1] R. Eliakim, “The impact of panenteric capsule endoscopy on the man-agement of Crohn’s disease,” Therapeutic Advances in Gastroenterology, vol. 10, no. 9, pp. 737–744, 2017.
[2] M. Luj´an-Sanchis, L. Sanchis-Artero, L. Larrey-Ruiz, L. Pe˜no-Mu˜noz, P. N´u˜nez-Mart´ınez, G. Castillo-L´opez, L. Gonz´alez-Gonz´alez, C. B. Clemente, C. Albert Antequera, A. Dur´a-Ayet, and J. Sempere-Garcia-Arg¨uelles, “Current role of capsule endoscopy in Crohn’s disease.,” World journal of gastrointestinal endoscopy, vol. 8, pp. 572–83, sep 2016.
[3] E. Gal, A. Geller, G. Fraser, Z. Levi, and Y. Niv, “Assessment and Validation of the New Capsule Endoscopy Crohn’s Disease Activity Index (CECDAI),” Digestive Diseases and Sciences, vol. 53, pp. 1933– 1937, jul 2008.
[4] I. M. Gralnek, R. Defranchis, E. Seidman, J. A. Leighton, P. Legnani, and B. S. Lewis, “Development of a capsule endoscopy scoring index for small bowel mucosal inflammatory change,” Alimentary Pharmacology & Therapeutics, vol. 27, pp. 146–154, oct 2007.
[5] M. E. McAlindon, H.-L. Ching, D. Yung, R. Sidhu, and A. Koulaouzidis, “Capsule endoscopy of the small bowel,” Annals of Translational Medicine, vol. 4, no. 19, 2016.
[6] V. Mnih, N. Heess, A. Graves, and K. Kavukcuoglu, “Recurrent Models of Visual Attention,” jun 2014.
[7] L. Yu, P. C. Yuen, and J. Lai, “Ulcer detection in wireless capsule endoscopy images,” in Proceedings of the 21st International Conference on Pattern Recognition (ICPR2012), pp. 45–48, Nov 2012.
[8] B. Li and M. Q.-H. Meng, “Computer-based detection of bleeding and ulcer in wireless capsule endoscopy images by chromaticity moments,” Computers in Biology and Medicine, vol. 39, no. 2, pp. 141–147, 2009. [9] Y. Chen and J. Lee, “Ulcer detection in wireless capsule endoscopy video,” in Proceedings of the 20th ACM International Conference on Multimedia, MM ’12, (New York, NY, USA), pp. 1181–1184, ACM, 2012.
[10] W. Liu, D. Anguelov, D. Erhan, C. Szegedy, S. E. Reed, C. Fu, and A. C. Berg, “SSD: single shot multibox detector,” CoRR, vol. abs/1512.02325, 2015.
[11] A. Krizhevsky, I. Sutskever, and G. E. Hinton, “ImageNet Classification with Deep Convolutional Neural Networks,” in Advances in Neural In-formation Processing Systems 25(F. Pereira, C. J. C. Burges, L. Bottou, and K. Q. Weinberger, eds.), pp. 1097–1105, Curran Associates, Inc., 2012.
[12] V. I. Iglovikov, S. S. Seferbekov, A. V. Buslaev, and A. A. Shvets, “Ter-nausNetV2: Fully Convolutional Network for Instance Segmentation,” tech. rep.
[13] A. A. Shvets, V. I. Iglovikov, A. Rakhlin, and A. A. Kalinin, “An-giodysplasia detection and localization using deep convolutional neural networks,” in ICMLA, pp. 612–617, IEEE, 2018.
[14] R. J. Williams, “Simple statistical gradient-following algorithms for connectionist reinforcement learning,” Machine Learning, vol. 8, no. 3, pp. 229–256, 1992.
[15] K. Simonyan and A. Zisserman, “Very deep convolutional networks for large-scale image recognition,” CoRR, vol. abs/1409.1556, 2014. [16] J. Deng, W. Dong, R. Socher, L.-J. Li, K. Li, and L. Fei-Fei, “ImageNet:
A Large-Scale Hierarchical Image Database,” in CVPR09, 2009. [17] K. Cho, B. van Merrienboer, D. Bahdanau, and Y. Bengio, “On the
properties of neural machine translation: Encoder–decoder approaches,” in Proceedings of SSST-8, Eighth Workshop on Syntax, Semantics and Structure in Statistical Translation, pp. 103–111, Association for Computational Linguistics, 2014.
[18] X. Dray, C. Li, J.-C. Saurin, F. Cholet, G. Rahmi, J. Le Mouel, C. Le-andri, S. Lecleire, X. Amiot, J.-M. Delvaux, C. Duburque, R. G´erard, R. Leenhardt, F. Mesli, G. Vanbervliet, I. Nion-Larmurier, S. Sacher-Huvelin, C. S. Simon Chane, O. Romain, and A. Histace, “CAD-CAP: une base de donn´ees franc¸aise `a vocation internationale, pour le d´eveloppement et la validation d’outils de diagnostic assist´e par
ordinateur en vid´eocapsule endoscopique du grˆele,” in Actes des JFHOD 2018(Thieme, ed.), vol. 50 of Endoscopy, (Paris, France), p. 316, Mar. 2018.