HAL Id: hal-02403934
https://hal.archives-ouvertes.fr/hal-02403934
Submitted on 11 Dec 2019
HAL is a multi-disciplinary open access
archive for the deposit and dissemination of
sci-entific research documents, whether they are
pub-lished or not. The documents may come from
teaching and research institutions in France or
abroad, or from public or private research centers.
L’archive ouverte pluridisciplinaire HAL, est
destinée au dépôt et à la diffusion de documents
scientifiques de niveau recherche, publiés ou non,
émanant des établissements d’enseignement et de
recherche français ou étrangers, des laboratoires
publics ou privés.
centrosome-depleted brain multiciliated progenitors
Olivier Mercey, Adel Al Jord, Philippe Rostaing, Alexia Mahuzier, Aurélien
Fortoul, Amélie-Rose Boudjema, Marion Faucourt, Nathalie Spassky, Alice
Meunier
To cite this version:
Olivier Mercey, Adel Al Jord, Philippe Rostaing, Alexia Mahuzier, Aurélien Fortoul, et al.. Dynamics
of centriole amplification in centrosome-depleted brain multiciliated progenitors. Scientific Reports,
Nature Publishing Group, 2019, �10.1038/s41598-019-49416-2�. �hal-02403934�
Dynamics of centriole amplification
in centrosome-depleted brain
multiciliated progenitors
olivier Mercey
1,2,3, Adel Al Jord
4, Philippe Rostaing
1,2,3, Alexia Mahuzier
1,2,3,
Aurélien fortoul
1,2,3, Amélie-Rose Boudjema
1,2,3, Marion faucourt
1,2,3, Nathalie Spassky
1,2,3&
Alice Meunier
1,2,3Reproductive and respiratory organs, along with brain ventricles, are lined by multiciliated epithelial cells (MCC) that generate cilia-powered fluid flows. MCC hijack the centrosome duplication pathway to form hundreds of centrioles and nucleate motile cilia. In these cells, the large majority of procentrioles are formed associated with partially characterized organelles called deuterosomes. We recently challenged the paradigm that deuterosomes and procentrioles are formed de novo by providing data, in brain MCC, suggesting that they are nucleated from the pre-existing centrosomal younger centriole. However, the origin of deuterosomes and procentrioles is still under debate. Here, we further question centrosome importance for deuterosome and centriole amplification. First, we provide additional data confirming that centriole amplification occurs sequentially from the centrosomal region, and that the first procentriole-loaded deuterosomes are associated with the daughter centriole or in the centrosomal centriole vicinity. Then, to further test the requirement of the centrosome in deuterosome and centriole formation, we depleted centrosomal centrioles using a Plk4 inhibitor. We reveal unexpected limited consequences in deuterosome/centriole number in absence of centrosomal centrioles. Notably, in absence of the daughter centriole only, deuterosomes are not seen associated with the mother centriole. In absence of both centrosomal centrioles, procentrioles are still amplified sequentially and with no apparent structural defects. They seem to arise from a focal region, characterized by microtubule convergence and pericentriolar material (PCM) assembly. The relevance of deuterosome association with the daughter centriole as well as the role of the PCM in the focal and sequential genesis of centrioles in absence of centrosomal centrioles are discussed.
Multiciliated cells (MCC) grow up to several hundred of motile cilia to generate fluid flow necessary for proper respiratory, reproductive, and brain functions1. These cilia are nucleated by centriole-derived basal bodies docked
at the plasma membrane. Multiciliated precursors, containing only the two centrioles of their centrosome, must therefore amplify up to 300 centrioles to allow cilia nucleation. This amplification occurs thanks to intermediate organelles, the deuterosomes, which are composed of centriole-related elements2,3. Deuterosomes support
mas-sive centriole production by a molecular cascade that mimics the centrosome duplication program3–5. Because
two centrosomal centrioles seemed insufficient to scaffold the formation of tens of centrioles, massive centriole production through deuterosome structures was proposed to arise independently from the centrosome in MCC6.
Challenging this postulate, an electron microscopy study showing association of deuterosomes with centrosomal centrioles in chick trachea proposed that the “procentriole clusters may form initially in close association with the diplosomal centrioles”7. More recently, we highlighted an atypical asymmetry between the mother and daughter
centriole of the centrosome during cultured brain MCC differentiation, where deuterosomes are seen associated with the daughter centriole by electron microscopy8. Centriole amplification dynamics revealed by Cen2GFP live
imaging together with centriole duplication players (Cep152, Plk4, Sas6) and Deup1 accumulation at the daugh-ter centriole suggested that most procentrioles were amplified sequentially from the young centrosomal centriole
1Institut de Biologie de l’École Normale Supérieure (IBENS), Paris Sciences et Lettres (PSL) Research University,
Paris, F-75005, France. 2CNRS, UMR 8197, Paris, F-75005, France. 3INSERM, U1024, Paris, F-75005, France. 4Center
for Interdisciplinary Research in Biology (CIRB), Collège de France, CNRS 7241 INSERM U1050, PSL Research University, Paris, 75005, France. Correspondence and requests for materials should be addressed to O.M. (email:
[email protected]) or Alice Meunier (email: [email protected]) Received: 7 January 2019
Accepted: 2 August 2019 Published: xx xx xxxx
through deuterosome formation. It also suggested the existence of a local micro-environment conductive to the formation of these auxiliary centrosome structures8. In mouse tracheal epithelial cell cultures, the
transcrip-tion factor E2F4 was shown to accumulate in the centrosomal region during centriole amplificatranscrip-tion, and to be involved in deuterosome formation9. More recently, pericentriolar material proteins PCNT and γ-Tubulin were
shown to associate with the deuterosomes10. Here using new tools available to study centriole amplification in
MCC –a home-made Deup1 antibody and the Plk4 inhibitor centrinone- we further investigate the relationship between the centrosome organelle and the dynamics of centriole amplification by (i) characterizing the centro-some behavior during centriole amplification and (ii) assessing the dynamics of amplification in cells depleted from one or both centrosomal centrioles.
Results
Centriole amplification proceeds sequentially and begins from the centrosomal region.
We have recently shown that centriole amplification in mouse ependymal progenitor cells is marked by 3 phases8.The amplification A-phase, where procentrioles form on centrosome and deuterosome platforms, the growth G-phase, during which all procentrioles elongate and mature synchronously, and the disengagement D-phase, during which maturing centrioles are released from their growing platforms to dock at the apical plasma mem-brane, become basal bodies, and nucleate motile cilia. In order to precise early A-phase dynamics, we used our in vitro assay where the differentiation of mouse Centrin 2 GFP-tagged (Cen2GFP) ependymal cells allows the monitoring of centriole amplification dynamics (Fig. 1a,b, Supplementary Movie 1)8,11. We first focused on the
formation of immature procentrioles around deuterosomes (taking the form of Cen2GFP “halos”) during the A-phase and their subsequent maturation, visible by the transformation of Cen2GFP halos into “flowers” during the G-phase. We quantified that (i) the number of Cen2GFP halos increased over time in all the cells (Fig. 1a,c; grey), confirming, as previously stated8, that procentrioles are formed sequentially in the brain MCC
progeni-tor, and (ii) the maturation of procentrioles at the A- to G-phase transition was timely correlated with a stop in the generation of new Cen2GFP structures (Fig. 1a,c,d; orange), confirming that procentriole formation occurs exclusively during A-phase.
The accumulation of centriole duplication and deuterosome markers (Cep152, Plk4, Sas6, Deup1) at the daughter centriole, the observed association of deuterosomes to its proximal part by electron microscopy and the apparent formation of Cen2GFP structures from the centrosomal region by live imaging led us to conclude that amplification proceeds from the daughter centriole8 (Fig. 1a, Supplementary Movie 1). To complement these
pre-vious data that were majority based on Cen2-GFP live imaging and electron-microscopy, we used a homemade Deup1 antibody to further analyze deuterosome formation in the cells both in vitro and in vivo. We classified the cells depending on the number of deuterosomes they contain, using Deup1 and Sas6 immunostainings, assuming that early amplification would correspond to small number of deuterosomes. By measuring the distances between each Deup1/Sas6 positive deuterosome and the centrosome, we quantified that the first procentriole loaded deu-terosomes were observed within a radius of 1 µm from the centrosome both in vitro and in vivo (Fig. 1e,f). Then, the mean deuterosome-centrosome distance increased with the number of deuterosomes in the cell (Fig. 1e,f). Of note, Cen2GFP dynamics shows that the halos moving away from the centrosomal region can subsequently move back to it (Supplementary Movie 1), a behavior that could account for the large dispersion we observe in the centrosome-deuterosome distance (Fig. 1e,f). As previously described in vitro8, an asymmetric localization of
Deup1 to the daughter centriole was observed in vivo during A-phase (Fig. S4). Altogether, these additional data confirm the asymmetric association of deuterosomes with the daughter centriole and strengthen the previously proposed scenario8 where centriole clusters organized around deuterosomes are sequentially formed within the
centrosome prior to moving away in the cytoplasm.
Because two studies reported that Deup1 staining could be observed without procentriole markers12,13, we
also decided to investigate whether this phenotype of “unloaded deuterosomes” is a reproducible step of differ-entiation in brain MCC. By observing Deup1 and Sas6 co-stainings in cultured cells we found that only around 20% of Deup1 positive cells possessed Deup1 signal without Sas6 (Fig. 1g,i). Within these cells, some contained only unloaded deuterosomes (“Deup1+ SAS6−”) while others a mixed population of loaded and unloaded deu-terosomes (“Deup1+ SAS6+/−”). Because cells in culture can display abnormal features, we reproduced the experiments in vivo, in P2 mouse brain ventricles, and confirmed the in vitro results (Fig. 1h,i). The overlap-ping distribution of deuterosome number between Deup1+/SAS6− and Deup1+/SAS6+ populations (Fig. 1j) suggests that unloaded deuterosomes do not account for a systematic early stage of amplification as proposed recently13. In fact, the large majority of cells both in vitro and in vivo possess SAS6 loaded deuterosomes, even
when very few deuterosomes are present in the cell (Figs 1i,j and S4).
During the revision of this paper, a manuscript provided data suggesting that small-unloaded deuterosomes were appearing widely distributed in the cytoplasm before procentriole formation13. Given the small size of
the reported structures, we may have missed it because of different sensitivities of our antibodies. As we very rarely observe unloaded deuterosomes at the EM level using our serial sectioning protocol (8 and unpublished
observations), we think correlative light and electron microscopy would be necessary to distinguish bona fide electron dense deuterosomes from putative Deup1+/Cep152+ deuterosome precursors. In addition, increasing spatio-temporal resolution of deuterosome and centriole live imaging will be needed to clarify the very early events of deuterosome formation in relation to procentriole amplification.
Daughter-to-mother centriole conversion at the A- to G-phase transition.
We next characterized centrosome behavior during the amplification process. We first found that the daughter centriole Cep164 staining evolved. The daughter centriole did not stain for Cep164 at the beginning of A-phase (Fig. 2a). However, as the A-phase progressed and the number of deuterosome increased, the daughter centriole gradually stained positive for Cep164 to finally become indistinguishable from the mother centriole during the G-phase (Fig. 2a–c). ThisX X X X X A-Phase G-Phase t=0 t=4h t=6h40 t=9h20 a c g
halo=1 halos=5 halos=10 halos=14 fl owers=14
t=13h20
In vivo In vitro
Cen2GFP Deup1 Sas6 Merge
Deup1+
Sas6-Deup1+ Sas6+
Deup1+ Sas6
+
GT335 Deup1 Sas6 Merge
In vivo In vitr o Deup1+ Sas6 -j D-Phase MCC X X X X in vitro in vivo d e f i h b GT335 Cen2GFP A-Phase G-Phase t=16h40 Centrin Halos or Flower / Cel l
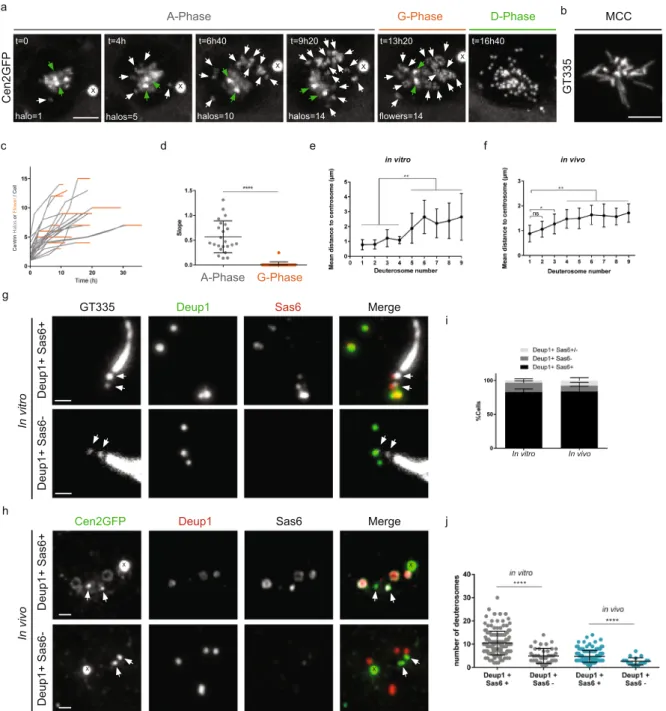
Figure 1. Centriole amplification proceeds sequentially and arises from the centrosomal region. (a) Time lapse
sequences of a Cen2GFP ependymal progenitor undergoing the different stages (A-Phase, G-Phase and D-Phase) of centriole amplification. Early A-Phase is characterized by Cen2GFP cloud surrounding centrosomal centrioles and the first visible halos in the nearby cytoplasm. As amplification progresses, the number of halos increases and they localize throughout the cytoplasm. In G-Phase, the final number of halos is reached, Cen2GFP halos transform into flowers where procentrioles are becoming visible. In D-Phase, procentrioles individualize. White arrows indicate centrin halos or flowers. Green arrows indicate centrosomal centrioles. (b) Cilia immunostaining with GT335 antibody of a Cen2GFP ependymal MCC at the end of a time lapse experiment. (c) Number of centrin halos (Gray) or flowers (Orange) during time lapse experiments in Cen2GFP ependymal progenitors (Δt = 40 min, n = 23 cells). Halos or flowers are sometimes masked because of their backward movements toward the centrosomal region. Consequently, they have been counted during expansion phases when each single structure is clearly visible by 3D monitoring. (d) Trend line slopes corresponding to each cell observed in
c in A-Phase and G-phase. (e,f) Mean distances of deuterosomes to the centrosome depending on the number
of deuterosomes in the cell in vitro (e, n = 67 cells), and in vivo (f, n = 134 cells). Deuterosomes were counted when positive for Deup1 and Sas6 stainings. (g,h) Immunostaining of cells in A-phase with loaded (Deup1+/ Sas6+) or unloaded (Deup1+/Sas6−) deuterosomes, in vitro (g), and in vivo (h). Arrows indicate centrosomal centrioles. (i) Quantification of cells with loaded (Deup1+/Sas6+), partially loaded (Deup1+/Sas6+/−) or unloaded deuterosomes (Deup1+/Sas6−) in vitro (n = 128 cells) and in vivo (n = 279 cells). (j) Quantification of the number of deuterosomes depending on the loading status of deuterosomes in vitro and in vivo (n = 196 cells in vitro, n = 165 cells in vivo). « X » indicates GFP aggregates. Scale bars: (a,b) 5 µm; (g,h) 1 µm.
Cen2GFP Cep164 Sas6 Merge A-Phas e G-Phas e Deup1 GT335 Sas6 Merge G-Phas e 1 cilium G-Phas e 2 cili a r= 0.5822 (p=0.0028**) a b c d e
Early A-Phase Late A-Phase G-Phase
f G-Phas e 2 cilia D-Phas e 0 cilium G-Phase A-Phase D-Phase D-Phase In vitr o In vivo MBB Cen2GFP GT335 Deup1 Merge
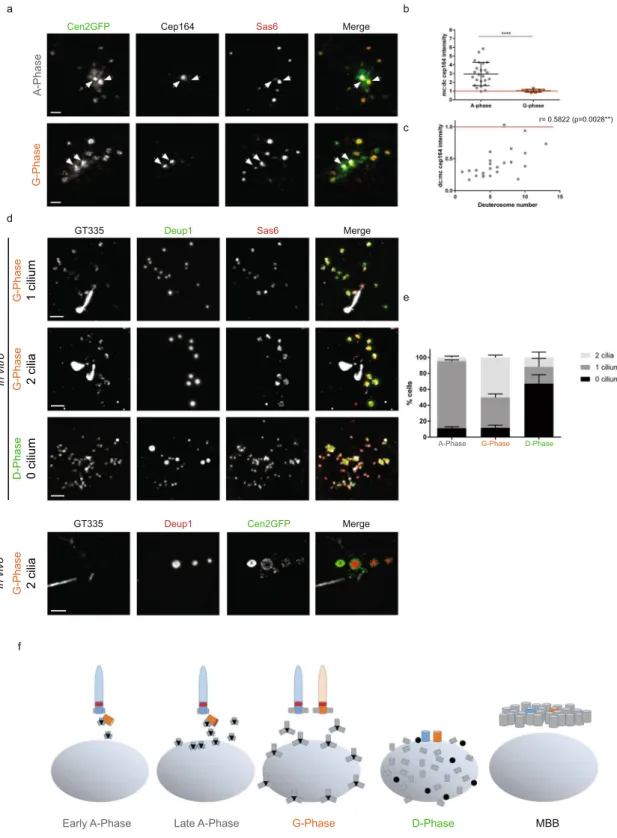
Figure 2. Daughter-to-mother centriole conversion at the A- to G-phase transition. (a) Cep164 and Sas6
immunostainings on Cen2GFP ependymal progenitors during A- and G-Phases. Arrows indicate centrosomal centrioles. (b) Mother:daughter centriole (mc:dc) Cep164 signal ratios in A-phase (n = 24 cells) and G-Phase (n = 7 cells). (c) Correlation between mc:dc Cep164 signal ratios and deuterosome numbers in the cells during A-Phase (n = 24 cells from b). (d) GT335, Deup1 and Sas6 immunostainings on ependymal progenitors during G- and D-Phases in vitro and G-phase in vivo. (e) Percentage of cells with 0, 1 or 2 GT335 positive cilia in A-, G- and D-phases in vitro (n = 210, 73 and 21 cells in A-, G- and D-phase, respectively). (f) Representative scheme of centrosomal centriole behaviour during centriole amplification. Nucleus is represented in gray, deuterosomes in black, procentrioles in gray, Cep164 in red, mother centriole in blue, daughter centriole in orange. « X » indicates Cen2GFP aggregate. Scale bars: 2 µm.
mc mc dc d d mc d d dc
GT335 Sas6 Deup1 MERGE
A-Phas e 2 cc d d a GT335 A-Phas e 0 cc 1 cc 2 cc b c d e D-Phase 2 cc 0 cc h A-Phase G-Phase i j d d d A-Phas e 1 cc 0 cc 1 cc f g 2cc 1cc c Cen2GF P
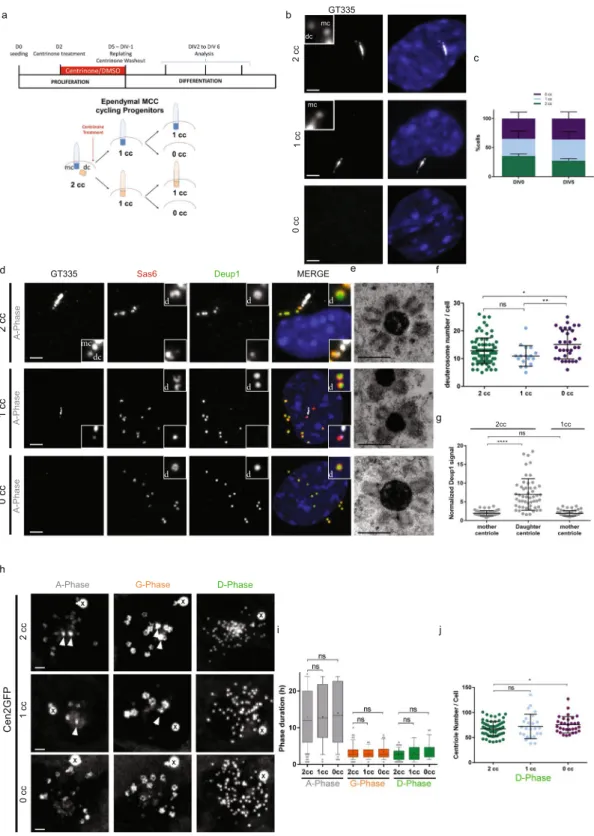
Figure 3. Depletion of centrosomal centrioles only slightly affects centriole amplification in brain MCC. (a)
Experimental procedure used to deplete centrosomal centrioles in MCC cycling progenitors using centrinone. See methods. 2cc, 1cc or 0cc for 2, 1 or 0 centrosomal centriole(s), respectively. (b) Representative pictures of 2cc, 1cc or 0cc ependymal progenitor cells stained with GT335. (c) Repartition of 2cc, 1cc or 0cc cell populations at two different days of differentiation (DIV for Day In Vitro). Cells selected for this quantification are ependymal progenitors that have not started centriole amplification (« centrosome » stage; n = 912 and 566 cells at DIV0 and DIV5 respectively). (d) Representative GT335, Deup1 and Sas6 immunostainings of 2cc, 1cc or 0cc cells during A-Phase. Zoom in pictures highlight deuterosomes « d » and centrosomal centrioles (mc: mother centriole and dc: daughter centriole). (e) Representative EM pictures of deuterosomes in 2cc, 1cc or 0cc cells. The status of the centrosome was identified by correlative light and electron microscopy. (f) Quantification of deuterosome number per cell in 2cc, 1cc or 0cc cells during G-Phase. 2cc cells have been taken from DMSO and centrinone-treated cultures (n = 80, 17, 33 cells for 2cc, 1cc and 0cc, respectively). (g) Normalized Deup1
daughter-to-mother centriole conversion was confirmed by the growth of a second primary cilium during the G-phase (Fig. 2d,e). Such bi-ciliated cells were also observed in vivo confirming that it is not an artifact of the culture system (Fig. 2d). These two cilia then depolymerize during the disengagement phase, consistent with the migration of the centrosome and deuterosomes to the nuclear membrane5, and centrosomal centrioles are
no longer distinguishable from mature disengaged procentrioles (Fig. 2d,e). Altogether, these data highlight a time-correlation between parental centriole modifications and centriole amplification progression (Fig. 2f).
Depletion of centrosomal centrioles only slightly affects centriole amplification in brain MCC.
Because present and previous data suggested that deuterosomes and procentrioles arose from the centrosome, and more particularly from the daughter centriole8, we took advantage of a new drug to remove centrosomal
centrioles. We used the small molecule inhibitor centrinone14, which inhibits Plk4 kinase activity, to deplete
cen-trosomal centrioles from cycling MCC progenitors (Fig. 3a). By treating primary progenitor cells with centrinone for 3 days during the proliferating phase, we obtained a mixed population of cells with 2 centrosomal centrioles (2cc), 1 centrosomal centriole (1cc) or 0 centrosomal centriole (0cc) (Fig. 3a,b). Although centrinone-treated proliferating progenitors reached confluence later when compared to control (not shown), they were able to pro-liferate confirming that mouse cells are less sensitive than human cells to centrosome-loss for cell division6,14–18.
This mixed population of progenitors was then washed out for centrinone and seeded at high confluence in serum free medium to trigger MCC differentiation. We obtained equivalent proportions of 2cc, 1cc and 0cc cells in differentiating cultures. These proportions did not vary between the first day of differentiation (Day In Vitro 0 or DIV0) and DIV5 suggesting that centriole-depleted cells are not significantly more prone to cell death (Fig. 3c). Using single-cell approaches, we first confirmed by correlative light and electron microscopy (CLEM) that Cen2GFP was suitable to assess the presence of centrosomal centrioles in the cells (Figs S1 and S2). Then, using immunostainings and CLEM, we sought to characterize centriole amplification in the 3 cell populations. Interestingly, parental centriole depletion did not block MCC progenitor capacity to form deuterosomes and pro-centrioles (Fig. 3d,e; Figs S1, S2 and S5). However, 0cc cells possessed slightly more deuterosomes than 1cc or 2cc cells (Fig. 3f). This is also observed in two recent studies published during the revision of the present paper, where authors treated cells with centrinone throughout proliferation and differentiation of ependymal and tracheal cell progenitors13,19. This suggests that centrosomal centrioles could tune deuterosome number. As previously shown8,
Deup1 accumulation was observed at the daughter centriole in 2cc cells. Removing the daughter centriole (1cc cells) did not change the incapacity of the mother centriole to accumulate Deup1 (Fig. 3g), confirming an asym-metry in the propensity of the mother versus daughter micro-environment for Deup1 concentration and putative deuterosome formation. Next, we scored the dynamics of amplification using single cell live imaging and found that the 3 populations achieved the stereotypical phases of centriole amplification (A-, G- and D-phases) with a similar spatiotemporal pattern (Fig. 3h,i). Consistent with the increase in deuterosome number, a slight increase in the number of centrioles was observed in 0cc cells as compared to 2cc cells (Fig. 3j). Altogether our data suggest that in multiciliated cells, as previously observed in cycling cells, resident centrioles are dispensable organelles for centriole biogenesis.
Centrosomal centriole-depleted cells form procentrioles within an acentriolar PCM cloud.
Finally, we focused on 0cc cells in order to decipher the precise dynamics of de novo centriole amplification. De novo centriole assembly has been induced in human cycling cells depleted from centrosomal centrioles using laser ablation20,21, centrinone treatment14 or an auxin-dependent Plk4 degradation system18. The supernumerary
cen-trioles were proposed to arise all at once during S-phase21 either from a PCM cloud20 or stochastically
through-out the cytosol18. Using live imaging on 0cc MCC progenitors, we observed that Cen2GFP halos assembled
sequentially, within a normal A-phase duration (Fig. 3i), at a similar rate when compared to 2cc cells (Fig. 4a,c,d, Supplementary Movie 2), and gave rise to basal bodies growing cilia (Fig. 4b). Because these centrioles were formed without a parental template, we decided to investigate their structure. To proceed, we set up a correla-tive live and electron microscopy (ClivEM) assay to analyze basal body ultrastructure in cells imaged from the A-phase, where the centrosome status can be assessed. No overt ultrastructural defects were observed in basal bodies formed in centrosome-depleted cells, suggesting that parental centrioles are not necessary to provide a structural template in MCC (Fig. 4e,f).
Since we proposed previously that the sequential formation of deuterosomes and associated procentrioles was due to their sequential generation from the daughter centriole8, we analyzed their origin in absence of centrosomal
signal (centrosomal centriole:cytoplasmic Deup1 signal) on mother and daughter centriole in 2cc cells, or on mother centriole in 1cc cells during A-Phase (n = 52 and 54 cells for 2cc and 1cc respectively). (h) Sequences from time lapse experiments on 2cc, 1cc or 0cc Cen2GFP cells. Note that a Cen2GFP cloud is still present in 0cc cells. (i) Box (25 to 75%) and whisker (10 to 90%) plots of A- (Gray), G- (Orange), and D- (Green) phase duration in 2cc, 1cc or 0cc Cen2GFP progenitors. Lines indicate medians, and crosses indicate means. 2cc cells have been taken from DMSO and centrinone-treated cultures (in A-Phase: n = 107 cells for 2cc; n = 36 cells for 1cc; n = 49 cells for 0cc; in G-Phase: n = 73 cells for 2cc; n = 32 cells for 1cc; n = 36 cells for 0cc; in D-Phase: n = 65 cells for 2cc; n = 25 cells for 1cc; n = 28 cells for 0cc). (j) Final centriole number counted during D-Phase in 2cc, 1cc or 0cc Cen2GFP progenitors. Because centrosomal centrioles are no longer distinguishable from maturing procentrioles in D-Phase, quantification is performed after Cen2GFP videomicroscopy to know the orignal centrosome status of the cells. 2cc cells have been taken from DMSO and centrinone-treated cultures (n = 69 cells for 2cc; n = 25 cells for 1cc; n = 31 cells for 0cc). Arrows indicate centrosomal centrioles. « X » indicates GFP aggregates. Scale bars: 2 µm for optical microscopy, 500 nm for EM.
t=0 t=6h t=12h40 t=22h
halos=1 halos=3 halos=5 halos=9
Cen2GFP Sas6 Pericentrin Merge
A-Phase G-Phase a c d g t=26h40 fl owers=9 2 cc 0 cc
Status 2 Cell Status 1 Cell Status 0 Cell
Centrin Halos or Flowe r / Cell
Cen2GFP Deup1 YL12 Merge
2 cc 0 cc D-Phase MCC i l 2cc 0cc 2 cc 0 cc Early A-Phas e Late A-Phas e Early A-Phas e h GT335 Cen2GFP b j k 2cc 0cc Norma l Abnorma l N= 124 (6 Cells) (5 Cells)159 e f t=28h40
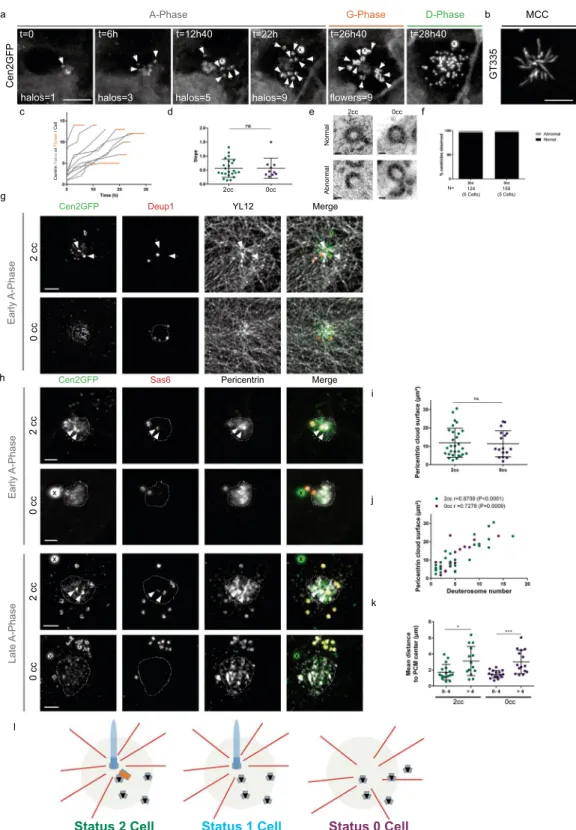
Figure 4. Centrosomal centriole-depleted cells form procentrioles within an acentriolar PCM cloud. (a)
Live imaging of a Cen2GFP ependymal progenitor depleted from centrosomal centrioles undergoing the different stages (A-, G- and D-Phase) of centriole amplification. (b) GT335 immunostaining of a 0cc Cen2GFP ependymal MCC at the end of the time lapse experiment. (c) Number of centrin halos (Gray) or flowers (Orange) during time lapse experiments in 0cc Cen2GFP ependymal progenitors (Δt = 40 min, n = 10 cells). Timepoints are chosen when halos or flowers number is clearly visible. (d) Comparison of centrin halo formation rate between 2cc or 0cc cells during A-Phase. Each dot represents the trendline slope corresponding to a cell observed during A-Phase in Fig. 1c (2cc cells) and (c) (0cc cells). (e) Representative pictures of normal and abnormal centrioles ultrastructure in 2cc or 0cc cells observed at the multiple basal body stage. See methods. (f) Quantification of the integrity of centrioles ultrastructure in 2cc (6 cells observed in differentiated control cultures) and 0cc cells (5 cells observed with CLEM after videomicroscopy; See Methods). (g) Immunostainings showing deuterosome localization (Deup1) and the tyrosinated tubulin network (YL12) in
centrioles. Parental centriole depletion by centrinone in human interphase cells has been shown to involve micro-tubule organization from the Golgi apparatus or from multiple cytoplasmic foci22,23. In MCC progenitors, the
existence of a focal Cen2GFP cloud, from where the first halos were seen arising (Fig. 4a, Supplementary Movie 2), suggested that a single acentriolar MTOC was self-organizing in the absence of resident centrioles. Consistently, the Cen2GFP cloud localized at the center of convergence of the microtubule network (Figs 4g and S3a) and colocalized with a single Pericentrin+ Cdk5Rap2+ cloud (Figs 4h and S3b,c). This acentriolar MTOC did not
appear connected to the Golgi apparatus (Fig. S3d). While the Pericentrin cloud surface was not modified by the status of the centrosome (Fig. 4i), its size correlated with the number of deuterosomes in both 0cc and 2cc cells (Fig. 4j). By measuring the mean distance of deuterosomes to the PCM cloud center, we revealed comparable results for 2cc and 0cc cells where the mean distance of deuterosomes to the PCM center increased with the num-ber of deuterosomes (Fig. 4k). Altogether, this suggests that, in the presence or absence of centrosomal centrioles, deuterosomes and their procentrioles arise sequentially from a focal region, characterized by microtubule con-vergence and PCM accumulation (Fig. 4l).
Discussion
In this study, we show that centrosomal centrioles are dispensable for deuterosome formation and centriole amplification in brain MCC. This is consistent with two other studies published during the revision of the pres-ent paper where the authors used either cpres-entrinone or shRNA to inhibit Plk4 function throughout the MCC differentiation program in brain or tracheal cells. Because live-imaging observations, immunocytochemistry quantifications, and EM data argued for an amplification from the daughter centriole8, we also assessed the
cen-triole amplification dynamics in centrosome depleted cells. Interestingly, we found that, even in the absence of centrosomal centrioles, the procentrioles clusters seem to appear sequentially from a focal region characterized by PCM accumulation.
Although parental centrioles were found to be dispensable, the data presented here further demonstrate in
vivo the asymmetry previously described in vitro between mother and daughter centrioles8. Deup1 structures
were found associated with the daughter centriole in 60% of A-phase cells in brain ventricles. Several hypotheses can be made to explain the “a priori” discrepancy between the observed association of deuterosomes with the daughter centrioles in control cells8, and the fact that deuterosomes and procentrioles can form in absence of
parental centrioles. First, similar to what was proposed in cycling cells, a pre-existing centriole, while dispensable, could be needed to provide a robust structural pattern24. Here we show that parental centriole-depleted cells form
centrioles with no overt ultrastructural defects therefore suggesting that parental structures are not needed for a correct patterning of new centrioles, at least in MCC. Second, as in cycling cells, centriolar walls may serve as preferential but dispensable sites facilitating the control of nucleation events. In line with this hypothesis, parental centriole depleted cells show a slight increase in the number of deuterosomes and centrioles produced. Third, only a subset of deuterosomes/procentrioles could be nucleated on the daughter centriole, while the others are formed within the PCM. This cannot be excluded because the spatio-temporal resolution of the live imaging does not allow resolving the site of formation of each single deuterosome/procentriole. Finally, one could also argue that deuterosomes are all generated in the PCM, and then only “associate” transiently with the daughter centriole. Such connection of deuterosomes with daughter centrioles could be involved in the loading of some procentrioles generated there. In line with this latter hypothesis, SAS6 asymmetry at the daughter centriole in vivo is systematic8
but Deup1 asymmetry is observed in only 60% of the cells.
Importantly, our centrinone assay demonstrates that even in absence of the daughter centriole (“1cc cells”), the mother centriole is unable to accumulate Deup1. Since the PCM seems to be the site for deuterosome and procen-triole assembly in the absence of centrosomal cenprocen-trioles, mother/daughter asymmetry may reflect the existence of sub-compartments within the PCM that would be more prone to deuterosome and/or procentriole nucleation events to occur. In this line, PCM proteins are associated with deuterosomes10 and increasing evidence suggests
that the centriolar matrix, and particularly Pericentrin, regulates centriole assembly, and not only the other way around. Overexpression of Pericentrin leads to overduplication of centrioles in human transformed cells25. More
recently, Pericentrin was shown to be involved in centriole biogenesis and stability in Drosophila26. The
increas-ing expression of Pericentrin durincreas-ing A-phase, visible by the increasincreas-ing surface of the Pericentrin cloud, may be involved in the sequential formation of procentrioles we observed, even in the absence of centrosomal centrioles. Depleting pericentrin and driving the daughter centriole away from the mother centriole27 may allow to test the
association of PCM with the daughter centriole and their respective contribution in MCC centriole amplification. In this study, we also highlighted an atypical centrosome behavior, correlated in space and time to the progres-sion of procentriole amplification in brain MCC. While procentriole clusters during A-phase seems to arise from the centrosomal region, the arrest in cluster formation is marked by procentriole growth at the A- to G- transition 2cc or 0cc cells during early A-Phase. In 2cc cells, microtubule network converges on one centrosomal centriole whereas in 0cc cells, it converges on Cen2GFP cloud. Dashed line delineates Cen2GFP cloud. (h) Representative pictures of Pericentrin and Sas6 immunostainings during early or late A-Phase in 2cc or 0cc cells. Dashed line delineates the Pericentrin cloud. (i) Surface of the Pericentrin cloud in 2cc and 0cc cells during A-phase (n = 29 cells for 2cc, n = 17 cells for 0cc). (j) Correlation between the Pericentrin cloud surface and the number of deuterosomes in the cell in 2cc (green) or 0cc (purple) cells (n = 29 cells for 2cc, n = 17 cells for 0cc). (k) Mean distance of deuterosomes to PCM center depending on the number of deuterosomes in the cells for 2cc and 0cc cells (for 2cc: 0–4 deuterosomes: n = 17 cells; >4 deuterosomes: n = 14 cells. for 0cc: 0–4 deuterosomes: n = 16 cells; >4 deuterosomes: n = 15). (l) Model for centriole amplification in 2cc, 1cc or 0cc cells. PCM cloud is represented in light green, deuterosomes in black, procentrioles in gray, microtubules in red. Arrows indicate centrosomal centrioles. « X » indicates GFP aggregates. Scale bars: (a,b) 5 µm: (e) 100 nm, (g,h) 2 µm.
and correlates with the maturation of the centrosomal daughter centriole. Concurrent maturation of the young centrosomal centriole and the procentrioles is also seen in cycling cells and was shown to be Plk1 dependent28.
Since Plk1 regulates the A- to G- transition in brain MCC progenitors5, it is tempting to speculate that it also
drives the concurrent maturation of the two generations of centrioles in these differentiating cells. Interestingly, such maturation of the daughter centriole is also observed in MCC induced from primary fibroblasts12. The
cau-sality relationships between daughter centriole maturation, procentriole growth and amplification arrest remains to be determined.
Methods
Animals.
All animal studies were performed in accordance with the guidelines of the European Community and French Ministry of Agriculture and were approved by the Direction départementale de la protection des populations de Paris (Approval number APAFIS#9343-201702211706561 v7). The mice used in this study have already been described and include: OF1 (Oncins France 1, Charles River Laboratories); Cen2GFP (CB6-Tg(CAG-EGFP/CETN2)3-4Jgg/J, The Jackson Laboratory). Videomicroscopy experiments were performed on cells from homozygous Cen2GFP mice. Other experiments were performed in parallel using OF1 or homozygous Cen2GFP mice; no differences between these two strains were observed regarding ependymal differentiation, amplification stages, centrosome asymmetry or number of deuterosomes and centrioles.Brain dissections.
Whole mounts of developing ventricular walls were prepared from P2-P4 adult mice as previously described11.Primary ependymal cell cultures and centrinone treatment.
Ependymal cell culture has been described previously8,11. Briefly, newborn mice (P0–P2) were killed by decapitation. The brains were dissected inHank’s solution (10% HBSS, 5% HEPES, 5% sodium bicarbonate, 1% penicillin/streptomycin (P/S) in pure water) and the extracted ventricular walls were cut manually into pieces, followed by enzymatic digestion (DMEM glu-tamax, 33% papain (Worthington 3126), 17% DNase at 10 mg ml−1, 42% cysteine at 12 mg ml−1) for 45 min at
37 °C in a humidified 5% CO2 incubator. Digestion was stopped by addition of a solution of trypsin inhibitors
(Leibovitz Medium L15, 10% ovomucoid at 1 mg ml−1, 2% DNase at 10 mg ml−1). The cells were then washed
in L15 and resuspended in DMEM glutamax supplemented with 10% fetal bovine serum (FBS) and 1% P/S in a Poly-l-lysine (PLL)-coated flask. Ependymal progenitors proliferated for 5 days until confluence followed by shaking (250 rpm) overnight. Pure confluent astroglial monolayers were replated at a density of 7 × 10⁴ cells
per cm2 (corresponding to days in vitro (DIV) −1) in DMEM glutamax, 10% FBS, 1% P/S on PLL-coated
cov-erslides for immunocytochemistry experiments, Lab-Tek chambered coverglasses (Thermo Fisher Scientific) for time-lapse experiments or glass-bottomed dishes with imprinted 50 µm relocation grids (Ibidi, catalogue no. 81148, Biovalley) for correlative Light/EM and maintained overnight. The medium was then replaced by serum-free DMEM glutamax 1% P/S, to trigger ependymal differentiation gradually in vitro (DIV 0). Centrinone was added on day2 of the proliferation (D2) phase at a final concentration of 0.6 µM. Centrinone was washed out 3 times with PBS on day 5 (D5) of the proliferation phase just before trypsinisation and replating at high conflu-ence for MCC differenciation.
Immunostainings.
Lateral brain ventricles were first pre-permeabilized in 0.2% Triton X-100 BRB medium (80 mM PIPES, 1 mM MgCl2, 1 mM EGTA) for 2 min before fixation. Brain or cell cultures (between DIV2 andDIV6) were fixed in methanol at −20 °C for 10 min. Samples were pre-blocked in 1 × PBS with 0.2% Triton X-100 and 10% FBS before incubation with primary and secondary antibodies. Tissues or cells were counterstained with DAPI (10 μg ml−1, Sigma) and mounted in Fluoromount (Southern Biotech). The following antibodies were used:
rabbit anti-Cep164 (1:750)29; rabbit anti-Deup1 (1:2000) (homemade, raised against the peptide TKLKQSRHI);
mouse IgG1 anti-GT335 (1:500, Adipogen); mouse IgG2b anti-Sas6 (1:750, Santa Cruz); rabbit anti-Pericentrin (1:2000, covance); rat anti-YL12 (1:500, abcam) and species-specific Alexa Fluor secondary antibodies (1:400, Invitrogen).
Microscopy.
Epifluorescence microscopy. Fixed cells and whole-mount ventricles were examined with an upright epifluorescence microscope (Zeiss Axio Observer.Z1) equipped with an Apochromat ×63 (NA 1.4) oil-immersion objective and a Zeiss Apotome with an H/D grid. Images were acquired using Zen with 240-nm z-steps.Confocal super-resolution microscopy. Confocal image stacks were collected with a 63 x/1.4 Oil objective on an inverted LSM 880 Airyscan Zeiss microscope with 440, 515, 560 and 633 laser lines.
Videomicroscopy. Videomicroscopy has been described previously8. Briefly, cultured cells between DIV2 and
DIV6 were filmed in vitro using an inverted spinning disk Nikon Ti PFS microscope equipped with oil-immersion ×63 (NA 1.32) and ×100 (NA 1.4) objectives, an Evolve EMCCD Camera (Photometrics), dpss laser (491 nm, 25% intensity, 70–100 ms exposition), appropriate filter sets for DAPI/FITC/TRITC, a motorized scanning deck and an incubation chamber (37 °C; 5% CO2; 80% humidity). Images were acquired with Metamorph Nx with
40 min time intervals. Image stacks were recorded with a z-step of 0.7 µm. After film acquisition, cells were then fixed for 5 min with 0.5% paraformaldehyde (PFA) using a Pasteur pipette without moving the chambered cover-glass, and GT335 primary and secondary antibodies were added together for 25 min, in medium supplemented with FBS (10%) before the final images were acquired.
Correlative light and electron microscopy (CLEM). CLEM on ependymal in vitro culture cells has been described elsewhere8. Primary Cen2GFP ependymal progenitors were grown in 0.17-mm thick glass dishes with imprinted
50 µm relocation grids (Ibidi). At 3–6 days in vitro (DIV 3–6), cells were fixed with 4% PFA for 10 min and epend-ymal progenitors undergoing A-phase or G-Phase were imaged for Cen2GFP and DAPI, in PBS, with upright epi-fluorescence microscope (Zeiss Axio Observer.Z1). Coordinates on the relocation grid of the cells of interest were recorded. Cells were then treated for transmission electron microscopy. Briefly, culture cells were treated with 1% OsO4, washed and progressively dehydrated. The samples were then incubated in 1% uranyl acetate in 70% methanol, before final dehydration, pre-impregnation with ethanol/epon (2/1, 1/1, 1/2) and impregnation with epon resin. After mounting in epon blocks for 48h at 60 °C to ensure polymerization, resin blocks were detached from the glass dish by several baths in liquid nitrogen. Using the grid pattern imprinted in the resin, 50 serial ultra-thin 70-nm sections of the squares of interest were cut on an ultramicrotome (Ultracut EM UC6, Leica) and transferred onto formvar-coated EM grids (0.4 × 2 mm slot). The central position of the square of interest and DAPI staining were used to relocate and image the cell of interest using a Philips Technai 12 transmission elec-tron microscope. Four different 0cc cells and two 1cc cells have been analyzed to verify our ability to determine centrosomal status from Cen2-GFP signal.
Centrioles ultrastructure was determined by Correlative Live and Electron Microscopy (CLivEM) after vid-eomicroscopy. Briefly, Cen2-GFP cells were plated in 0.17-mm thick glass dishes with imprinted 50 µm relocation grids (Ibidi). Cells with 2cc or 0cc undergoing centriole amplification were then filmed with an inverted spinning disk Nikon Ti PFS microscope until they reached multiple basal body stage and then proccessed for CLEM imag-ing such as described before8.
Quantification and statistics.
Rates of Cen2GFP structures appearance: we quantified the number of cen-trin halos or flowers at different times and computed the slopes given by a linear regression. Distance between deuterosomes and the centrosome: we measured the distance between the deuterosome center of mass and the middle of the segment drawn between the two centrosomal centrioles. The mean distance was then calculated within each single cell. Mean distance of deuterosomes to Pericentrin cloud center: a region of interest corre-sponding to the Pericentrin cloud was manually drawn and centroid coordinates were then used as the PCM center. The same protocol was used for Pericentrin cloud surface measurements. Centriole final number: it was always determined using the Cen2-GFP signal of D-Phase cells monitored by videomicroscopy from A-phase in order to identify the initial status of the centrosome. Because centriole number (D-phase) or deuterosome num-ber (G-Phase) of 2cc cells from DMSO and centrinone-treated cell were not significantly different, we decided to pool 2cc-DMSO and 2cc-centrinone data sets in the quantifications.Fluorescence signal intensities were quantified using Image J. All graphs and statistical analyses were obtained using GraphPad Prism software. Data were obtained from at least three independent experiments and the results presented as the mean ± s.d. Non-parametric two-tailed Mann–Whitney U-tests were used to compare groups of data. Pearson’s correlation coefficient was calculated to determine the strength of the relationship between two variables. For P-Values: ns: P > 0.05; *: P ≤ 0.05; **: P ≤ 0.01; ***: P ≤ 0.001; ****: P ≤ 0.0001.
A previous version of the manuscript has been uploaded on BioRxiv as a preprint and can be found under the following link: https://www.biorxiv.org/content/10.1101/503730v1.
Data Availability
All data generated or analyzed during this study are included in this published article (and its Supplementary Information files).
References
1. Spassky, N. & Meunier, A. The development and functions of multiciliated epithelia. Nat. Rev. Mol. Cell Biol. 18, 423–436 (2017). 2. Klos Dehring, D. A. et al. Deuterosome-Mediated Centriole Biogenesis. Dev. Cell 27, 103–12 (2013).
3. Zhao, H. et al. The Cep63 paralogue Deup1 enables massive de novo centriole biogenesis for vertebrate multiciliogenesis. Nat. Cell
Biol. 15, 1434–44 (2013).
4. Vladar, E. K. et al. Cyclin-dependent kinase control of motile ciliogenesis. Elife 7 (2018).
5. Al Jord, A. et al. Calibrated mitotic oscillator drives motile ciliogenesis. Science 358, 803–806 (2017).
6. Meunier, A. & Spassky, N. Centriole continuity: Out with the new, in with the old. Curr. Opin. Cell Biol. 38, 60–67 (2016). 7. Kalnins, V. I. & Porter, K. R. Centriole Replication During Ciliogenesis in the Chick Tracheal Epithelium. Z Zellforsch 30, 1–30
(1969).
8. Al Jord, A. et al. Centriole amplification by mother and daughter centrioles differs in multiciliated cells. Nature 516, 104–7 (2014). 9. Mori, M. et al. Cytoplasmic E2f4 forms organizing centres for initiation of centriole amplification during multiciliogenesis. Nat.
Commun. 8, https://doi.org/10.1038/ncomms15857 (2017).
10. Revinski, D. R. et al. CDC20B is required for deuterosome-mediated centriole production in multiciliated cells. Nat. Commun. 9 (2018).
11. Delgehyr, N. et al. Ependymal cell differentiation, from monociliated to multiciliated cells. Methods Cell Biol. 127, 87–127 (2015). 12. Kim, S., Ma, L., Shokhirev, M. N., Quigley, I. & Kintner, C. Multicilin and activated E2f4 induce multiciliated cell differentiation in
primary fibroblasts. Sci. Rep, 1–14, https://doi.org/10.1038/s41598-018-30791-1 (2018).
13. Zhao, H. et al. Parental centrioles are dispensable for deuterosome formation and function during basal body amplification. EMBO
Rep, e46735, https://doi.org/10.15252/embr.201846735 (2019).
14. Wong, Y. L. et al. Reversible centriole depletion with an inhibitor of Polo-like kinase 4. Science (80-.). 348, 1155–60 (2015). 15. Sir, J. H. et al. Loss of centrioles causes chromosomal instability in vertebrate somatic cells. J. Cell Biol. 203, 747–756 (2013). 16. Bazzi, H. & Anderson, K. V. Acentriolar mitosis activates a p53-dependent apoptosis pathway in the mouse embryo. Proc. Natl.
Acad. Sci. USA 111, E1491–500 (2014).
17. Insolera, R., Bazzi, H., Shao, W., Anderson, K. V. & Shi, S.-H. Cortical neurogenesis in the absence of centrioles. Nat. Neurosci. 17, 1528–1535 (2014).
18. Lambrus, B. G. et al. p53 protects against genome instability following centriole duplication failure. J. Cell Biol. 210, 63–77 (2015). 19. Nanjundappa, R. et al. Regulation of cilia abundance in multiciliated cells. Elife 8, 1–23 (2019).
20. Khodjakov, A. et al. De novo formation of centrosomes in vertebrate cells arrested during S phase. J. Cell Biol. 158, 1171–1181 (2002).
21. La Terra, S. et al. The de novo centriole assembly pathway in HeLa cells: Cell cycle progression and centriole assembly/maturation.
J. Cell Biol. 168, 713–722 (2005).
22. Gavilan, M. P. et al. The dual role of the centrosome in organizing the microtubule network in interphase. EMBO Rep, e45942 (2018).
23. Wu, J. et al. Molecular Pathway of Microtubule Organization at the Golgi Apparatus. Dev. Cell 39, 44–60 (2016).
24. Wang, W. et al. De novo centriole formation in human cells is error-prone and does not require SAS-6 self-assembly. Elife 6, 1–13 (2015).
25. Loncarek, J., Hergert, P., Magidson, V. & Khodjakov, A. Control of daughter centriole formation by the pericentriolar material. Nat.
Cell Biol. 10, 322–8 (2008).
26. Roque, H., Saurya, S., Pratt, M. B., Johnson, E. & Raff, J. W. Drosophila PLP assembles pericentriolar clouds that promote centriole stability, cohesion and MT nucleation. PLoS Genet. 14, 1–21 (2018).
27. Mazo, G., Soplop, N., Wang, W. J., Uryu, K. & Tsou, M. F. B. Spatial Control of Primary Ciliogenesis by Subdistal Appendages Alters Sensation-Associated Properties of Cilia. Dev. Cell 39, 424–437 (2016).
28. Kong, D. et al. Centriole maturation requires regulated Plk1 activity during two consecutive cell cycles. J. Cell Biol. 206, 855–865 (2014).
29. Graser, S. et al. Cep164, a novel centriole appendage protein required for primary cilium formation. J. Cell Biol. 179, 321–30 (2007).
Acknowledgements
We thank all members of the Spassky laboratory for comments and discussions. We thank K. Oegema and A.K. Shiau (Ludwig Institute for Cancer Research, La Jolla, CA) for sharing the centrinone, E.A. Nigg for the Cep164 antibody; A.-K. Konate and R. Nagalingum for administrative support; the IBENS Animal Facility for animal care. We thank the IBENS Imaging Facility, with grants from Région Ile-de-France (NERF 2011-45), Fondation pour la Recherche Médicale (FRM) (DGE 20111123023), and Fédération pour la Recherche sur le Cerveau–Rotary International France (2011). The IBENS Imaging Facility and the team received support from Agence Nationale de la Recherche (ANR) Investissements d’Avenir (ANR-10-LABX-54 MEMO LIFE, ANR-11-IDEX-0001-02 PSL* Research University). The laboratory is supported by INSERM, CNRS, École Normale Supérieure (ENS), ANR (ANRJC JC-15- CE13-0005-01), European Research Council (ERC Consolidator grant 647466), FRM (Equipe FRM20140329547), Cancéropôle Ile-de-France (2014-1-PL BIO-11-INSERM 12-1).
Author Contributions
O.M. designed the study, performed, analyzed experiments and wrote the manuscript; A.A.J. contributed to characterizing centrosome behavior during centriole amplification. P.R. contributed to correlative light and electron microscopy; N.S, A.Ma., A.F. and A-R.B. contributed to in vivo experiments; M.F. contributed to cell culture experiments; N.S. analyzed data, contributed to scientific discussions and edited the manuscript; A.M. initiated the study, supervised the project and wrote the manuscript.
Additional Information
Supplementary information accompanies this paper at https://doi.org/10.1038/s41598-019-49416-2.
Competing Interests: The authors declare no competing interests.
Publisher’s note: Springer Nature remains neutral with regard to jurisdictional claims in published maps and
institutional affiliations.
Open Access This article is licensed under a Creative Commons Attribution 4.0 International
License, which permits use, sharing, adaptation, distribution and reproduction in any medium or format, as long as you give appropriate credit to the original author(s) and the source, provide a link to the Cre-ative Commons license, and indicate if changes were made. The images or other third party material in this article are included in the article’s Creative Commons license, unless indicated otherwise in a credit line to the material. If material is not included in the article’s Creative Commons license and your intended use is not per-mitted by statutory regulation or exceeds the perper-mitted use, you will need to obtain permission directly from the copyright holder. To view a copy of this license, visit http://creativecommons.org/licenses/by/4.0/.