HAL Id: hal-01666050
https://hal.archives-ouvertes.fr/hal-01666050
Submitted on 18 Dec 2017
HAL is a multi-disciplinary open access
archive for the deposit and dissemination of
sci-entific research documents, whether they are
pub-lished or not. The documents may come from
teaching and research institutions in France or
abroad, or from public or private research centers.
L’archive ouverte pluridisciplinaire HAL, est
destinée au dépôt et à la diffusion de documents
scientifiques de niveau recherche, publiés ou non,
émanant des établissements d’enseignement et de
recherche français ou étrangers, des laboratoires
publics ou privés.
Broadband 2 W Output Power Tandem Thulium-doped
Single Clad Fibre Amplifier for Optical Transmission at
2µm
Robert Tench, Clément Romano, Jean-Marc Delavaux
To cite this version:
Robert Tench, Clément Romano, Jean-Marc Delavaux. Broadband 2 W Output Power Tandem
Thulium-doped Single Clad Fibre Amplifier for Optical Transmission at 2µm. ECOC 2017, Sep
2017, Gothenburg, Sweden. �hal-01666050�
Broadband 2 W Output Power Tandem Thulium-doped Single
Clad Fibre Amplifier for Optical Transmission at 2µm
Robert E. Tench(1), Clément Romano(2,3), and Jean-Marc Delavaux(1)
(1) Cybel LLC, 1195 Pennsylvania Avenue, Bethlehem, PA 18018 USA, [email protected] (2) Cybel LLC, 4715B Eisenhower Avenue, Alexandria, VA 22304 USA
(3) Institut Télécom/Télécom ParisTech, 46 Rue Barrault, 75634, Paris France
Abstract We report experimental and simulated performance of a tandem Tm-doped silica fibre
amplifier with a high signal output power of 2.6 W in the 2 µm band. Combined high dynamic range, high gain, low noise figure, and high OSNR are achieved with our design.
Introduction
The recent progress in transmission experiments at signal wavelengths in the 2 µm band1 shows
the need for Thulium-doped fibre amplifiers (TDFAs) with a combination of high gain, low noise figure, and large dynamic range. Previous work has demonstrated single stage amplifiers operating from 1900-2050 nm2,3 . In this paper we
report the experimental and simulated performance of a tandem single clad TDFA employing in-band pumping around 1560 nm and designed for the 1900-2050 nm signal band. A combination of high gain (>50 dB), output power of 2.6 W, >30 dB dynamic range, and <4 dB small signal noise figure are demonstrated with our design. Performance as a function of input power and signal wavelength is presented. The experimental data are in good agreement with steady-state simulations4 of our single clad
tandem TDFA performance.
Experimental Setup
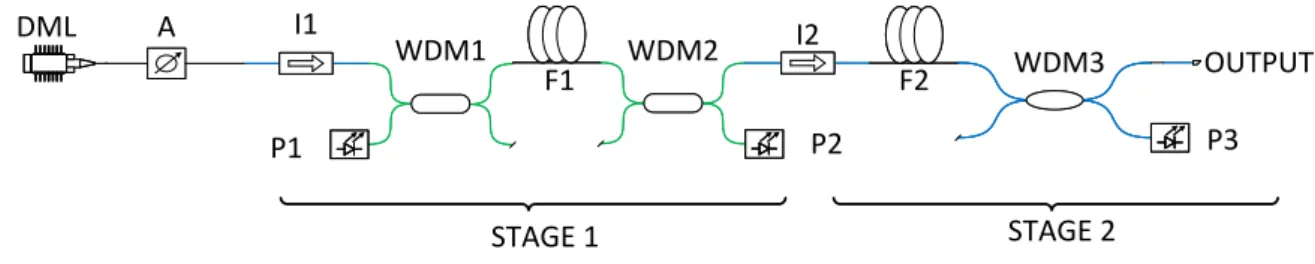
Figure 1 shows the setup for measurements of the tandem TDFA which consists of a preamplifier (Stage 1) and a power booster (Stage 2). Signal light from a single frequency discrete mode laser (DML) source (Eblana Photonics) is coupled into the first TDF F1 through attenuator A. In Stage 1, fibre F1 is co-and counter-pumped with 1550 nm grating
stabilized DFBs (P1 and P2) which deliver more than 200 mW each into F1. The signal output of F1 is then coupled into the second TDF fibre F2, in Stage 2, which is counter-pumped (P3) either by a multi-watt 1560 nm fibre laser or a multi-watt 1567 nm fibre laser. Optical isolators I1 and I2 suppress parasitic lasing and ensure unidirectional operation. Signal input power is set by varying attenuator A. In our experiments, F1 is a 7m length of OFS TDF designated TmDF200. Two types of fibre F2 are investigated, the first 5m of OFS TmDF200 and the second 4.4m of IXBlue TDF designated IXF-TDF-4-125.
Experimental Results and Simulations
Figure 2 shows the measured gain (G) and noise figure (NF) for the two amplifier configurations, first the OFS/OFS combination and then the OFS/IXBlue combination. In all of our data, which are displayed as points in the figures, input powers are referenced to the input of F1, and output powers are referenced to the output of F2. Maximum values of G of 54.6 dB and 55.8 dB, for OFS/OFS and OFS/IXBlue, respectively, were measured at a signal wavelength λs of 1952 nm
for fibre laser pump powers Pp at 1560 nm of 1.95
W. The corresponding NF was measured to be in the range of 4.0 to 5.1 dB for the OFS/IXBlue configuration, and 3.6 to 5.0 dB for the OFS/OFS
DML A I1 WDM1 P1 F1 WDM2 P2 I2 F2 WDM3 P3 OUTPUT STAGE 1 STAGE 2
Figure 1. Setup for measurements of the tandem TDFA. WDM = wavelength division multiplexer.
configuration, for input powers Pin between -30
dBm and +2 dBm.
Figure 2. G and NF as a function of Pin for the two tandem amplifiers at 1952 nm.
The data demonstrate a large dynamic range of over 32 dB for an NF of 5.1 dB or less. For lower fibre laser pump powers (Pp=0.2 W to 0.8 W at
1560 nm), NF values as low as 3.2 dB were measured for the OFS/OFS configuration. Simulations of these data were performed using fibre parameters measured in our laboratory5.
The simulation is based on a three level model of the Thulium ion in silica using the 3H6, 3F4, and 3H4 levels including ion-ion interactions4. The
parameters of gain coefficient, absorption coefficient, and 3F4 level lifetime were determined
for the OFS and IXBlue fibres under test. Other relevant parameters were taken from the literature. The set of three level differential population equations6 was solved using a stiff
solver, while the propagation set of differential equations was solved with a 4th order
Runge-Kutta method. The simulation accounts numerically for the amplified spontaneous emission (ASE) generated in the setup. Two stage simulation was carried out by sequentially applying the results of the single stage calculations.
As illustrated by the solid lines in Figure 2, the simulations agree well with the experimental data. Simulations of G are within 1.5 dB of the data for Pin > -25 dBm. Simulations of NF agree
with the data to within 2 dB. These results validate the accuracy of our simulations for both high gain and highly saturated operating regimes. Data illustrating the variation in output power Pout
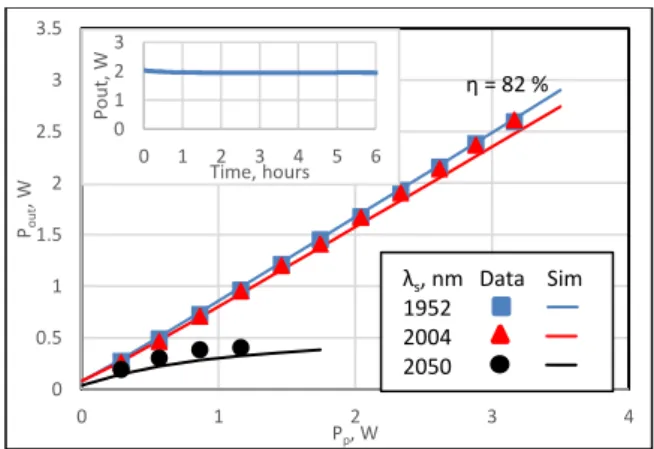
as a function of 1567 nm fibre laser pump power Pp are shown in Figure 3. For these data, Pin was
set to between +1.3 and +2.2 dBm to saturate the amplifier and Pp was varied from 0.3 W to 3.2 W.
For the OFS/OFS configuration, a maximum slope efficiency of 82% was observed at λs = 2004
and 1952 nm, corresponding to maximum output powers at these wavelengths of 2.60 W. A reduced output power of 0.4 W was achieved at
Figure 3. Saturated Pout vs. Pp for the OFS/OFS tandem amplifier. Points are experimental data and solid lines are
simulations.
2050 nm because of lower slope efficiency and the onset of lasing. The inset in Figure 3 illustrates the long term stability of Pout at 1952
nm and Pp = 2.43 W over a period of 6 hours. The
variation in Pout over this time period was less
than 4%. No fibre nonlinear behaviour such as Raman or Brillouin scattering was observed in our experiments.
Comparison of the data and simulations shows agreement to better than 0.5 dB for all experimental signal wavelengths as illustrated by the solid lines in Figure 3. These results validate the performance of our simulator as a function of signal wavelength.
Figure 4. Slope efficiency as a function of λs for the two tandem configurations.
Slope efficiency data as a function of λs for the
OFS/OFS and OFS/IXBlue setups are shown in Figure 4. Simulated slope efficiencies, given by the solid lines in Figure 4, agree well with the experimental data for all the measured signal wavelengths. The simulations indicate that high slope efficiencies of >70% can be expected from 1900 nm to 2020 nm. The simulations also show that the single clad fibre can deliver significant output power at 2050 nm with reduced efficiency. We attribute this behaviour to the presence of lower wavelength ASE and to reabsorption at lower wavelengths. 0 5 10 15 20 25 30 0 10 20 30 40 50 60 -35 -25 -15 -5 5 N F, d B G , d B Pin, dBm λs= 1952 nm Pp = 1.95 W 0 0.5 1 1.5 2 2.5 3 3.5 0 1 2 3 4 Pou t , W Pp, W λs, nm Data Sim 1952 2004 2050 η = 82 % 0 1 2 3 0 1 2 3 4 5 6 Po u t, W Time, hours 0 20 40 60 80 100 1900 1950 2000 2050 2100 Slop e E ff ici en cy , % Wavelength, nm
Fiber Data Sim OFS/OFS ● ̶ ̶ ̶ ̶
OFS/IXBlue ● ̶ ̶ ̶̶ ̶
Fiber Data Sim OFS/OFS ●
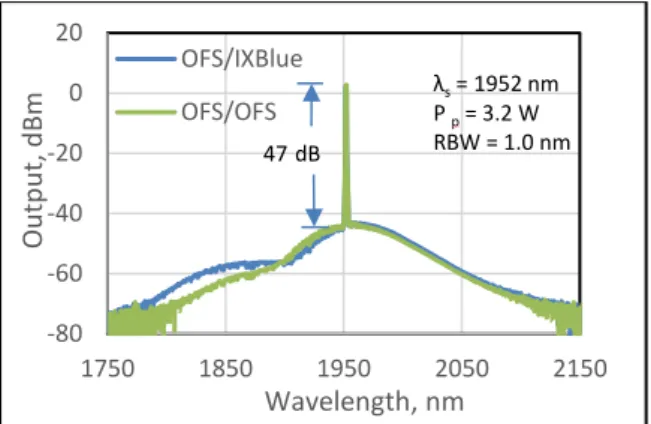
In Figure 5 we contrast experimental output spectra obtained for the two TDFA amplifiers, for saturated input signals of +2.1 dBm at 1952 nm and fibre laser pump power at 1567 nm of 3.2 W. These data are taken under the same conditions and yield optical signal to noise ratios (SNR) of 57 dB/0.1 nm for both configurations. The spectra observed for both setups exhibit differences in the wavelength region below 1950 nm. We attribute this to the different doping of the two fibres. Nevertheless, the operating wavelength regions and bandwidths for the OFS and IXBlue fibres are largely equivalent.
Figure 5. Saturated output spectra for the two tandem configurations.
Discussion
The high measured internal gain of >55 dB represents a significant improvement over results previously reported2,3 for single stage TDFAs.
Such a high small signal gain is promising for preamplifier, repeater, and in-line applications. The high observed slope efficiency of 82% and output power of 2.6 W also show significant improvement over previously reported performance2,3. The experimental SNR of 57
dB/0.1 nm for a saturated amplifier output is important for applications such as booster amplifiers.
The usable operating optical bandwidths of the tandem TDFAs, with the criterion of 10 dB down from the spontaneous emission peak (Figure 5), are estimated to be 122 nm for the OFS/OFS configuration and 130 nm for the OFS/IXBlue configuration. These values agree with previous work2,3 and are fully consistent with the simulated
slope efficiencies in Figure 4.
Our steady state simulations of tandem TDFA performance agree well with the experimental data, over a range of Pin from -30 dBm to +2 dBm,
for measurements of G, NF, and Pout. This
agreement covers the measured wavelength range of 1952-2050 nm. Future work will extend the studied wavelength range toward lower wavelengths. The good agreement between experiment and theory confirms that our
simulator is a useful tool for the design of tandem high gain, high power TDFAs.
Finally, we note that both the OFS and IXBlue configurations of the two stage TDFA exhibit similar performance, both experimentally and in simulation, confirming1-3 that we can employ
multiple commercial sources of Tm-doped fiber in our simulation and design of high performance tandem optical amplifiers.
Summary
We have reported the design and experimental performance of a tandem single clad TDFA, in-band pumped at around 1560 nm and operating in the 1900 – 2050 nm signal band. Small signal gains >55 dB, output powers as high as 2.6 W, and small signal noise figures as low as 3.2 dB were experimentally measured. Slope efficiencies as high as 82% were also observed, and an SNR of 57 dB/0.1 nm was demonstrated with output powers >2 W. Comparison of our data with steady state simulations yielded good agreement, thereby validating our model for high gain and high saturated output powers from the tandem two-stage TDFA over a wavelength range of 1952-2050 nm. Our design is appropriate for high transmit power, preamplifier, and repeater applications in the 2 µm region.
Acknowledgements
We are grateful to OFS and IXBlue for the Thulium-doped silica fibres, and to Eblana Photonics for the single frequency source lasers in the 2000 nm band.
References
[1] Z. Liu et al., “High-capacity Directly-Modulated Optical
Transmitter for 2-µm Spectral Region,” J. Lightwave Technology, Vol. 33, no. 7, pp. 1373-1379 (2015). [2] Z. Li et al., “Thulium-doped fiber amplifier for optical
communications at 2 µm,” Optics Express, Vol. 21, no. 8, pp. 9289-9297 (2013).
[3] Y. Jung et al., “Silica-Based Thulium Doped Fiber
Amplifiers for Wavelengths beyond the L-band,” in Proc. OFC 2016, Anaheim, Paper M3D.5 (2016)
[4] C. Romano, R. E. Tench, Y. Jaouen, and G. Williams, “Simulation and design of a multistage 10 W thulium-doped double clad silica fiber amplifier at 2050 nm,” in Proc. SPIE 10083, Fiber Lasers XIV: Technology and Systems, 100830H (February 22, 2017).
[5] C. Romano, R. E. Tench, J-M. Delavaux, and Y. Jaouen, “Characterization of the 3F4-3H6 Transition in Thulium-doped Silica Fibres and Simulation of a 2µm Single Clad Amplifier,” to be published at ECOC 2017.
[6] S. D. Jackson and T. A. King, “Theoretical modeling of Tm-doped silica fiber lasers,” J. Lightwave Tech. Vol. 17, No. 5, pp. 948-956 (1999). -80 -60 -40 -20 0 20 1750 1850 1950 2050 2150 Ou tp u t, d Bm Wavelength, nm OFS/IXBlue OFS/OFS λs= 1952 nm P p= 3.2 W RBW = 1.0 nm 47 dB