ISMRE2018/XXXX-2018 ALGERIA
Perturb and Observation MPPT algorithm for the
performance of Solar Photovoltaic System
1
stRessa.Noureddine , 2
ndMerabet Leila and 3
rdOmeiriAmar
1,2,3 Electrotechnical Engineering Department, Electrotechnical Laboratory, Badji Mokhtar University 23000 Annaba, P.O Box 12, Algeria
1st[email protected], 2nd [email protected], 3rd [email protected]
Abstract—The Maximum Power Point Tracking is a
technique used in power electronic circuit to improve the efficiency of photovoltaic systems . Several works and many papers have suggested different methods for extracting maximum power point. The aim of this work is to develop and realize the performance of the Photovoltaic system using Perturb and Observe algorithm. The first part of the work is devoted to the study of the components constituting the global photovoltaic system namely: the photovoltaic generator and the DC-DC converter. The PV generator is modelled by the mathematical equations and its current-voltage characteristics and the power-voltage characteristics are simulated taking in to account the temperature and sun's irradiance. The second part is detailed the MPPT method of Perturb and Observe using the DC-DC converters. The simulation results are designed in the MATLAB / SIMULINK environment where demonstrated the efficiency of the photovoltaic system when using Perturb and Observe MPPT algorithm.
Keywords—Photovoltaic system(SPV), Maximum Power Point Tracking(MPPT), DC-DC Boost Converter, Perturb & Observe(P&O), Incremental Conductance(Inc-Cond).
I. INTRODUCTION
The Photovoltaic system (SPV) is the most used to date and has become an identity of the most developed and prepared system for creating electricity, it is a permanent energy that does not produce harmful residues. As is well known, solar energy is converted into electrical energy, according to the conversion mechanism, i.e. by the photovoltaic generator (GPV). However, this energy produced is unstable during the day, because it is always changing according to very volatile weather conditions, including solar radiation and atmospheric temperature [1]. The V-P characteristic curve of the PV generator determines a point of operation in which the power is produced at the highest efficiency, called the MPP (maximum power point) [2, 3].
The maximum power point tracking (MPPT) is applied to bring the maximum power point from the PV module. Its implementation is also necessary for perfect efficiency and maximum output power.
Various types of MPPT algorithms have been developed to track the maximum power points and there are many literature reviews on this matter[4-7]. Examples of MPPT algorithms that were mentioned in these reviews include the Perturb and Observe (P&O), incremental conduction(Inc-cond), continuous voltage, and Constant Current [8]. There are also those based on artificial intelligence, i.e. intelligent algorithms such as the neural network (ANN) and fuzzy logic
(FL), and although they are quick to track (MPP), the disadvantage remains in their complex implementation [9].
Among these algorithms, Perturb and Observe algorithm (P&O) is extremely popular as it is one of the best known traditional methods and it is also the most widely used compared to the intelligent algorithms because of its ease of implementation and simplicity [10,11].
This research presents the design of the PV system in the MATLAB / Simulink environment, as well as study the work of an MPPT algorithm based on Perturb and Observe (P&O) algorithm method using a DC-DC Boost converter, and comparing its performance with the available energy of PV under test at different radiation and temperature levels.
II. PVSYSTEM MODELING
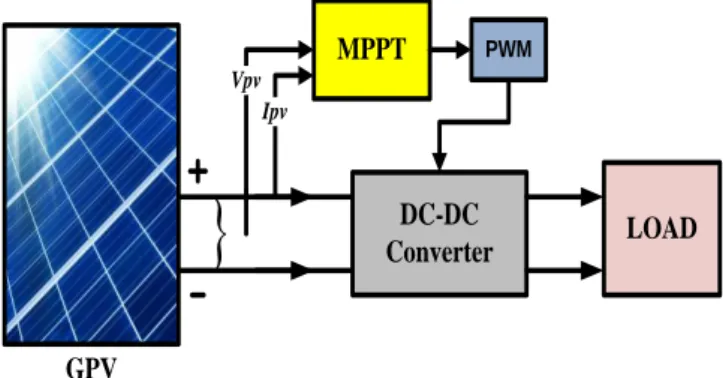
The PV system is a set of regularly installed equipment for the exploitation of solar energy under changes the atmospheric conditions (ambient temperature, sunshine). It consists of a PV generator connected to a load via a DC-DC Boost converter mediator controlled by MPPT controller, which follows straight the maximum power point (MPP) conformable to the maximum efficiency. Fig. 1 represents the synoptic structure of a photovoltaic energy production system.
MPPT DC-DC Converter GPV Ipv
Vpv LOAD PWMFig. 1. Synoptic structure of a photovoltaic energy production system.
A. PV Generator (GPV)
The PV generator is the fundamental element in a photovoltaic system which consists of several PV cells connected in series and parallel format to provide the desired output voltage and current.
The PV cell is the basic element of PV generator which converts solar irradiation into electrical energy. The most widely used model for its simplicity and accuracy is that of a diode, this is illustrated in Fig. 2[12].
A cell series resistance 𝑅𝑠 is attached in series with a parallel combination of cell photocurrent 𝐼𝑝ℎ, the exponential diode D, and shunt resistance 𝑅𝑠ℎ . 𝐼𝑝𝑣 , and 𝑉𝑝𝑣 are the PV cell’s current and voltage respectively.
Rs Rsh D G Iph Id Ish Ipv Vpv T
Fig. 2. Equivalent model of the PV cell.
The final expression of the characteristic is carried by following equation (1) [13]: 𝐼𝑝𝑣= 𝐼𝑝ℎ− 𝐼0[𝑒𝑥𝑝 ( 𝑞(𝑉𝑝𝑣+𝑅𝑠 𝐼𝑝𝑣) 𝑛 𝐾 𝑇 ) − 1] − 𝑉𝑝𝑣+𝑅𝑠𝐼𝑝𝑣 𝑅𝑠ℎ () With:
𝐼0 : is the inverse saturation current of the diode.
n : is the diode ideality factor (or completion factor). K : is the Boltzmann constant.
q : is the charge of the electron.
T: is the temperature of the cell (in kelvin).
PV generator is simulated after mathematical modelling following a set of equations (2,3,4 and 5) [14]:
𝐼𝑝𝑣= 𝑁𝑝𝐼𝑝ℎ− 𝑁𝑝𝐼0[𝑒𝑥𝑝 ( 𝑞(𝑉𝑝𝑣+𝑁𝑠𝑁𝑝𝑅𝑠 𝐼𝑝𝑣) 𝑁𝑠𝑛 𝐾 𝑇 ) − 1] − (𝑁𝑠 𝑁𝑝 𝑉𝑝𝑣+𝑅𝑠𝐼𝑝𝑣) 𝑅𝑠ℎ () With: 𝐼𝑝ℎ = [𝐼𝑠𝑐+ 𝑁𝑖𝐼0(𝑇 − 𝑇𝑟𝑘)] 𝐺 1000 () 𝐼𝑠= 𝐼𝑟𝑠( 𝑇 𝑇𝑟𝑘)³ [𝑒𝑥𝑝 ( 𝑞 𝐸𝑔(𝑇𝑟𝑘1 − 1𝑇) 𝐾 𝑇 )] () 𝐼𝑟𝑠= 𝐼𝑠𝑐 𝑒𝑥𝑝( 𝑞 𝑉𝑜𝑐 𝑁𝑠𝑛 𝐾 𝑇)−1 ()
The PV generator model is designed by MATLAB / Simulink software, shown in Fig. 3.
Matlab-Simulink tools were used to simulate the PV generator I-V and P-V curve under irradiance 1000W/m2 and temperature 25° C.
Fig. 3. PV generator Model in MATLAB/Simulink.
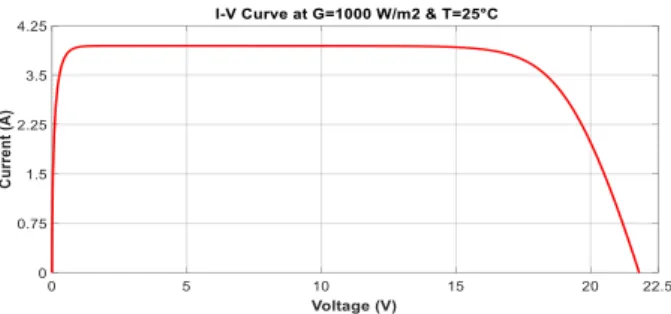
Fig. 4 and 5 gives the electrical characteristics I (V) and P (V) of a PV generator. These curves were plotted at constant solar irradiation level of 1000W/m² and a constant temperature of 25°C.
And as presented, the model data are in accordance with the experimental data both in the current and power curves as presented in Table 1.
Fig. 4. PV current-versus-voltage characteristic.
Fig. 5. PV Power-versus-voltage characteristic.
B. The influence of illumination and sunshine on the operation of the PV generator
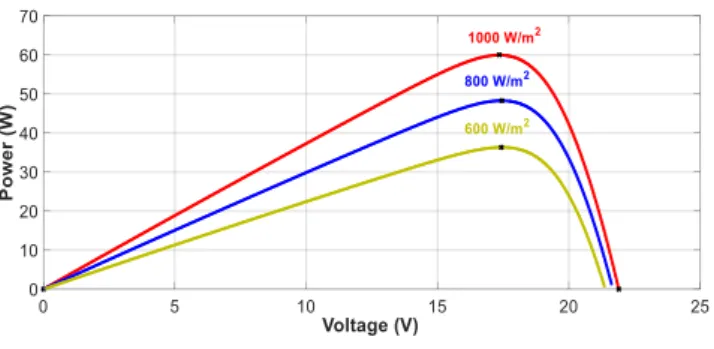
Simulation of PV generator was performed under different irradiation and operating temperatures conditions. The I-V & P-V curves planned through simulation are presented below in Fig. 6,7,8 and 9.
The V-I & P-V characteristics are plotted for different irradiation levels are as follows : 1000, 800 and 600 W/m2 and a constant temperature of 25°C, and they are also plotted for different temperatures are as follows:50, 35 and 25°C and a constant irradiation of 1000 W/m2.
The results show that the power increases with the increase in radiation level or with decreases in temperature and vice-versa.
The I (V) and P (V) curves has a maximum power point, this point is associated with both current and voltage(𝐼𝑚𝑝𝑝 and 𝑉𝑚𝑝𝑝).they are also not linear. The corresponding optimum voltage and current are MPPI and MPPV shown in Fig. 10.
Fig. 7. P-V curve for different solar irradiance.
Fig. 8. I-V curve for different solar temperature.
Fig. 9. P-V curve for different solar temperature.
Fig. 10. I-V and P-V characteristics under 25°C and 1000 watts/m².
TABLE I. ELECTRICAL PARAMETERS OF THE PV CELL
Parameters Of The Pv Cell
Maximum Power 60.03W
Voltage MPP 17.35V
Current MPP 3.46A
Open Circuit Voltage 21.3V Short Circuit Current 3.8A
C. DC-DC Boost converter
The method of adapting the PV generator to the load is very important to obtain maximum energy as well as high efficiency from the PV module. This is accomplished by used DC-DC power converters, and controlled by the MPPT controller. The control strategy which causes the voltage change simply lies in adjust the duty cycle appropriately.
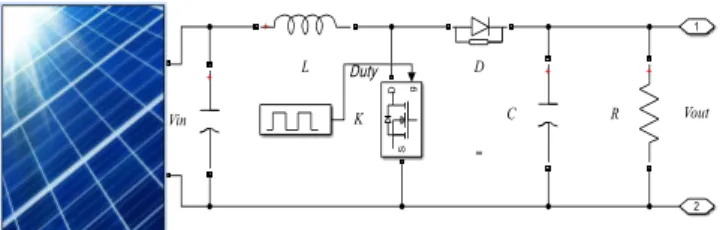
In this study, the DC-DC Boost converter was used, which increases the amount of input voltage to the desired output voltage. The boost converter topology is shown in Fig. 11.
The input and output voltages and currents of the boost converter can be written as [15]:
𝑉𝑜𝑢𝑡 𝑉𝑖𝑛 = 𝐼𝑖𝑛 𝐼𝑜𝑢𝑡= 1 (1−𝐷) () where :
𝑉𝑜𝑢𝑡 is the output voltage, 𝑉𝑖𝑛 is the input voltage and D is the duty cycle which is the ratio between the time within which the MOSFET.
GPV L D Cout
α
Vout R VinFig. 11. Topology of a DC-DC Boost converter.
1) Selection of inductor:
The value of the inductor is chosen on the basis of estimated inductor ripple current at the maximum input voltage, presented by equation (7) [16]:
𝐿 =
𝑉𝑜𝑢𝑡(𝑉𝑖𝑛−𝑉𝑜𝑢𝑡)𝛥𝐼𝐿∗𝑓𝑠∗𝑉𝑜𝑢𝑡 () Where 𝛥𝐼𝐿 is the estimated inductor ripple current. For continuous conduction mode the minimum inductance required is 𝐿𝑐 and calculated as:
𝐿
𝑐=
𝐷(1−𝐷) 2𝑅2∗𝑓𝑠
()
2) Selection of capacitor:
The capacitor value is calculated by the variation in output voltage or ripple given in equation (9) [17]:
𝐶 =
𝐷 𝑅∗𝑓𝑠∗𝛥𝑉𝑜𝑢𝑡𝑉𝑜𝑢𝑡
() Where 𝛥𝑉𝑜𝑢𝑡 is the desired output voltage ripple, for 1% voltage ripple corresponding to output voltage equation (10) becomes:
𝐶 =
𝐷𝑅∗𝑓𝑠∗0.01
()
This converter is modeled by MATLAB / Simulink, given in Fig. 12.Fig. 12. Modelling of a DC-DC Boost converter in MATLAB / Simulink.
D. MPPT Algorithm
The characteristics of a PV system vary with temperature and irradiation, (Fig. 7 and 9) [18]. So, the MPPT algorithm is also obliged to keep track of the new modified maximum power point in its corresponding curve whenever temperature and/or irradiation variation occurs.
As we said earlier, Many MPPT algorithms are introduced in a PV system to track the maximum power point (MPP) and produce the maximum available power from a PV generator. Perturb and Observe (P&O) method and Incremental conductance (IC) method are commonly used because of the ease of implementation and simplicity.
1) Perturb & Observe (P&O) Method :
The benefits of this algorithm, as recounted before, are simplicity and ease of implementation. However, P&O has defects that decrease its MPPT efficiency. One such defect is that as the amount of sunlight decreases, the P–V curve drop out, as observed in Fig. 7. This performs it hard for the MPPT to spot the place of the MPP, owing to the little change in power with respect to the perturbation of the voltage. The disadvantage of P&O is that it cannot decide when it has really reached the MPP. Instead, it oscillates throughout the MPP, changing the indication of the perturbation after all P measurement.
Therefore, the MPPT algorithm is modified and actuated in a PV system, where the proposed P & O algorithm has a quick response against mismatching conditions, quick convergence to MPP and high accuracy for real MPP handling.
• The proposed P&O algorithm does not use a 'Standby Time' to start a new searching.
Measures V(k),I(k) and calculate P(k)=V(k)*I(k) Start ΔP>0 V(k)-V(k-1)>0 V(k)-V(k-1)>0 D=D-ΔD D=D+ΔD V(k-1)=V(k) P(k-1)=P(k) Calculate ΔP=P(k)-P(k-1) ΔV=V(k)-V(k-1) Yes No No No Return Yes Yes ΔP=0
Fig. 13. Flowchart of the Perturb &observe algorithm.
The principle of this command is to generate perturbation by reducing or increasing the duty cycle D and to observe the
effect on the power delivered by the PV generator [19]. The algorithm of this command is presented in Fig. 13.
• If dpv / dVpv >0, the voltage is increased, this induces an increase in the duty cycle D (k) =D (k-1) +ΔD.ΔD being an accretion constant.
• If dpv / dVpv <0, the voltage is reduced, which means a decrease in the duty cycle D (k) =D (k-1)-ΔD.
2) Incremental Conductance method :
To pursue the maximum power at steady state condition the operating point of the system oscillate around the MPP under variation in the atmospheric condition in the perturb and observation technique, to defeat this drawback incremental conduction technique is used.
The principle of incremental conductance technique is based on the knowledge of the value of the incremental and instantaneous conductance to deduce the position of the operating point relative to the maximum power point, (MPP).This method is expressed by following equations (10,11 and 12) presented as:
𝑑𝑃 𝑑𝑉= 0 at MPP () 𝑑𝑃 𝑑𝑉> 0 at the left of MPP () 𝑑𝑃 𝑑𝑉< 0 at the right of MPP () 𝑑𝑃 𝑑𝑉= 𝑑(𝑉 ∗ 𝐼) 𝑑𝑉 = 𝐼 + 𝑉 𝑑𝐼 𝑑𝑉
The dP/dV is defined as a maximum factor for power point identifier. By using it, the IC method is suggested to effectively track the MPP of the PV generator [20]. The following equations (13,14 and 15) are viewed to track the MPP. 𝑑𝐼 𝑑𝑉= − 𝐼 𝑉 at MPP () 𝑑𝐼 𝑑𝑉> − 𝐼 𝑉 at the left of MPP () 𝑑𝐼 𝑑𝑉< − 𝐼 𝑉 at the right of MPP () The PWM control signal from the DC to DC power adapter is regulated by MPPT until the condition:(dI/dV) + (I/V) = 0 is convinced.The MPPT incremental conductance Flowchart is shown in Fig. 14.
Fig. 14. Flowchart of the Incremental Conductance algorithm.
Measures V(k),I(k) and V(k-1),I(k-1) Start dV=0 dI=0 dI/dV=-I/V dI/dV>-I/V dI>0 D=D+ΔD D=D-ΔD V(k-1)=V(k) I(k-1)=I(k) Yes Yes Calculate dV,dI Yes No No Yes Return No No No Yes
III. SIMULATION RESULTS
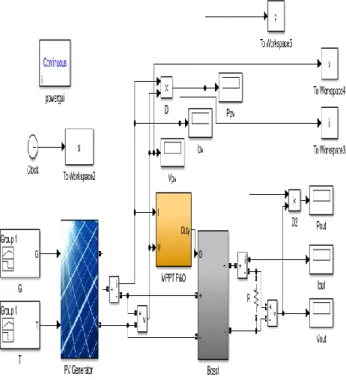
The (P&O) algorithm was simulated and performed with a DC-DC boost converter, as shown in Fig. 15.
The power of the PV generator with and without MPPT is also compared to see its performance.
The photovoltaic generator was simulated in Matlab / Simulink, under different irradiance and temperature. The I-V & P-V curves characteristics detected through simulation are shown below in Fig. 19 and 20.
Fig. 15. Simulation Model of PV system with MPPT algorithm.
A. Discussion of results
The simulation results show the photovoltaic output power at different irradiance levels, (1000 W/m², 800 W/m² and 600 W/ m²) under constant temperature of 25°C, as well as at different temperatures of 25°C, 35°C and 50°C under constant irradiation of 1000 W/m2 in Fig. 16 and 17.
The results show that the power increases with the increase in radiation level or with decreases in temperature and vice-versa.
The maximum possible power output was achieved by applying the MPPT algorithm in the same weather conditions, where there is close convergence with PV panel test parameters.
Simulation of PV system without (P&O) MPPT gives less power than PV panel test parameters which shows that the use of MPPT in PV system can be used for improving the efficacy and maximize the output power of solar PV system. given in Fig. 18.
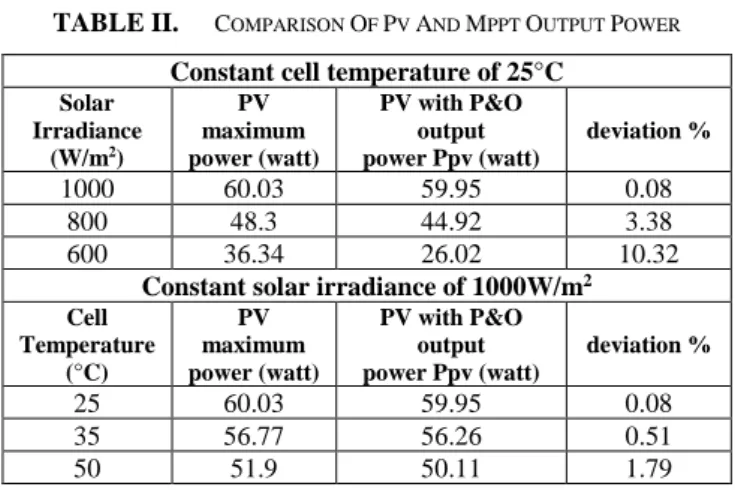
The simulation results show in all Fig. 16-20 , that the system performed satisfactorily as the maximum output power from solar PV panel with MPPT show a close relationship with the maximum power available from the PV under test at different irradiance levels. The percentage of photovoltaic power deviation from the ideal PV system is about 10.32% as disclosed in Table 2.
Fig. 16. PV output power at 25°C cell temperature.
Fig. 17. PV output power at 1000 W/m2 irradiance.
Fig. 18. PV output power with and without MPPT.
Fig. 20. P-V curve for different temperature.
TABLE II. COMPARISON OF PV AND MPPT OUTPUT POWER Constant cell temperature of 25°C
Solar Irradiance (W/m2) PV maximum power (watt) PV with P&O output power Ppv (watt) deviation % 1000 60.03 59.95 0.08 800 48.3 44.92 3.38 600 36.34 26.02 10.32
Constant solar irradiance of 1000W/m2
Cell Temperature (°C) PV maximum power (watt) PV with P&O output power Ppv (watt) deviation % 25 60.03 59.95 0.08 35 56.77 56.26 0.51 50 51.9 50.11 1.79 IV. CONCLUSIONS
Our study focused on one type of MPPT technique which is Perturb and Observe. This technology has also been used to maximize the output power of the PV system under different radiation and temperature. When the temperature is high or the radiation level is low, the photovoltaic output power decreases. The uses of MPPT in PV solar improve the efficacy of the PV system by maximizing the output power.
The simulation results show that the PV generator with the (P&O) MPPT algorithm has a better performance. It is able to operate the system effectively to maximize the output capacity to the maximum available power from the PV panel source at a very close point. For the tested operating conditions of the radiation and temperature, the percentage of the photovoltaic power deviation from the ideal GPV is about 10%.
REFERENCES
[1] F. Lasnier, T. G. Ang, "Photovoltaic Engineering Handboo", IOP Publishing Ltd, 1980, ISBN 0-85274-311-4.
[2] K. H. Hussein, I. Muta, T. Hoshino, and M. Osakada, "Maximum photovoltaic power tracking: an algorithm for rapidly changing
atmospheric conditions", IEE Proc. Generation, Transmission and Distribution, vol. 142, pp. 59-64, Jan. 1995.
[3] J.A. Jiang, T. H. Huang, Y.T. Hsiao and C.H. Chen, “Maximum Power Tracking for Photovoltaic Power Systems”, Tamkang Journal of Science and Engineering, vol. 8, no 2, 2005, pp. 147-153.
[4] Esram, T., Chapman, P.L., 2007. Comparison of photovoltaic array maximum power point tracking techniques. IEEE Trans. Energy Convers. 22, 439.
[5] Khare, A., Rangnekar, S., 2013. A review of particle swarm optimization and its applications in solar photovoltaic system. Appl. Soft Comput. 13, 2997–3006.
[6] Ishaque, K., Salam, Z., 2013. A review of maximum power point tracking techniques of PV system for uniform insolation and partial shading condition. Renew. Sustain. Energy Rev. 19, 475–488. [7] Rezk, H., Eltamaly, A.M., 2015. A comprehensive comparison of
different MPPT techniques for photovoltaic systems. Sol. Energy 112, 1–11.
[8] F. Qiang, T. Nan, "A complex-method-based PSO algorithm for the maximum power point tracking in photovoltaic system", Second International Conference on Information Technology and Computer Science (ITCS), 2010, pp. 134–137.
[9] A. S. Benyoucef, A. Chouder, K. Kara,S. Silvestrec,O. Ait sahed ''Artificial bee colony based algorithm for maximum power point tracking (MPPT) for PV systems operating under partial shaded conditions'' , Applied Soft Computing, vol 32 2015, pp. 38–48. [10] Wasynczuk O, Dynamic behavior of a class of photovoltaic power systems, IEEE Transactions on Power Applications System, 1983; 3031–3037.
[11] S. Motahhir, A. El Ghzizal, S. Sebti, and A. Derouich, “Proposal and implementation of a novel perturb and observe algorithm using embedded software,” Proc. 2015 IEEE Int. Renew. Sustain. Energy Conf. IRSEC 2015, no. December, 2016.
[12] Analysis of Effects of Sun`s Position in the Sky on Solar Radiation and Solar Panel Output Power authored by Moein Jazayeri, Sener Uysal,
Member, IEEE, and Kian Jazayeri published in IEEE
978-1-4673-5943-6/13/$31.00 ©2013 IEEE.
[13] S. Ndoye, I.Ly, F. Idrissa Barro, o. H. Lemrabott, G. Sissoko, "Modélisation et simulation sous matlab/simulink de la chaine d’alimentation d’une station relais de télécommunications en énergie solaire photovoltaïque dans une zone isolée du réseau électrique", journal des sciences, vol. 9, n° 2, 2009, pp. 45 – 55.
[14] Y. Jiang, J.A .Abu Qahouq, M. Orabi, "Matlab/Pspice hybrid simulation modeling of solar PV cell/module", Applied Power Electronics Conference and Exposition (APEC), Twenty-Sixth Annual IEEE, 2011, pp. 1244-1250, ISSN 1048-2334.
[15] N. Mohan and T. M. Undeland, Power Electronics: Converters, Applications, and Design, John Wiley & Sons, 2007.
[16] S. Maniktala, Switching Power Supplies A-Z, Elsevier, 2012. [17] S. Sivakumar, M. J. Sathik, P. S. Manoj, and G. Sundararajan, “An
assessment on performance of DC–DC converters for renewable energy applications,” Renewable and Sustainable Energy Reviews, vol. 58, pp. 1475–1485, 2016.
[18] R. Gottschalg, M. Rommel, D.G. Ineld and H. Ryssel, ‘Comparison of Different Methods for the Parameter Determination of the Solar Cell’s Double Exponential Equation’, In 14th European Photovoltaic Science and Engineering Conference (PVSEC), Barcelona, Spain, 1997. [19] Thanh Phu Nguyen, solar panel maximum power point tracker,
Undergraduate Thesis The University of Queensland Department of Computer Science & Electrical Engineering, 19 October 2001. [20] A. Safari and S. Mekhilef, "Simulation and Hardware implementation
of incremental conductance MPPT with direct control method using Cuk converter", IEEE Trans.Ind. Electron., vol . 58, no. 4, Apr. 2011, pp. 1154-1161.