HAL Id: hal-01591161
https://hal.archives-ouvertes.fr/hal-01591161
Submitted on 20 Sep 2017
HAL is a multi-disciplinary open access
archive for the deposit and dissemination of sci-entific research documents, whether they are pub-lished or not. The documents may come from teaching and research institutions in France or abroad, or from public or private research centers.
L’archive ouverte pluridisciplinaire HAL, est destinée au dépôt et à la diffusion de documents scientifiques de niveau recherche, publiés ou non, émanant des établissements d’enseignement et de recherche français ou étrangers, des laboratoires publics ou privés.
A Holistic Monitoring Service for Fog/Edge
Infrastructures: a Foresight Study
Mohamed Abderrahim, Meryem Ouzzif, Karine Guillouard, Jerome Francois,
Adrien Lebre
To cite this version:
Mohamed Abderrahim, Meryem Ouzzif, Karine Guillouard, Jerome Francois, Adrien Lebre. A Holistic Monitoring Service for Fog/Edge Infrastructures: a Foresight Study. The IEEE 5th International Con-ference on Future Internet of Things and Cloud (FiCloud 2017), Aug 2017, Prague, Czech Republic. pp.337-344, �10.1109/FiCloud.2017.30�. �hal-01591161�
A Holistic Monitoring Service for Fog/Edge Infrastructures: a Foresight Study
Mohamed Abderrahim, Meryem Ouzzif and Karine Guillouard
Orange Labs, France
Email: firstname.lastname@orange.com
Jérôme Francois and Adrien Lebre
Inria, France
Email:firstname.lastname@inria.fr
Abstract—
Although academic and industry experts are now ad-vocating for going from large-centralized Cloud Computing infrastructures to smaller ones massively distributed at the edge of the network, management systems to operate and use such infrastructures are still missing.
In this paper, we focus on the monitoring service which is a key element to any management system in charge of operating a distributed infrastructure. Several solutions have been proposed in the past for cluster, grid and cloud systems. However, none is well appropriate to the Fog/Edge context. Our goal in this study, is to pave the way towards a holistic monitoring service for a Fog/Edge infrastructure hosting next generation digital services. The contributions of our work are: (i) the problem statement, (ii) a classification and a qualitative analysis of major existing solutions, and (iii) a preliminary dis-cussion on the impact of the deployment strategy of functions composing the monitoring service.
1. Introduction
While the model of Cloud computing capabilities pro-vided by a few mega data centers still prevails, the advent of new usages related to Internet of Things applications (IoT) [1], as well as the emergence of new technologies such as Mobile Edge Computing (MEC) [2], Network Function Virtualization (NFV) [3] and Software Defined Network (SDN) [4] are today strongly challenging this model. As an example, the projection regarding the number of connected devices and applications that will consume Cloud services and generate massive amounts of data is a severe scalability challenge for the current model [5]. To cope with this usage change, Cloud and network communities are now advocating for going towards massively distributed small sized infrastructures that are deployed at the edge of the network, thus closer to end-users and their related devices, and applications [6]. Referred to as the Fog/Edge paradigm, this model is attracting growing interest as it also improves services agility. For instance, IoT applications can benefit from the deployment of edge nodes to perform real-time analysis while preserving central data centers for in-depth data analytics. Other applications include CDN (Content Distribution Networks) or even augmented reality [7].
The drivers of such a (r)evolution lay in the development of appropriate management systems that will enable, on the first hand, an operator to aggregate, supervise and expose such massively distributed resources and, on the other hand, to implement new kinds of services that may be deployed and managed by the operator itself or by third-party users. However, designing a well-suited management system is a challenging task because Fog/Edge infrastructures signifi-cantly differ from traditional Cloud ones regarding hetero-geneity, dynamicity and the potential massive distribution of resources and networking environments.
In this paper, we focus on the monitoring service that is a key element to management systems. These systems can be the operator’s ones but also those deployed by third-party users.
A few surveys on monitoring tools have been proposed over the last years [8], [9], [10]. However, to our best knowledge, none of them investigates the question from a Fog/Edge Computing perspective. This is the goal of this work.
The remainder of the article is as follows: Section 2 presents the target infrastructure specifics and the key prop-erties its monitoring service should satisfy. Section 3 dis-cusses the large analysis we conducted on existing monitor-ing services. It evaluates how our approach fits the Fog/Edge specifics. Section 4 gives some perspectives of this work. Finally, Section 5 concludes the article.
2. Monitoring Requirements for
Fog/Edge-based Operator Infrastructures
2.1. Target Infrastructure Specifics
According to the view point of a network operator, we propose to organize the envisioned infrastructure [11] around four levels of resources, as depicted in Figure 1. In the following, we refer to this platform as a Fog/Edge-based operator infrastructure. These four levels of resources are as follows:
• At the highest level, a few central (i.e., national or international) points of presence (PoPs) including data centers (DCs) infrastructures offer massive capacities in terms of computation, storage and network services. They may contain hundreds of high performance vir-tualized general-purpose servers and specific network
Figure 1. Fog/Edge-based operator infrastructure
physical nodes to connect servers within clusters or to external sites. Each node has capabilities in the range of 32 to 64 of 2 GHz-cores, 64 to 128 GB of memory and more than 1 TB of storage. It hosts either large scale IT services (e.g., billing service), core control and management network functions (e.g., Evolved Packet Core functions), application platforms (e.g., messaging applications) or a mix of them.
• At a lower level, tens of localized PoPs gather similar
servers to those of central PoPs in terms of perfor-mance. However, the number of servers in each PoP does not exceed fifty. Since such PoPs are closer to end-users (up to 200-km radius areas), they may host delay-sensitive services (e.g., user plane gateways) or services causing significant localized data traffic (e.g., Content Delivery Networks) in order to improve the user Quality of Experience (QoE). They are connected to central PoPs through highly resilient fiber links insuring latencies of a few hundreds of milliseconds.
• The access nodes (AN) level with a few thousands elements offers neither compute nor storage capacity. The role of the AN is limited to user connectivity only (e.g., optical, radio access point) as they are designed to be the most lightweight possible and therefore can be installed on sites rent by the infrastructure operator (e.g., public or private areas). Even the intelligent signal processing function traditionally hosted on the AN can be hosted on a higher level (such as localized PoPs) thanks to virtualization techniques and a high bandwidth of fiber over long distances.
• At the lowest level, the infrastructure operator may use computational and network resources from a few millions Edge Devices (ED) such as personal mobile devices and home gateways. These devices have limited capacity with CPU frequencies in the range of several GHz, memory of several GB and storage up to tens or hundreds GB. Moreover, this capacity is first dedicated to the ED owner needs; the usage of the remaining
resources is mainly opportunistic, the operator may have limited control over the resource availability and the ED connectivity establishment. The number of exploitable ED varies randomly. Such resources may be invoked for temporary or event uses. They are characterized by their volatility and a weak resilience in terms of both computing and networking capacities. The previous description shows that the Fog/Edge-based operator infrastructure is widely different from a traditional Cloud computing infrastructure. Three intrinsic characteris-tics complicate its management:
• Large and massively distributed. While a traditional
Cloud basically relies on high performance servers and networks placed on very few sites, a Fog/Edge-based operator infrastructure is deployed across a significant number of sites. The distance separating its resources can reach hundreds of kilometers at the highest level. To connect them, wired (e.g., copper or fiber) and wireless (e.g., microwave or wifi) links are used. Both the distance and the nature of the link affect the latency as well as the bandwidth between the resources.
• Heterogeneous. The infrastructure is composed of
sev-eral heterogeneous resources: storage servers, compute servers, specific routers, general-purpose switches, net-work links, home gateways, user devices, application platforms . . . . All those resources have different char-acteristics in terms of capacity (e.g., high performance servers vs. modest edge devices), reliability (dedicated to the infrastructure like routers in PoPs or provisional like an offered user terminal) and usage. Virtualiza-tion introduces another level of heterogeneity since the operated resources can be physical or virtual. This con-cerns storage or compute resources as well as network resources whose virtualization is possible thanks to NFV [3].
• Highly dynamic. Fog/Edge-based operator
infrastruc-ture resources may be highly dynamic. Particularly, jobs with short lifecycles are frequently instantiated and
migrated. This is also the case at the network level with the recent Software Defined Network capabilities [12] that enable the modification of network topology “on-the-fly”. Finally, it also occurs at the lowest level of the infrastructure where EDs may join and leave the network permanently according to service usage, failures, policies and maintenance operations.
2.2. Monitoring Fundaments
Today, infrastructure operators tend to automate as far as possible network and data center operations relying on management systems [13]. The complexity of the Fog/Edge-based operator infrastructure described in Section 2.1 in-creases the need for such a system. As depicted in Figure 2, a management system may belong to the infrastructure oper-ator itself, to an application hosted within the infrastructure or to an infrastructure tenant. The monitoring service is a key function to the management system. Furthermore, some management systems may implement a MAPE (Monitoring, Analyze, Planning, Execution) control loop which cannot be carried out without a monitoring function [14]. However, the monitoring function may be extracted from the MAPE control loop. It may be shared among various management systems leading to a more efficient use of the infrastructure. It may also appear as a standalone service and represent a commercial value like Amazon CloudWatch1, offered to the clients of Amazon Web Services.
Next, such a monitoring service has to be highly avail-able, as required by regulatory bodies [15]. For instance, a temporal failure of the monitoring service may affect management systems of time sensitive services or services requiring high resiliency such as VoLTE (Voice over LTE, a high-speed wireless communication for mobile phones). De-signing such a highly available monitoring service becomes more challenging due to the massive distribution, the large heterogeneity and the highly dynamic characteristic of the Fog/Edge-based operator infrastructure.
Figure 2. Monitoring service and functional decomposition
2.3. Monitoring Service Specification
A monitoring service fulfills different functions: obser-vationof the monitored resources, data processing and data exposition, as depicted in Figure 2. The processing function may be further detailed into sub-operations such as measure-ment aggregation (e.g., to adjust sampling), transformation
1. https://aws.amazon.com/cloudwatch/
of measurement into events, event processing and notifi-cation management. To deploy such a monitoring service on a Fog/Edge-based operator infrastructure with a high availability, we claim the monitoring service must satisfy the following properties:
• Scalability: The monitoring service should be able to supervise a large number of resources. Moreover, it should handle a sudden growth of load. That is, it should adapt to an increase of request rate from the different management systems and to an increase or a decrease of the monitored resources without any impact in terms of performance. The measurement sampling may also have an impact on processing and network capacity.
• Resilience to servers apparitions/removals: The mon-itoring service cannot prevent the failure of the re-sources hosting it. It should be designed to allow its adaptation to any resource removal. That is particularly important at the edge of the target infrastructure or in the context of virtualized environments where the resources are less reliable.
• Resilience to network changes/failures: The massively distributed Fog/Edge-based operator infrastructure is vulnerable to network failures particularly at the Edge Devices level. Moreover, the monitoring service heavily relies on the network to observe remote resources. For instance, it should ensure the retransmission of data lost in case of network failures.
One of the major challenges to meet all these properties is the possibility of decomposing the monitoring service and the possibility of distributing it geographically when needed. Thus, we identify two other properties:
• Modularity: The heterogeneous resources of the Fog/Edge-based operator infrastructure range from high performance servers to modest performance user termi-nals. To offer the monitoring service more choices of deployments, its deployment should be made possible on any type of these resources regardless of their capacities.
• Locality: The monitoring service should ensure ade-quate response delay regardless of the location of the monitored resources which is particularly challenging in the case of massively distributed infrastructures. It may be required to deploy the monitoring service nearest to its users, such as centralized management systems, as well as to the monitored resources that may be localized at the infrastructure edge level.
3. Qualitative Analysis of Monitoring Services
A huge number of monitoring services have been devel-oped to monitor IT and network infrastructures. Using an empirical approach to select the most appropriate monitoring solution appears as a quite tricky task due to the large heterogeneity, massive distribution and the highly dynamic characteristic of the monitored resources: numerous test scenarios should be conducted on each monitoring service
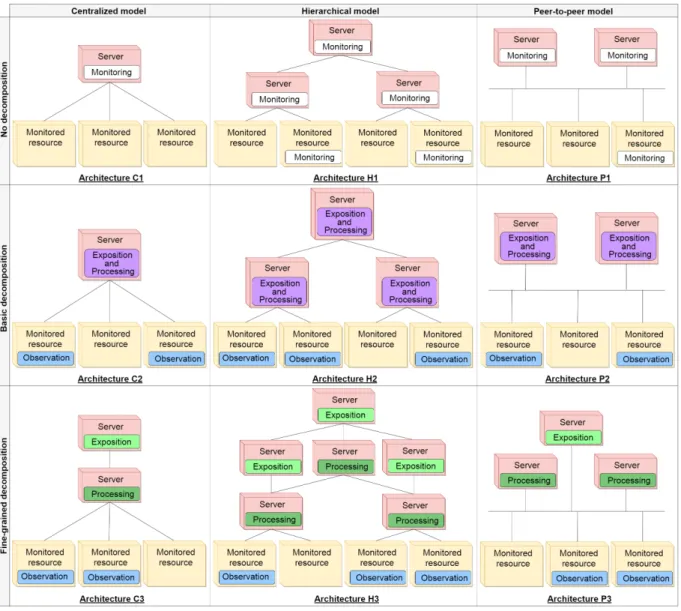
Figure 3. Monitoring Architectures Classification
Rows correspond to the decomposition granularity from no to fine-grained decomposition. Columns correspond to the software architecture model: centralized, hierarchical and peer-to-peer.
to cover all possible combinations of deployment models, metric natures, measurement load, failure occurrences, se-curity threats . . .
We opt here for a qualitative approach. We identify nine categories of monitoring architectures that differ from each other according to their functional decomposition (none, basic or fine-grained) and their architectural model (cen-tralized, hierarchical or peer-to-peer). Figure 3 presents the classification by illustrating each category. The following section discusses how each of them responds to the moni-toring service properties specified in Section 2.3.
3.1. Functional Decomposition
The monitoring service is implemented differently ac-cording to the functional decomposition.
3.1.1. No Decomposition. In this category, the monitoring function is performed entirely by a monolithic element. It collects monitoring data from proprietary probes through APIs, processes the observed measurements, and interfaces with its own users. For instance, virtual network func-tions usually embed ad-hoc probes and expose measurement through their APIs. Physical probes installed in a data center also expose environment parameters (temperature, humidity, energy consumption. . . ) through APIs. This model is really minimalist and simple to carry out. However, the modular-ity property is difficult to be attained, which is its main drawback: executing such a monolithic monitoring function requires significant execution resources. ED with restricted capabilities may not be able to host it and to perform intensive monitoring data processing tasks. Furthermore, in case of network failures, the monitoring service may not
retrieve an anterior state of the monitored resources. 3.1.2. Basic Decomposition. In this category, the obser-vation function is deployed on the monitored resource, separately from the other monitoring functions (process-ing and exposition). It enhances the resilience to network failures. When possible, deploying an agent on the mon-itored resource allows the monitoring service to adapt its behavior to the infrastructure. For instance, it may adapt the granularity of the reported measurements; it may also save measurements locally in case of network failures. Regarding modularity, this model remains insufficient.
3.1.3. Fine-grained Decomposition. In this last category, the functional decomposition is higher. Each of the mon-itoring functions may be deployed in separate servers or devices. This model improves the modularity. In addition, the risk of simultaneous failures of all the functions is re-duced. The resilience to both servers removals and network failures looks up.
3.2. Architectural Models
In this section, we discuss the centralized, hierarchical and peer-to-peer models under the Fog/Edge perspective. 3.2.1. Centralized Model. In this model, only one instance of each monitoring function is deployed except the obser-vation function for which different instances may be locally deployed on the resources (C2 and C3 cases).
This architectural model is quite intuitive. However, it limits the monitoring service scalability as it cannot benefit from additional resources to handle a peak of activity. Furthermore, latencies between the monitoring service, the resources to be monitored and the management systems may be significant. Therefore, the locality property may not be met easily.
3.2.2. Hierarchical Model. Unlike the centralized model, the hierarchical model deploys a sufficient number of in-stances of each monitoring function according to the size of the infrastructure and the management systems’ require-ments. Hence, the scalability is enhanced and latencies between instances are reduced. The constraint is that those instances should be hierarchically organized. A monitoring instance offers its service to another one at a higher level. The root instance has the most global view of the monitored infrastructure and, by consequence, is the most suited for interacting with management systems.
Consequently, the larger the infrastructure is, the more complex and costlier is to maintain a hierarchical structure. Each time a change occurs (either a server removal or a net-work disconnection), the tree organization has to be rebuilt. Moreover, the recovery may be time-consuming since it may consist of an election process. Furthermore, each hierarchy node may represent a single point of failure. In case of failure, its interconnected nodes become unreachable. The higher the level of the broken node is, the more significant
the failure impact is. Thus, even if the locality is improved, it is still insufficient to satisfy the highly dynamic nature of the target infrastructure.
3.2.3. Peer-to-peer Model. This last architecture model allows the replication of instances without imposing any specific structure organizing the relation between them. Any instance may be connected to another one if needed. By allowing multiple instances of a given function and commu-nication between instances, this architectural model holds the scalability property. In addition, it solves the expen-sive structural maintenance issue by removing hierarchical reliance between instances. As a result, this architectural model copes with the highly dynamic feature of the target infrastructure. Moreover, the resilience to server apparitions and removals is further increased.
3.3. Overview
Table 1 summarizes how each category satisfies the required properties. It shows that the functional decompo-sition is a key parameter in the satisfaction of the specified properties. C1, C2 and C3 are category examples having the same architectural model. However, only C2 and C3 are resilient to network changes/failures and only C3 en-ables the deployment of sub-functions on edge devices that have limited capabilities (i.e., modularity) and improves the resilience to server apparitions/removals. Similarly, the architectural model is decisive in the assessment of the architectures. For instance, the architectures C2, H2 and P2 have the same functional decomposition. However, H2 and P2 bring scalability and only P2 offers locality. Considering this logic, it is clear that the best architecture for a Fog/Edge-based operator infrastructure is P3. In fact, unlike the cen-tralized architectures, it has no constraint of single instance element. Thus, it satisfies the scalability and locality criteria. In addition, the adaptation of P3 in case of infrastructure changes is not shackled by the tree structure of hierarchical architectures. It offers the best level of resiliency to servers apparitions/removals. Finally, P3 enables a finer functional decomposition essential to the modularity property.
3.4. Classification of existing monitoring solutions
In this section, we present major solutions from the literature and classify them according to the nine categories as depicted in Table 1. For the sake of simplicity, we arbitrarily chose to discuss them following the functional decomposition axis.
3.4.1. No Decomposition. The C1 category is based on a single element hosted by a resource which must be con-nected to all the monitored resources. Many monitoring solutions were built based on this architecture. For instance, Collectd [16] is a general purpose monitoring solution which gathers measurements sent by the monitored resources and
pushes them later to an external system. Near Field Moni-toring [17] is intended to monitor Cloud computing infras-tructures. It pulls the API of the hypervisor to determine the state of the hosted VMs using introspection techniques. To monitor SDN infrastructures, OpenNetMon [18] and Pay-Less [19] rely on the monitoring feature of the OpenFlow protocol.
The H1 category is based on a hierarchical architecture such that the monolithic element can be deployed either on the server or on the monitored resources. ASTROLABE [20] was built based on this architecture. However, this solution seems to be deprecated.
The P1 category is composed of a monitoring element that can be hosted on a server or on a monitored resource. Any element can be connected to another one without con-straints. The monitoring solution which suits the most this architecture is MonALISA [21]. It is composed basically of autonomous agents called “MonALISA services” that can be deployed on the servers or on the monitored resources to observe, filter, aggregate and store the measurements, trigger actions or notify the administrator about events. To improve the performance of MonALISA, two types of other components are used: “Proxy service” and “Lookup service”. The "Proxy services" are used to access to the monitoring solution. They store the measurements locally to serve similar requests without increasing the load on the monitored resources. The “Lookup services” are registers where every element of MonALISA should identify to be discovered by the other MonALISA services.
3.4.2. Basic Decomposition. In the C2 category, there is a central server where the processing and the exposition functions are executed. It is connected to all the monitored resources where the element performing observation can be deployed. Nagios [22], one of the most deployed solutions to monitor enterprise infrastructure is designed according to this architecture. Its agents called “Nagios sensors” should be deployed in the resource to observe measurements. A centralized element called “Nagios core service” pulls them to collect, aggregate and store the observed measurements. This monitoring solution was not developed initially to monitor Cloud computing infrastructures. The monitoring solution IaaSMon [23] targeted the adaptation of Nagios to monitor IaaS infrastructure. It adds two specific agents to handle the dynamic characteristic of Cloud computing infrastructure. The first agent detects the modifications in the management plane (such as VM creations or migrations). The second one is adapted to VMs monitoring.
In the H2 category, the elements executing the monitor-ing function are hierarchically structured. The observation is hosted on the leaves and both the processing and the expo-sition are hosted on the nodes. Ganglia [24] is a monitoring solution which was designed based on this architecture. It relies on two agents Ganglia monitoring daemon (gmond) implementing the observation function and Ganglia meta daemon (gmetad) implementing the exposition function. The latter disposes of a data file where its data sources (gmonds or gmetads) are identified by their IP addresses.
This file can be seen as a local view of the global tree. Each
gmetadin the tree polls its data sources periodically to get the measurements. It aggregates them and exposes them to
gmetads in the higher level. It also stores the measurements as time series data in a Round Robin database where they are summarized to conserve a constant size.
In the P2 category, the observation is executed in the monitored resources while the processing and the exposition are executed in the hosting resources such that any instance can be connected to any other one without constraints. Hasselmeyer et al. [25] propose a solution following this model. The observation function is performed by agents that should be deployed on the monitored resource and the exposition function is performed by a "filtering and aggregation" engine. A data stream management system ensures communication between them. In particular, it may connect a "filtering and aggregation" engine to an other "filtering and aggregation" engine according to the peer-to-peer model. In addition to these elements, there are a "configuration system", a "data store" and a "configuration management" database. Unfortunately, the proof-of-concept they implemented does not allow duplication between the different instances.
3.4.3. Fine-grained Decomposition. In the C3 category, the elementary functions of processing and exposition are executed separately without being duplicated. They are con-nected to each other according to their functional depen-dency. Monasca [27] is designed according to this architec-ture to offer monitoring as a service in Cloud computing infrastructures. The communication between its processing functions is ensured by topics according to the publish/-subscribe paradigm. Its "Agents" elements execute the ob-servation function. They send the observed measurements to “API”. The latter publishes them in the topic "Metrics". "Transform" consumes the measurements from this topic to aggregate them and republish the aggregated measurements in the same topic. "Threshold" consumes the aggregated measurements from "Metrics" to check if an alarm should be triggered. If it is the case, it publishes a message in the "Alarm" topic. "Notification" is the element that executes the exposition function. It consumes messages from the "Alarm" topic to notify a user by sending an email or an SMS.
In the H3 category, we can identify two elementary structures. The first one is a tree that connects each func-tion to its duplicates according to the hierarchical model. The second one connects different functions to each other according to the functional dependency. To the best of our knowledge, there is no monitoring solution that implements this architecture.
In the P3 category, there is no constraint in the commu-nication between the functions and their duplicates. As in the case of H3, to the best of our knowledge, there is no monitoring solution implementing this architecture.
Monitoring services Architecture Satisfaction of the required properties Modularity Resilience to network
changes/failures
Resilience to servers
apparitions/removals Scalability Locality NFM [17], Collectd [16], Statsd [26], OpenNetMon [18], PayLess [19] C1 - - - - -Nagios [22], IaaSMon [23] C2 - + - - -Monasca [27] C3 + + - - -ASTROLABE [20] H1 - - - + + Ganglia [24] H2 - + - + + - H3 + + - ++ + MonALISA [21] P1 - - + + + Hasselmeyer et al. [25] P2 - + + + + - P3 + + ++ ++ +
TABLE 1. EVALUATION OF THE MONITORING ARCHITECTURES AND THE MONITORING SERVICES
4. Future Work
According to our analysis the monitoring solution should enable a P3 architecture. In other words, it should enable a fine-grained functional composition and a peer-to-peer archi-tectural model. Unfortunately, there is no exiting monitoring solution that satisfies both constraints. We have the possi-bility to redesign a system from scratch or to revise one of the available solutions, mitigating this way the engineering effort. Based on our study, we noticed that MonALISA sat-isfies the peer-to-peer communication model constraint and Monasca satisfies the fine-grained functional composition constraint. Considering the large developer community of OpenStack, we believe that it is wiser to study how Monasca can be revised to satisfy all Fog/Edge requirements.
However, revising Monasca in a peer-to-peer fashion should be done carefully since it will increase significantly the variety of deployment possibilities. This raises a new question related to the deployment strategy. Indeed, each deployment will lead to different performance as well as high availability levels. As it has been underlined, each hosting resource has different capabilities that determine the performance of the hosted element. Moreover, the links connecting the hosting resources induce different laten-cies/bandwidths/reliability. The deployment should then rely on those having the best properties. Similarly, the deploy-ment strategy should take into account the network flows. That is all on-going network exchanges that enable sharing information between distant elements. For example, if an aggregation of metrics is required between two PoPs, the deployment strategy should find the best way to mitigate communications with any other regional PoPs. This is crit-ical to reduce the network overhead of the monitoring ser-vice. Since network flows appear/disappear and the load on each function can fluctuate according to applications’ needs, it is obvious that the deployment of the different functions composing the monitoring service should be dynamic. That is the deployment strategy problem can be considered as a general reconfiguration challenge where an engine is in charge of finding the best trade-off between all aforemen-tioned goals and reconfiguring “on-the-fly” the system.
As future work, we are going to formulate the problem of the deployment strategy of the monitoring service in the Fog/Edge-based operator infrastructure leveraging the
Monasca solution and its sub-components. Our starting point will be the requirements of a set of representative services. These requirements (e.g., the resources that should be monitored, the frequency of measurement, the maximal time allowed to receive notifications . . . ) will be refined into resource needs, i.e., compute, memory, storage and network (latency, jitter and bandwidth). To guide us, we will perform in-vivo experiments on top of the test bed Grid’5000 [28]. By evaluating representative scenarios using the ENOS [29] framework, we will get accurate estimates of services’ requirements. These requirements as well as the performance offered by the infrastructure will be the inputs of a heuristic to output the optimal deployment.
5. Conclusion
Similarly to the key services that have been proposed in the past for Cloud computing and that led to its success, our community should propose building blocks for Fog/Edge infrastructures. Those building blocks are mandatory (i) to allow operators to supervise these massively distributed heterogeneous and highly dynamic platforms and, (ii) to favor the development of new kinds of geo-aware services. In this article, we discussed a foresight study of the monitoring service. We claimed it is an essential service for a Fog/Edge-based operator infrastructure. In addition to being used by other services of the system in charge of the resources supervision, it may be also used by opera-tors’ and third-party users’ services. After describing the platform we considered and specifying key properties of a Fog/Edge monitoring service, we analyzed major solutions from the literature. This analysis enabled us to establish a classification of the different monitoring architectures that can be envisioned. We identified that relying on the peer-to-peer architectural model as well as decomposing the monitoring service are two important aspects because they provide greater flexibility in the deployment possibilities. Finally, we highlighted that the deployment strategy is also an important challenge to deliver a highly-efficient and highly-available monitoring service. Since a Fog/Edge-based operator infrastructure is massively distributed and highly-dynamic, it is critical to reconfigure the system in order to satisfy applications’ needs while mitigating the monitoring service overhead.
Future work will focus on the deployment strategy ac-cording to the capabilities offered by the resources as well as the requirements of the different services.
References
[1] L. Atzori, A. Iera, and G. Morabito, “The internet of things: A survey,” Computer networks, vol. 54, no. 15, pp. 2787–2805, 2010. [2] A. Ahmed and E. Ahmed, “A survey on mobile edge computing,”
in 2016 10th International Conference on Intelligent Systems and Control (ISCO), Jan 2016, pp. 1–8.
[3] R. Mijumbi, J. Serrat, J.-L. Gorricho, N. Bouten, F. De Turck, and R. Boutaba, “Network function virtualization: State-of-the-art and research challenges,” IEEE Communications Surveys & Tutorials, vol. 18, no. 1, pp. 236–262, 2015.
[4] D. Kreutz, F. Ramos, P. Esteves Verissimo, C. Esteve Rothenberg, S. Azodolmolky, and S. Uhlig, “Software-defined networking: A comprehensive survey,” Proceedings of the IEEE, vol. 103, no. 1, pp. 14–76, Jan. 2015.
[5] B. Zhang, N. Mor, J. Kolb, D. S. Chan, K. Lutz, E. Allman, J. Wawrzynek, E. Lee, and J. Kubiatowicz, “The cloud is not enough: Saving iot from the cloud,” in 7th USENIX Workshop on Hot Topics in Cloud Computing (HotCloud 15), 2015.
[6] F. Bonomi, R. Milito, J. Zhu, and S. Addepalli, “Fog computing and its role in the internet of things,” in Proceedings of the first edition of the MCC workshop on Mobile cloud computing. ACM, 2012, pp. 13–16.
[7] S. Yi, C. Li, and Q. Li, “A survey of fog computing: Concepts, applications and issues,” in Proceedings of the Workshop on Mobile Big Data, ser. Mobidata ’15. ACM, 2015.
[8] G. Aceto, A. Botta, W. De Donato, and A. Pescapè, “Cloud monitor-ing: A survey,” Computer Networks, vol. 57, no. 9, pp. 2093–2115, 2013.
[9] K. Fatema, V. C. Emeakaroha, P. D. Healy, J. P. Morrison, and T. Lynn, “A survey of cloud monitoring tools: Taxonomy, capabil-ities and objectives,” Journal of Parallel and Distributed Computing, vol. 74, no. 10, pp. 2918–2933, 2014.
[10] G. Da Cunha Rodrigues, R. N. Calheiros, V. T. Guimaraes, G. L. d. Santos, M. B. de Carvalho, L. Z. Granville, L. M. R. Tarouco, and R. Buyya, “Monitoring of cloud computing environments: concepts, solutions, trends, and future directions,” in Proceedings of the 31st Annual ACM Symposium on Applied Computing. ACM, 2016, pp. 378–383.
[11] B. Confais, A. Lèbre, and B. Parrein, “Performance Analysis of Object Store Systems in a Fog/Edge Computing Infrastructures,” in CloudCom, Luxembourg, Luxembourg, Dec. 2016.
[12] H. Kim and N. Feamster, “Improving network management with soft-ware defined networking,” IEEE Communications Magazine, vol. 51, no. 2, pp. 114–119, 2013.
[13] K. Herrmann, G. Muhl, and K. Geihs, “Self management: the solution to complexity or just another problem?” IEEE distributed systems online, vol. 6, no. 1, 2005.
[14] A. Computing, “An architectural blueprint for autonomic computing,” IBM Publication, 2003.
[15] ETSI Industry Specification Group (ISG) NFV, “ETSI GS NFV-REL 001 V1.1.1 : Network Functions Virtualisation (NFV); Resiliency Requirements,” European Telecommunications Standards Institute, Tech. Rep., January 2015.
[16] “collectd – the system statistics collection daemon, viewed january 10, 2017.” [Online]. Available: http://collectd.org
[17] S. Suneja, C. Isci, V. Bala, E. De Lara, and T. Mummert, “Non-intrusive, out-of-band and out-of-the-box systems monitoring in the cloud,” in ACM SIGMETRICS Performance Evaluation Review, vol. 42, no. 1. ACM, 2014, pp. 249–261.
[18] N. L. Van Adrichem, C. Doerr, and F. A. Kuipers, “Opennetmon: Network monitoring in openflow software-defined networks,” in 2014 IEEE Network Operations and Management Symposium (NOMS). IEEE, 2014, pp. 1–8.
[19] S. R. Chowdhury, M. F. Bari, R. Ahmed, and R. Boutaba, “Payless: A low cost network monitoring framework for software defined networks,” in 2014 IEEE Network Operations and Management Sym-posium (NOMS). IEEE, 2014, pp. 1–9.
[20] R. Van Renesse, K. P. Birman, and W. Vogels, “Astrolabe: A robust and scalable technology for distributed system monitoring, manage-ment, and data mining,” ACM transactions on computer systems (TOCS), vol. 21, no. 2, pp. 164–206, 2003.
[21] I. Legrand, H. Newman, R. Voicu, C. Cirstoiu, C. Grigoras, C. Dobre, A. Muraru, A. Costan, M. Dediu, and C. Stratan, “Monalisa: An agent based, dynamic service system to monitor, control and optimize distributed systems,” Computer Physics Communications, vol. 180, no. 12, pp. 2472–2498, 2009.
[22] E. Imamagic and D. Dobrenic, “Grid infrastructure monitoring system based on nagios,” in Proceedings of the 2007 workshop on Grid monitoring. ACM, 2007, pp. 23–28.
[23] J. Gutierrez-Aguado, J. M. A. Calero, and W. D. Villanueva, “Iaas-mon: Monitoring architecture for public cloud computing data cen-ters,” Journal of Grid Computing, vol. 14, no. 2, pp. 283–297, 2016. [24] M. L. Massie, B. N. Chun, and D. E. Culler, “The ganglia distributed monitoring system: design, implementation, and experience,” Parallel Computing, vol. 30, no. 7, pp. 817–840, 2004.
[25] P. Hasselmeyer and N. d’Heureuse, “Towards holistic multi-tenant monitoring for virtual data centers,” in Network Operations and Man-agement Symposium Workshops (NOMS Wksps), 2010 IEEE/IFIP. IEEE, 2010, pp. 350–356.
[26] “statsd, github project, viewed january 10, 2017.” [Online]. Available: https://github.com/etsy/statsd
[27] “Openstack monasca — wiki page, n.d., viewed january 10, 2017.” [Online]. Available: https://wiki.openstack.org/wiki/Monasca [28] D. Balouek, A. Carpen Amarie, G. Charrier, F. Desprez, E. Jeannot,
E. Jeanvoine, A. Lèbre, D. Margery, N. Niclausse, L. Nussbaum, O. Richard, C. Pérez, F. Quesnel, C. Rohr, and L. Sarzyniec, “Adding virtualization capabilities to the Grid’5000 testbed,” in Cloud Comput-ing and Services Science, ser. Communications in Computer and In-formation Science, I. Ivanov, M. Sinderen, F. Leymann, and T. Shan, Eds. Springer International Publishing, 2013, vol. 367, pp. 3–20. [29] R.-A. Cherrueau, A. Lebre, D. Pertin, A. Simonet, and M. Simonin,
“Toward a Holistic Framework for Conducting Scientific Evaluations of OpenStack,” in Proceedings of the 17th IEEE/ACM International Symposium of Cluster, Grid and Cloud Computing (CCGRID 2017), May 2017.