HAL Id: hal-00681304
https://hal.archives-ouvertes.fr/hal-00681304v2
Submitted on 13 Feb 2013HAL is a multi-disciplinary open access archive for the deposit and dissemination of sci-entific research documents, whether they are
pub-L’archive ouverte pluridisciplinaire HAL, est destinée au dépôt et à la diffusion de documents scientifiques de niveau recherche, publiés ou non,
Objective View Synthesis Quality Assessment
Pierre-Henri Conze, Philippe Robert, Luce Morin
To cite this version:
Pierre-Henri Conze, Philippe Robert, Luce Morin. Objective View Synthesis Quality Assessment. Stereoscopic Displays and Applications, Jan 2012, San Francisco, United States. pp.8288-56. �hal-00681304v2�
Objective View Synthesis Quality Assessment
Pierre-Henri Conze
*1,2, Philippe Robert
1and Luce Morin
21
Technicolor, Rennes, France
2
IETR UMR CNRS 6164, INSA, Rennes, France
ABSTRACT
View synthesis brings geometric distortions which are not handled efficiently by existing image quality assessment metrics. Despite the widespread of 3-D technology and notably 3D television (3DTV) and free-viewpoints television (FTV), the field of view synthesis quality assessment has not yet been widely investigated and new quality metrics are required. In this study, we propose a new full-reference objective quality assessment metric: the View Synthesis Quality Assessment (VSQA) metric. Our method is dedicated to artifacts detection in synthesized view-points and aims to handle areas where disparity estimation may fail: thin objects, object borders, transparency, variations of illumination or color differences between left and right views, periodic objects… The key feature of the proposed method is the use of three visibility maps which characterize complexity in terms of textures, diversity of gradient orientations and presence of high contrast. Moreover, the VSQA metric can be defined as an extension of any existing 2D image quality assessment metric. Experimental tests have shown the effectiveness of the proposed method.
Keywords: View Synthesis, Image Quality Assessment, Quality Metrics, Free-viewpoints Video, 3DTV.
1. INTRODUCTION
Objective image quality assessment is a challenging research task which has been becoming an important issue in a broad range of applications such as acquisition, compression, restoration, transmission... The aim is to automatically predict perceived image quality. The emergence of such metrics occurred in order to substitute subjective assessment which is time consuming, costly and which cannot be conducted in real time. Many researchers have tried to develop objective image quality assessment metrics that take advantage of known characteristics of the human visual system (HVS). Thus, the structural similarity (SSIM) image index 1 has been created, among other metrics, in order to overcome pixel-based signal fidelity metrics like the mean square error (MSE) and the related peak signal-to-noise ratio (PSNR). SSIM assumes that the HVS is highly adapted for extracting structural information from a scene and relies on the assessment of the degradation of structural information.
Several extensions of SSIM have been proposed afterwards in order to achieve better consistency with subjective perception. Wang et al. 2 extend SSIM to a multi-scale approach (MS-SSIM) by iteratively low-pass filtering and down-sampling images. Chen et al. 3 propose to apply SSIM on gradient reference and distorted images in order to build the gradient-SSIM (G-SSIM) metric. The edge-SSIM (E-SSIM) proposed by Liu et al. 4 differentiates micro and macro edges similarity within the SSIM procedure. Other methods propose to weight SSIM distortion values according to an error visibility detection map obtained from gradient information 5, global phase coherence information6, local information content 7…
New structural information based image quality metrics have also been proposed. Inspired by that HVS is sensitive to image local orientation features, the histograms of oriented gradients (HOG) based metric has been created 8. The quality assessment is performed by computing the difference between gradient orientations of image patches which allows robust distortion detection with a low computational complexity.
*
All the previously described methods perform quite well when dealing with compression artifacts such as blocking artifacts, blurring artifacts, ringing or edge artifacts… However, are existing metrics appropriate for assessing synthesized views?
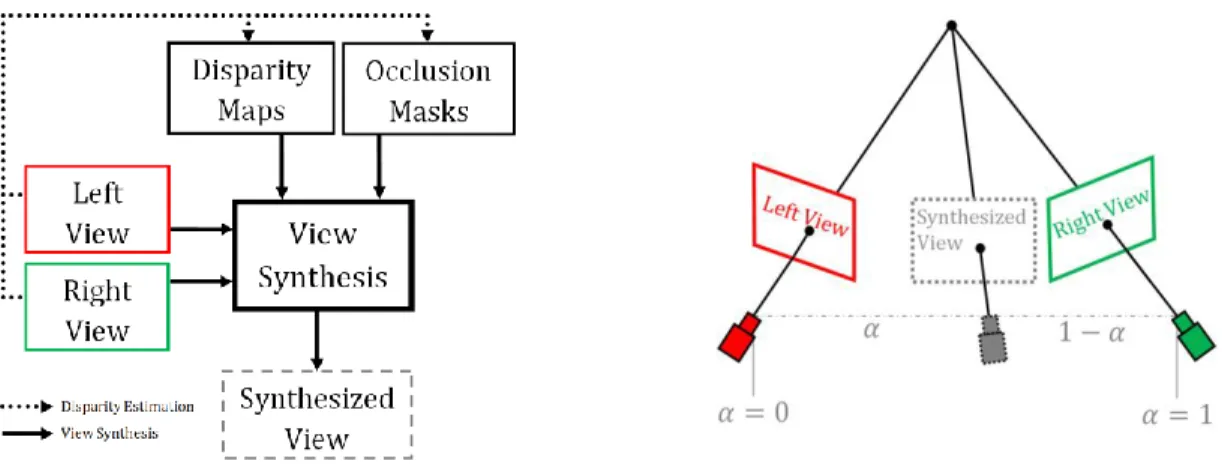
In this paper, we address the problem of view synthesis from binocular input, often called depth-image-based rendering (DIBR). DIBR consists by definition in synthesizing new images at a slightly different view perspective. We consider view synthesis through disparity estimation between left and right images and then interpolation (or extrapolation) of the virtual view through disparity compensation (Figure 1). The main artifacts encountered in view synthesis are not the same as in compression. These artifacts are due to either disparity estimation or interpolation. The field of view synthesis quality assessment has not been widely investigated despite the widespread of 3-D technology (entertainment, medical applications…) and notably 3D television (3DTV) and free-viewpoints television (FTV). Nevertheless, artifacts that may arise in synthesized views can seriously impair image quality.
Figure 1 – View synthesis system. denotes the distance between the synthesized view and the left view.
Two studies have notably tried to focus explicitly on view synthesis quality assessment. Firstly, according to Ekmekcioglu et al. 9, HVS is more affected by distortions happening on the front part of the scene. Consequently, they propose to weight distortion values according to the scene depth information. Secondly, Devernay and Ramos-Peon 10 propose to detect view synthesis artifacts as areas which are surrounded by high Laplacian differences and inside which the intensity or gradient difference with the original images is high. Unfortunately, this method seems to detect only small artifacts and large artifacts remain after the proposed process.
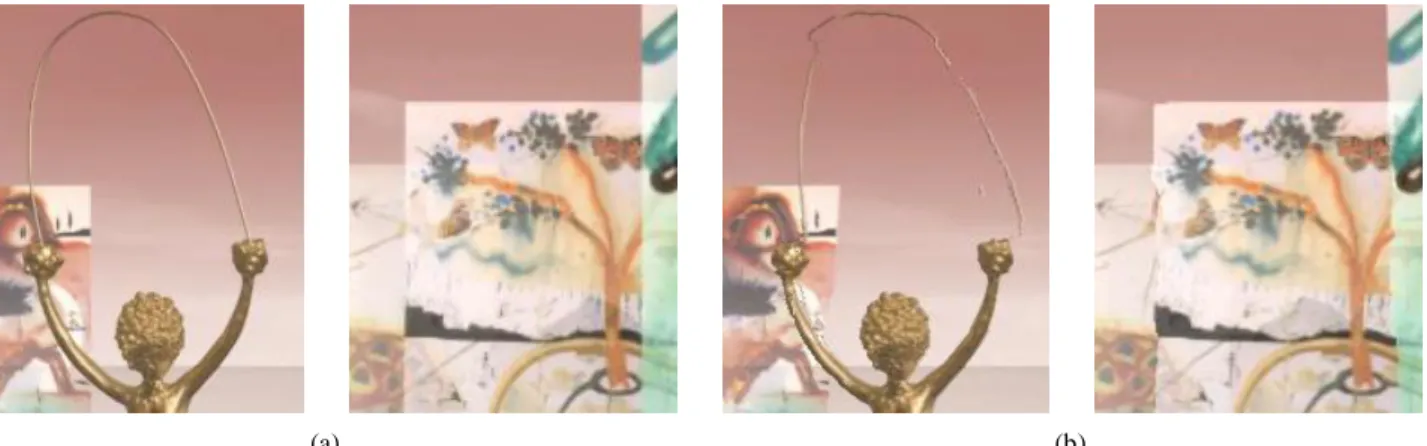
Another approach consists in using traditional objective metrics to assess synthesized views. However, Bosc et al. 11 showed that the view synthesis quality assessment with theses metrics is not efficient. More precisely, the artifact detection fails on the following situations: textureless areas, transparency, thin objects, object borders, variations of illumination or color differences between left and right views, periodic objects… Some of these artifacts are illustrated in Figure 2 and zoom on details are available in Figure 3. New methods are required in order to efficiently detect distortions introduced by view synthesis.
(a) (b) Figure 3 – Zoom on two distorted areas: (a) reference view (b) synthesized view.
In this work, our motivation has been to create a new full-reference objective image quality assessment metric dedicated to view synthesis quality assessment: the View Synthesis Quality Assessment (VSQA) metric. This metric can be based on any existing 2D image quality assessment metric. Moreover, it takes into account complexity in terms of textures, diversity of gradient orientations and presence of high contrast.
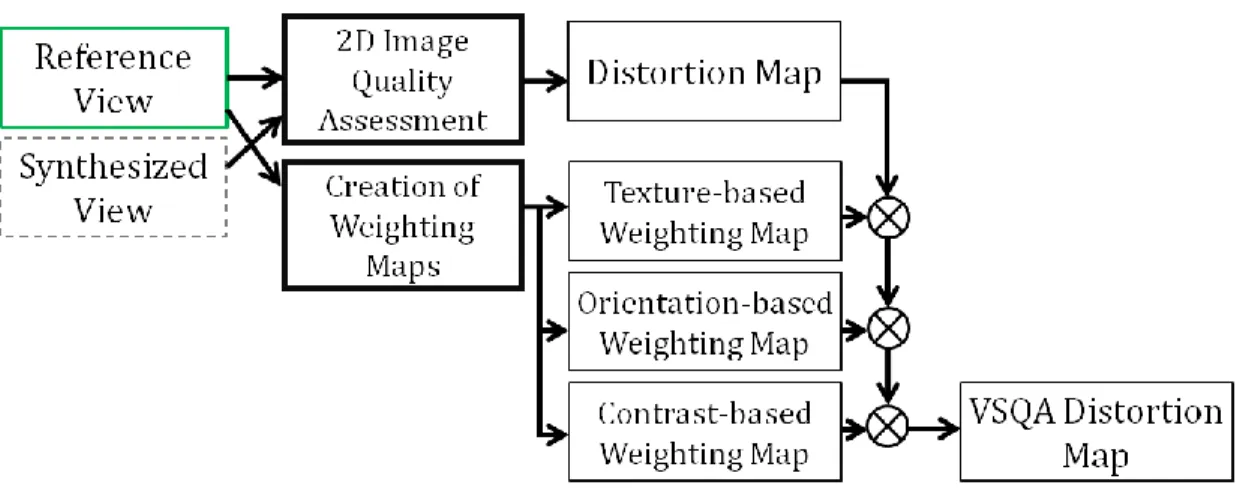
In order to illustrate our study, we have chosen to build our metric as an extension of the structural similarity image index (SSIM) which is known for its effectiveness in terms of artifact detection and its simplicity. Thus, the VSQA metric becomes the SSIM-based VQA metric. We have also considered that the comparison between the right (respectively left) view and the view synthesized at the right (respectively left) position gives enough information in order to assess the quality of the whole view synthesis. These two views are referred to as reference and synthesized views in the following (Figure 4). Note that our approach does not assess the quality of areas which are not visible in the left (respectively right) view if the right (respectively left) view is used as reference view.
Figure 4 – View synthesis at the right position and quality assessment by comparing the reference and the synthesized views by the proposed metric, the View Synthesis Quality Assessment (VSQA) metric.
The paper is organized as follows. For our illustration, Section 2 reviews SSIM, the metric used as a basis for the proposed approach. The VSQA metric is then described in Section 3. Section 4 presents experimental results obtained with the SSIM-based VSQA metric. Finally, Section 5 concludes the paper.
2. STRUCTURAL SIMILARITY
Wang et al. 1 have proposed a full reference objective image quality assessment based on the observation that the HVS is highly adapted for extracting structural information from a scene. The created metric, called structural similarity image index (SSIM), is based on the assessment of the degradation of structural information.
The task of similarity measurement is divided into three comparisons: luminance, contrast and structure. Let and be two image patches extracted from the same spatial location from the reference and the distorted images. and correspond to the image content at the th local window and is the number of local windows in the images. The three comparison functions yield a general form of the SSIM index:
. . (1)
The functions , and denote respectively luminance, contrast and structure comparison functions and are defined in (2), (3) and (4). , and are real positive parameters used to adjust the relative importance of the three comparison functions.
(2)
(3)
(4)
where and are the means of and , and are the standard deviations of and and is the correlation coefficient between and . These parameters are computed within 11 11 windows with a Gaussian filter for each window. Positive non-null values for , and prevent the situation where the denominator is close to zero. Usually, , and where is the dynamic range of pixel values. The SSIM metric yields also to a global quality score for a given reference-distorted image pair: the mean SSIM (MSSIM), described in (5):
(5)
3. THE PROPOSED VSQA METRIC
In this section, we present a new quality metric dedicated to view synthesis: the View Synthesis Quality Assessment (VSQA) metric. VSQA is based on the fact that the perception of artifacts is strongly linked with the features of the spatial environment and notably with the complexity in terms of textures, the diversity of gradient orientations and the presence of high contrast. As described in Figure 5, our approach consists in weighting the distortion values obtained from the chosen 2D image quality assessment metric (SSIM for instance). Weights are computed based on three weighting maps directly created from three visibility maps. It leads to a final distortion map called -based VSQA distortion map (where corresponds to the chosen metric), which is computed as follows:
(6)
denotes the distortion value given by the chosen 2D image quality assessment metric for a given pixel . , and correspond respectively to the texture, orientation and contrast based weighting maps. , , are real positive parameters used to adjust the relative importance of the three weighting maps.
Figure 5 – Diagram of the proposed quality measurement system with .
The three weighting maps characterize complexity in terms of textures, diversity of gradient orientations and presence of high contrast. These maps are referred to as texture-based weighting map, orientation-based weighting map and contrast-based weighting map in this paper. The computation of these weighting maps consists in extracting image features within large windows in order to take into account possible masking effects due to the environment.
The following of this section focuses on how to create the three weighting maps and describes the effect of each one on distortion values. Finally, we explain how they are combined in order to compute the final VSQA score.
3.1. Texture-based Weighting Map
The texture-based weighting map describes the complexity of the neighborhood in terms of textures. Actually, the perception of artifacts surrounded with high gradient pixels is attenuated due to masking effect. Inversely, artifacts within untextured areas are more visible. Thus, when an artifact is located in a low texture complexity area, the weighting aims to increase the corresponding distortion value (or to decrease it if we consider a similarity metric, i.e. the smaller the distortion value is, the stronger the artifact is). On the contrary, if an artifact is located in a high texture complexity area, the weighting aims to decrease the corresponding distortion value (or to increase it if we consider a similarity metric).
More precisely, the texture-based weighting map is computed as follows. Let us consider first of all the texture-based visibility map from which the texture-based weighting map will be computed. First, the method consists in deriving an image gradient from the reference view with a Sobel operator. Then, each pixel value of is computed as the mean of the gradient magnitude values over a large surrounding window, as described in Equation 7. Note that a Gaussian weighting function normalized to unit sum is involved in the computation.
(7)
where denotes the texture-based visibility map, is the gradient magnitude map, is the Gaussian weighting function and is the window size.
Finally, the texture-based weighting map is created by rescaling the texture-based visibility map between 0 and 2 as described in (8). and are computed over the visibility map . Note that this equation is consistent only if the chosen 2D image quality assessment metric is a similarity metric.
3.2. Orientation-based Weighting Map
Secondly, the orientation-based weighting map aims to quantify for each pixel the diversity of gradient orientations of the neighborhood. Only the high textured areas are taken into account (thresholding over the gradient values). The use of such map has been inspired by the fact that HVS is quite sensitive to image local orientation features 8. The main idea is to take into account masking effect due to large diversity of gradient orientations. Indeed, we can easily think that a large diversity of gradient orientations can decrease artifacts visibility. Inversely, if all neighbors of a considered pixel have same gradient orientation, an artifact located in that point attracts the gaze. This is especially true given that view synthesis artifacts are geometric artifacts and that objects are subject to structural modifications. Thus, when an artifact is located in a low gradient orientations diversity area, the weighting aims to increase the corresponding distortion value (or to decrease it if we consider a similarity metric). On the contrary, in a high gradient orientations diversity area, the weighting aims to decrease the corresponding value (or to increase it if we consider a similarity metric).
Before computing the orientation-based weighting map , the gradient orientation map at pixel level is computed from the reference view with (9).
(9)
where and correspond for a given pixel to the horizontal and vertical gradients respectively. Note that all the obtained values are defined modulo . Let us consider as previously the orientation-based visibility map from which the orientation-based weighting map will be computed. The idea is to compute each pixel value of the orientation-based visibility map as the standard deviation in terms of gradient orientations with respect to a reference gradient orientation value. This reference value corresponds to the center of the interval of size which minimizes the standard deviation in terms of gradient orientations over the window centered around . The complete formula is given in (10). As previously, a Gaussian weighting function normalized to unit sum is considered.
(10)
where denotes the orientation-based visibility map, is the gradient orientation values for a given position ), is the reference gradient orientation value, is the Gaussian weighting function and is the window size. Finally, the orientation-based weighting map is created by rescaling the orientation-based visibility map between 0 and 2 as described in (11) for similarity metrics.
(11)
3.3 Contrast-based Weighting Map
The contrast-based weighting map highlights luminance differences between pixels and their neighborhood. The goal is to give a better importance to artifacts located on pixels whose luminance value differs significantly with the luminance values of the neighborhood. Thus, in this type of area, the weighting aims to increase the corresponding distortion value (or to decrease it if we consider a similarity metric). On the contrary, if the luminance difference is not significant, the weighting aims to decrease the corresponding distortion value (or to increase it if we consider a similarity metric). Let us consider as previously the contrast-based visibility map from which the contrast-based weighting map will be computed. This third visibility map can be created by first computing the luminance image from the reference view. Then, as described in (12), we compute each pixel value of the contrast-based visibility map as the mean of the absolute differences between the luminance values over a large surrounding window and the luminance value of the
current pixel (center of the window). Note that a Gaussian weighting function normalized to unit sum is also involved here.
(12)
where denotes the contrast-based visibility map, the luminance of the reference image, is the Gaussian weighting function and is the window size.
Finally, the contrast-based weighting map is created by rescaling the contrast-based visibility map between 0 and 2 as described in (13) for similarity metrics.
(13)
3.4. Spatial Pooling Method: VSQA Score
In order to obtain a global score for the whole image quality, as MSSIM, we suggest to create a thresholded VSQA distortion map and to count the number of remained pixels after thresholding. The obtained result gives what we call the VSQA score. Let and be respectively the minimum and maximum distortion values within the VSQA distortion map. If the used 2D objective image quality assessment metric is a similarity metric, the threshold can be fixed as described in (14). In this case, pixels whose VSQA distortion value is under are activated in the thresholded VSQA distortion map and taken into account in the computation of the VSQA score.
(14)
where is a positive parameter and and the minimum and maximum VSQA distortion values respectively.
4. EXPERIMENTAL RESULTS AND DISCUSSION
The goal of this section is to validate the proposed View Synthesis Quality Assessment (VSQA) metric. Firstly, we use an example to demonstrate the effectiveness of VSQA in evaluating the perceptible image quality (sub-section 3.1). Secondly, we carry out an overall performance comparison thanks to subjective data provided in 12 (sub-section 3.2).
4.1 Example to demonstrate the effectiveness of VSQA
In this sub-section, we compare visually SSIM (described in Section 2) and SSIM-based VSQA (described in Section 3). SSIM and SSIM-based VSQA have been applied on the reference and the synthesized views shown in Figure 2. The synthesized view has been created by the disparity-compensated view synthesis proposed in 13.
Figure 6 shows the SSIM distortion map (a), the SSIM-based VSQA distortion map (f) and the texture, orientation and contrast based weighting maps (b, c, e). These weighting maps are the maps used if the chosen 2D image quality assessment metric is a similarity metric, which is the case here with SSIM. They are consistent with (8), (11) and (13). Moreover, note that only the high textured areas are taken into account during the weighting by the orientation-based map. Consequently, Figure 6 (d) shows a mask, associated to the orientation-based weighting map, which indicates the considered areas.
The VSQA procedure is not applied to high quality pixels (thresholding on SSIM values). For these pixels, the VSQA distortion values correspond to the SSIM values. For pixels with a lower quality, the VSQA procedure is applied as described in Section 3. In addition, the three weighting maps have the same importance: . The texture-based weighting map and the contrast-texture-based weighting map are computed with 31 31 windows ( 31) with a standard deviation of 17 whereas the orientation-based weighting map uses 17 17 windows ( 17) with a standard deviation of 9.
The first artifact displayed in Figure 3 is due to inaccuracy of disparity estimation for thin objects. After projection, thin objects are completely unstructured. Here, artifacts are all the more noticeable since the background around the golden arc is untextured and different in terms of contrast. The second artifact (Figure 3) is essentially due to transparency which is not efficiently handled during disparity estimation. Vertical edges are not perfectly straight. However, it is not as noticeable as the first artifact because it is in a high-textured area containing various orientation features.
(a) (b)
(c) (d)
(e) (f)
Figure 6 – (a) SSIM distortion map (b) Texture-based weighting map (c) Orientation-based weighting map (d) Mask associated
to the orientation-based weighting map (e) Contrast-based weighting map (f) SSIM-based VSQA distortion map. For (a) and (f),
the darker the pixel is, the more the distortion is. Concerning (b), (c) and (e), dark areas indicate high-visibility areas for distortions. For these areas, the weighting decrease SSIM values which accentuates the corresponding artifacts. Conversely, bright areas indicate low-visibility areas. In this case, the weighting increase SSIM values in order to attenuate the corresponding artifacts. White pixels in (d) correspond to pixels taken into account during the orientation-based weighting. Black pixels are not considered.
Let us consider thresholded versions of the SSIM and the SSIM-based VSQA distortion maps (Figure 7). The same number of erroneous pixels has been kept (2300 pixels) in order to allow a comparison between the two approaches. As described in Section 3, VSQA reorganizes the prioritization of the pixels in terms of quality. Thus, the SSIM and SSIM-based VSQA distortions maps do not highlight the same erroneous pixels.
In order to be consistent with the human perception of artifacts, an image quality metric should schematically focus on the first artifact (Figure 7, (c) and (d)) and give smaller distortion values in the second distorted area (Figure 7, (g) and (h)). It appears that SSIM distortion values are not consistent with these considerations. On the contrary, VSQA highlights visually important distortions and attenuates insignificant distortions.
(a) (b)
(c) (d) (e) (f)
(g) (h) (i) (j)
Figure 7 – (a) Thresholded SSIM distortion map (b) Thresholded SSIM-based VSQA distortion map: in both cases, the 2300 worst erroneous pixels have been kept – Zoom on two distorted areas in the reference view: (c) and (g), in the synthesized view: (d) and (h), in the thresholded SSIM distortion map: (e) and (i) and in the thresholded SSIM-based VSQA distortion map: (f) and (j). In (a), (b), (e), (f), (i) and (j), white pixels indicate the pixels considered as erroneous after thresholding. Shapes with solid lines focuses on
Figure 7 shows that some important erroneous areas are detected in the thresholding SSIM-based VSQA distortion map and not in the SSIM one (parts of the golden arc for instance). Moreover, compared to SSIM, SSIM-based VSQA highlights more artifacts located within untextured areas where the contrast is high (golden arc). Conversely, it can be observed that masking in terms of texture complexity and gradient orientations diversity has been taken into account during the weighting procedure. Indeed, some artifacts located on the transparent panels have been attenuated by VSQA.
4.2 Performance comparison between VSQA and existing quality metrics
In this section, we aim to compare VSQA with existing quality metrics. More precisely, the objective is to compare the correlation between subjective measurements and existing objective quality metrics and the correlation between subjective measurements and the proposed SSIM-based VSQA metric. These comparisons are done on the IRCCyN/IVC DIBR images database 12,†.
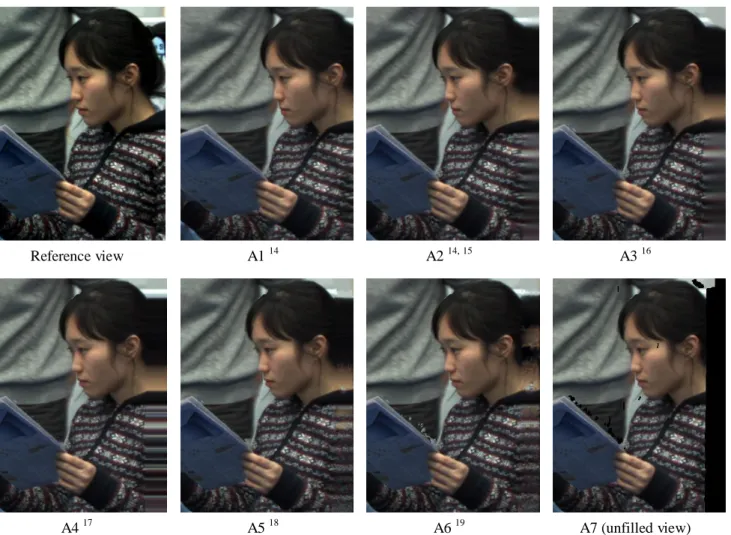
Three test sequences are used to generate four different viewpoints (12 sequences to synthesize in total). The test sequences are BookArrival (1024 768, 16 cameras with 6.5cm spacing), Lovebird1 (1024 768, 12 cameras with 3.5cm spacing) and Newspaper (1024 768, 9 cameras with 5cm spacing). The synthesized sequences are obtained by seven depth-image-based rendering (DIBR) methods in order to reach 84 synthesized sequences in total. These methods, referenced from A1 to A7, are illustrated Figure 8 and briefly described in the following.
Reference view A1 14 A2 14, 15 A3 16
A4 17 A5 18 A6 19 A7 (unfilled view)
Figure 8 – Reference view and DIBR-based synthesized views (Newspaper sequence).
†
- A1: Fehn 14 applies a 2D Gaussian low-pass filter to the created disparity map in a manner that no disocclusions occur in the synthesized view. However, this approach fails to extrapolate holes on the left or right border image. The issue is avoided by cropping left or right borders and interpolating in order to reach the original image size. Note that it is not possible to consider this method to render synthesized views for autostereoscopic multiview displays if the other views are not also cropped (loss of the stereo impression).
- A2: This second approach is also based on Fehn 14 except that borders are not cropped but inpainted by the method proposed by Telea 15.
- A3: Mori et al. 16 describe a 3D view generation system which has been adopted as reference software for MPEG standardization experiments in the 3D Video group. This method consists in first projecting depth map to virtual image plane and then post-filtering the projected depth map from the assumption that the depth value inside same object changes smoothly.
- A4: Muller et al. 17 propose different hole-filling methods as well as a final smoothing filtering along depth discontinuities in order to provide high-quality synthesized views.
- A5: In 18, each synthesized view disocclusion is compensated using image information from a causal picture neighborhood via a background sprite. Residual holes are filled with an advanced patch-based texture synthesis method.
- A6: Köppel et al. 19 extend A5 18 by generating and updating temporally a background sprite. - A7: It corresponds to the unfilled sequences (with holes).
Key frames taken within the synthesized sequences are evaluated with the following objective metrics: - Peak Signal-to-Noise Ratio (PSNR‡).
- Universal Quality Index (UQI‡) 20 corresponds to SSIM with 0 in (2), (3) and (4). - Single-scale Structural SIMilarity (SSIM‡) 1, described in Section 2.
- SSIM-based VSQA metric and more precisely the proposed VSQA score described in sub-section 3.4. Note that the VSQA score have been computed with 19 in (14).
- Multi-scale Structural SIMilarity (MS-SSIM‡) 2.
- Visual Signal-to-Noise Ratio (VSNR‡) 21 consists in quantifying the visual fidelity of natural images based on both low-level and mid-level properties of HVS.
- Weighted Signal-to-Noise Ratio (WSNR‡) uses a function adapted to HVS.
- Visual Information Fidelity (VIF‡) 22 is an information fidelity metric based on Shannon information that is shared between the reference and the distorted images relative to the information contained in the reference image itself.
- VIFP‡, a pixel-based version of VIF.
- Information Fidelity Criterion (IFC‡) 23 uses the mutual information between reference and distorted images. - Noise Quality Measure (NQM‡) 24 quantifies the impact on HVS of frequency distortion and noise injection in
the tested image.
- PSNR-HVS 25 is based on PSNR and UQI modified to take into account the HVS properties.
- PSNR-HVSM 26 corresponds to a simple model based on PSNR and between-coefficient masking of DCT basis functions.
‡
According to Bosc et al. 12, the subjective experiments have been done with 43 non-expert observers and have provided five-level absolute categorical ratings (ACR-5) for every key frame. The observers mean opinion scores (MOS) have been used to obtain the difference mean opinion scores (DMOS). DMOS corresponds to the difference between MOS computed on reference and synthesized views.
Before performing the comparison, the objective quality scores must be fitted to the subjective measurements using a logistic function according to the Video Quality Expert Group (VQEG) Phase I FR-TV 27. Here, the regression is performed with a cubic function as follows:
(15)
corresponds to the predicted difference mean opinion score for the synthesized view , the score obtained with the tested objective metric (MSSIM or VSQA score for instance) and the parameters of the cubic function to be determined during the regression step (minimization of ).
Once the regression is achieved, the Person linear correlation coefficient (PLCC) is computed for each fitted objective metrics , as described in (16).
(16)
where and denote the average of and over the tested key frames .
PLCC measures the consistency between subjective measurements and quality scores for SSIM-based VSQA and existing metrics. Table 1 and Figure 9 show the results.
PSNR SSIM SSIM-based VSQA
MS-SSIM VSNR VIF VIFP UQI IFC NQM WSNR
PSNR HVSM PSNR HVS PLCC DMOS 45.65 43.63 61.42 55.99 35.89 32.03 25.55 39.27 27.90 53.34 44.12 40.57 39.25
Table 1 – Person linear correlation coefficients (PLCC) between DMOS and objective quality scores in percentage.
Figure 9 – Person linear correlation coefficients (PLCC) between DMOS and objective quality scores in percentage.
0 10 20 30 40 50 60 70 80 90 100 PSNR SSIM SSIM-based VSQA MS-SSIM VSNR VIF VIFP UQI IFC NQM WSNR PSNR HVSM PSNR HVS SSIM-based VSQA
Within the existing metrics and according to the obtained correlation coefficients, MS-SSIM and NQM are the most correlated metrics. These metrics are the only ones to overtake 50% in terms of similarity with human judgment. SSIM-based VSQA succeeds in improving the correlation coefficients reached by SSIM (43.63%) and obtains 61.42%, which means a gain of around 17.8%. SSIM-based VSQA achieves the best correlation results. Indeed, Figure 9 shows that SSIM-based VSQA exceeds the best existing metric, MS-SSIM, with a PLCC more than 5% higher.
5. CONCLUSIONS
To conclude, we have designed a new objective view synthesis quality assessment metric: the View Synthesis Quality Assessment (VSQA) metric. The key feature of the proposed method is the use of three visibility maps which characterize complexity in terms of textures, diversity of gradient orientations and presence of high contrast. VSQA can be based on any existing 2D image quality assessment metric.
An overall performance comparison between SSIM-based VSQA and existing quality metrics has been done. The obtained correlation coefficients between subjective measurements and objective quality scores have shown that SSIM-based VSQA improves the results obtained by a simple quality measurement reached by SSIM. Moreover, experimental tests have proved that SSIM-based VSQA exceeds all the tested existing quality metrics.
Future work aims to improve the proposed quality measurement system in order to obtain a method more correlated to human perception of artifacts. VSQA as an extension of other metrics will be also tested. In addition, we would like to introduce a temporal consistency in the quality measurements in order to take into account temporal fluctuations of spatial distortions. Finally, another natural extension of this work would be to consider the issue of the correction of detected artifacts.
ACKNOWLEDGMENTS
We would like to acknowledge the IRCCyN laboratory (Institut de Recherche en Communications et Cybernétique de
Nantes) for providing the IRCCyN/IVC DIBR images database.
REFERENCES
[1] Wang, Z., Bovik, A., Sheikh, H., and Simoncelli, E., “Image quality assessment: From error visibility to structural similarity”, Image Processing, IEEE Transactions on, 13(4), 600-612 (2004).
[2] Wang, Z., Simoncelli, E., and Bovik, A., “Multiscale structural similarity for image quality assessment”, Signals,
Systems and Computers, Conference Record of the Thirty-Seventh Asilomar Conference on, 2, 1398-1402 (2004).
[3] Chen, G., Yang, C., and Xie, S., “Gradient-based structural similarity for image quality assessment”, Image
Processing, IEEE International Conference on, 2929-2932 (2007).
[4] Liu, L. and Wang, Y., “A mean-edge structural similarity for image quality assessment”, Sixth International
Conference on Fuzzy Systems and Knowledge Discovery, 311-315 (2009).
[5] Li, C. and Bovik, A., “Content-partitioned structural similarity index for image quality assessment”, Signal
Processing: Image Communication, 25(7), 517-526 (2010).
[6] Wang, D., Ding, W., and Man, Y., “A joint image quality assessment method based on global phase coherence and structural similarity”, Image and Signal Processing (CISP), 3rd International Congress on, 5, 2307–2311 (2010).
[7] Wang, Z. and Li, Q., “Information content weighted structural similarity index for image quality assessment”,
IEEE Transactions on Image Processing (2010).
[8] Wang, Y., Jiang, T., Ma, S., and Gao, W., “Image quality assessment based on local orientation distributions”,
[9] Ekmekcioglu, E., Worrall, S. T., De Silva, D., Fernando, W., and Kondoz, A. M., “Depth based perceptual quality assessment for synthesized camera viewpoints”, Second International Conference on User Centric Media (2010). [10] Devernay, F. and Ramos-Peon, A., “Novel view synthesis for stereoscopic cinema: Detecting and removing
artifacts”, ACM Workshop on 3D Video Processing (2010).
[11] Bosc, E., Köppel, M., Pépion, R., Pressigout, M., Morin, L., Ndjiki-Nya, P., and Le Callet, P., “Can 3D synthesized views be reliably assessed through usual subjective and objective evaluation protocols?”, Image
Processing, IEEE International Conference on (2011).
[12] Bosc, E., Pépion, R., Le Callet, P., Köppel, M., Ndjiki-Nya, P., Pressigout, M., and Morin, L., “Towards a new quality metric for 3D synthesized view assessment,” IEEE Journal on Selected Topics in Signal Processing (2011).
[13] Robert, P., Thébault, C., and Conze, P. H., “Disparity-compensated view synthesis for S3D content correction” in
SPIE IS&T Electronic Imaging Stereoscopic Displays and Applications (2012).
[14] Fehn, C., “Depth-image-based rendering (DIBR), compression, and transmission for a new approach on 3D-TV” in SPIE IS&T Electronic Imaging, 5291, 93 (2004).
[15] Telea, A., “An image inpainting technique based on the fast marching method”, Journal of Graphics, GPU, and
Game Tools, 9(1), 23-34 (2004).
[16] Mori, Y., Fukushima, N., Yendo, T., Fujii, T., and Tanimoto, M., “View generation with 3D warping using depth information for FTV”, Signal Processing: Image Communication, 24(1-2), 65-72 (2009).
[17] Muller, K., Smolic, A., Dix, K., Merkle, P., Kauff, P., and Wiegand, T., “View synthesis for advanced 3D video systems”, EURASIP Journal on Image and Video Processing, 1-12 (2008).
[18] Ndjiki-Nya, P., Köppel, M., Doshkov, D., Lakshman, H., Merkle, P., Muller, K., and Wiegand, T., “Depth image-based rendering with advanced texture synthesis for 3D video”, Multimedia & Expo, IEEE International
Conference on, 13, 453-465 (2010).
[19] Köppel, M., Ndjiki-Nya, P., Doshkov, D., Lakshman, H., Merkle, P., Muller, K., and Wiegand, T., “Temporally consistent handling of disocclusions with texture synthesis for depth-image-based rendering”, Image Processing,
IEEE International Conference on, 1809-1812 (2010).
[20] Wang, Z. and Bovik, A., “A universal image quality index”, Signal Processing Letters, IEEE, 9(3), 81-84 (2002). [21] Chandler, D. and Hemami, S., “VSNR: A wavelet-based visual signal-to-noise ratio for natural images”, Image
Processing, IEEE Transactions on, 16(9), 2284-2298 (2007).
[22] Sheikh, H. and Bovik, A., “Image information and visual quality”, Image Processing, IEEE Transactions on, 15(2), 430-444 (2006).
[23] Sheikh, H., Bovik, A., and De Veciana, G., “An information fidelity criterion for image quality assessment using natural scene statistics” Image Processing, IEEE Transactions on 14(12), 2117-2128 (2005).
[24] Damera-Venkata, N., Kite, T., Geisler, W., Evans, B., and Bovik, A., “Image quality assessment based on a degradation model”, Image Processing, IEEE Transactions on, vol. 9, no. 4, pp. 636–650 (2000).
[25] Egiazarian, K., Astola, J., Ponomarenko, N., Lukin, V., Battisti, F., and Carli, M., “New full-reference quality metrics based on HVS”, Proceedings of the Second International Workshop on Video Processing and Quality
Metrics, 4 (2006).
[26] Ponomarenko, N., Silvestri, F., Egiazarian, K., Carli, M., Astola, J., and Lukin, V., “On between-coefficient contrast masking of DCT basis functions”, Proceedings of the Third International Workshop on Video Processing
and Quality Metrics, 4 (2007).
[27] Rohaly, A., Libert, J., Corriveau, P., Webster, A., et al., “Final report from the video quality experts group on the validation of objective models of video quality assessment”, ITU-T Standards Contribution COM, 9-80 (2000). [28] MeTRiX MuX visual quality assessment package, http://foulard.ece.cornell.edu/gaubatz/metrix_mux/.