Selection of the most efficient wavelength bands for ' Jonagold' apple
sorting
O. Kleynen, V. Leemans, M.-F. Destain
Unité de Mécanique et Construction, Gembloux Agricultural University, Passage des Déportés, 2, B-5030 Gembloux, Belgium Abstract
This paper presents a method based on quadratic discriminant analysis to select the best filters for detecting a wide range of defects in 'Jonagold' apple fruit using a multi-spectral vision system. Reflectance spectra of damaged and sound tissue were recorded using a visible/NIR spectrometer. Analysed defects consisted of scald, hail damage (with and without skin perforation), limb rubs, russets, scab tissue, frost damage, rot, visible flesh damage and recent bruises. Camera filter effects were approximated by summing the reflectances of all the wavelengths within the filter bandwidth. Combinations of three and four filters were tested and evaluated for discriminating damaged tissues from healthy ones. If a three-filter combination appeared sufficient to detect most of the damaged tissue, a four-filter combination should be considered for the complete sorting automation of this bicolour apple variety. A fourth filter was necessary to quantify the ratio between the blush and ground colours. Regarding recent bruise defects which represented the major difficulty, an image segmentation algorithm based on local contrast variations can enhance their detection.
Keywords: Apple defects; Recent bruises; Bicolour fruit; Wavelength selection; Spectrometer
1. Introduction
'Jonagold' apples and mutants represent more than 60% of the whole apple production in Belgium. The marketing standard applying to apples in Europe is laid down by the EC commission regulation No. 1619/2001 (Anonymous, 2001), and defines three quality classes depending on the shape of the fruit, the colouring and the presence of defects.
Automated sorting machines based on vision systems are currently available to perform sorting operations on apples according to shape and colouring criteria. Automatic defect detection is still a difficult task with
'Jonagold' apples because of the high natural variability in the skin colour of this bicolour apple variety. Leemans et al. (1999) showed that russet detection on 'Jonagold' apples using a standard 3-CCD colour camera is a very complex task because this defect colour is very close to the fruit colour in the transition areas between blush and ground colours. Developing anear-infrared machine vision system for defect inspection on apple sorting lines, Wen and Tao (1999) also met difficulties in detecting russet and scar tissues on 'Delicious' apples which are, however, fruit with uniform skin colour.
In another domain, Chao et al. (2001) investigated a novel multi-spectral imaging system to differentiate different kinds of chicken heart diseases. This system, which has the potential to be used in real time, utilises four interference bandpass filters (selected by the user) to provide four spectrally discrete images on a single CCD focal plane. Within the scope of sorting 'Jonagold' apples with vision system-based machines, it appeared interesting to make use of such a device with four bandpass filters dedicated to defect detection, and this was our objective.
Considering selection of optimal wavelength bands, two main methods for distinguishing sound apples from damaged ones are reported in the literature: a spectrophotometric method and a camera/filter one. Using a spectrophotometric method, Geoola et al. (1994) analysed the reflectance spectra from 400 to 840 nm of 'Golden Delicious' apples to detect bruises. Tested classification criteria were presented by Upchurch et al. (1988) for bruise detection on 'Delicious' apples. Since they observed that reflection data were reasonably independent of wavelength in the range of 720 to 840 nm, they decided to use the average reflectance from 750 to 800 nm as a parameter to distinguish bruised apples from unbruised ones. Good classification rates were obtained with this parameter. Nevertheless, the authors concluded that the best parameter suggested by Upchurch et al. (1988) for bruise detection on 'Delicious' apples did not provide consistent results for 'Golden Delicious' apples. This last observation suggested that the method was sensitive to fruit colour and would be not applicable to a bicolour variety and for more than one kind of defect. Using a camera/ filter method, Wen and Tao (1998) proposed a method to select the filters of a dual wavelength vision system developed for on-line sorting of apples. The
method was tested on 48 sound and 96 defective apples of the 'Delicious' variety. With four longpass filters with cut-on wavelength points spaced every 50 nm from 650 to 800 nm, 12 dual filter combinations were tested and compared. Three sorting models based on the sizes of the defect blobs extracted from images were also
evaluated. The method revealed that the best solution was obtained with the 800 and 700 nm filter combination. This method however presented limitations when considering a wider wavelength range due to the number of filter combinations that had to be tested. The result also depended on the image sorting model. Using two monochrome cameras and two electronic tunable filters to span the visible and near-infrared spectra, Miller et al. (1998) captured 58 filtered images (from 460 to 1130 nm) of various defective and sound areas of eight apple varieties with relatively uniform skin colour. For each area, a normalised reflectance curve was extracted from the 58 filtered images. These reflectance values were then utilised as input for various recognition models. The multi-layer back propagation (MLBP) neural net model provided the highest correct classification rates. Using the contribution weights associated with the input values of the MLBP neural net, they found that the most significant wavelengths were in the 690-750 nm range and 530 nm. Since a spectrometer provides direct
reflectance values, using two cameras and two electronic filters appeared a relatively complex and costly method for finally computing reflectance curves. More recently, Mehl et al. (2002) used a monochrome camera and a hyperspectral imaging spectrograph to select three bandpass filters for detection of apple defects. The reflectance spectra of normal and damaged surfaces were computed from the hyperspectral images. The image defect segmentation was not explained. For each defect category, principal component analysis was performed on the reflectance spectra. By observing the weight distribution of the principal components providing the best visual contrast between sound tissue and each defective tissue category, the three wavelength bands that showed the best potential of discriminating all defects were chosen. As with the method used by Miller et al. (1998), it would be easier to use a spectrometer to obtain reflectance spectra directly than using a complex experimental device. On the other hand, choosing three filters by separate visual observations was not a good method to determine the best combination of three filters. Indeed, two highly correlated bands may not be individually effective for discrimination while their combination is well suited.
All these studies found significant wavelength bands above 700 nm, which suggested that it was important to scan beyond the visible spectrum. Since a CCD technology-based spectrometer was affordable, we chose, like Geoola et al. (1994) did, to work with a visible/near-infrared spectrometer. This apparatus also provided direct reflectance values without the need for using image analysis-dependent techniques.
Most of the quoted methods were only applied to apple varieties with relatively uniform skin colours. This paper focuses on defect detection on 'Jonagold' apples which are bicolour fruit. The main objective of the study was thus to find an objective and robust method for selecting four wavelength bands that could enhance the defect detection in this apple cultivar. A more extensive study on bruise defects was carried out to determine the change with time of the damaged surface reflectance after bruise creation.
2. Materials and methods 2.1. Materials
Reflectance spectra were acquired with an AVS-SD2000 spectrometer (Avantes, Inc.). This spectrometer included two CCD detectors coupled with two different diffraction gratings (600 lines/ mm) which had
respectively a sensitivity range of 350-850 and 650-1200 nm. Each detector was made of 2048 (211) elements. A
reflection fibre optic probe (FCR-8UV/IR200-2-45-ME, Avantes, Inc.) consisting of eight fibres (200 µm diameter) was used to carry the light emitted by a tungsten halogen source (HL-2000, Avantes, Inc.) to the sample (six fibres) and the light reflected by the sample to the two detectors of the spectrometer (one fibre by detector). The probe head was designed to analyse the sample under 45°. This angle was necessary to avoid direct reflection from the light source. The probe was directly applied to the sample surface during measurement. From the design of the fibre optic probe head and the numerical aperture of the read fibre (0.22), the area of the analysed sample was about 1.4 mm2. A 100-µm entrance slit was used in order to obtain a spectral resolution of
5 nm (in combination with the gratings) while keeping sufficient light for the detectors. The analog signal from the spectrometer was stored in a computer via an ADC-1000-ISA A/D converter board with a 12-bit resolution (Avantes, Inc.). The storage and data treatment were implemented using a Windows Microsoft Excel interface DLL-Package (OOIWinIP, Avantes, Inc.).
A set of 165 'Jonagold' apples coming from two different Belgian wholesalers was used for this study. 151 natural surface defects were encountered on 135 apples of this set: 16 scald, 10 limb rub, 22 hail damage without skin perforation, 21 hail damage with skin perforation, 23 rot, 22 frost damage and 37 russet (including several scab tissue defects). Ten sound apples were cut twice to generate 20 visible flesh damages with different
oxidation times (this kind of damage could occur during fruit handling). The rest of the set consisted of 20 sound apples on which two bruises were created: one on the red (blush) side and the other on the green (ground colour) side.
To make bruises in a reproducible way, an experimental device was designed. The principle was to let the fruit drop from a 30 cm height onto a steel plate mounted on a 12 kg mass. The fruit was held by a suction cup and instantly released by stopping airflow using an electrovalve.
2.2. Methods
2.2.1. Experimental protocol
For bruises, the reflectance spectrum of the bruised area before and 1, 5, 10, 20, 30, 60 and 120 min after the bruise creation was recorded. The time intervals were determined in accordance with the speed of chemical reactions, which generally follows logarithmic law. The 120-min limit was laid down by the observations of Ingle and Hyde (1968) who noticed that 50-70% of the browning discoloration was reached 2 h after the impact. For each bruised area, four measurement points were recorded per time interval, each measurement point being the average of three repetitions. In all, 3840 reflectance spectra were recorded for the 40 bruises.
For the other defects, the number of recorded measurement points depended on the size and the occurrence of the defect. Sound tissue points were taken on the sound part of the defective apples, tending to cover the colour variability of the whole set. Each measurement point was the average of three repetitions. Table 1 presents the number of spectra which were acquired for each class of defect and sound tissues.
2.2.2. Data pre-processing
Reflectance spectra of sound and damaged tissues were normalised by comparison with a white Ertalon®
reference, taking into account the dark current of the CCD detectors which were thermally sensitive. Normalised reflectance values (Rnorm) were then defined using the following expression:
where Rraw is the recorded raw reflectance value, D the dark reflectance recorded by turning off the lighting
source and W the reflectance of the white reference.
While the spectrometer was designed to provide data in the wavelength range from 350 to 1200 nm, only data between 400 and 1080 nm were taken into account for the analyses. Outside this range, signal-to-noise ratios were too low, probably due to attenuation of the CCD detector response in these wavelength bands. In the overlap region of the two detectors (650-850 nm), the average value of the two signals was used. Furthermore, since the physical resolution (slit and grating) of the spectrometer was limited to 5 nm, using all the 2048 points supplied by each detector was not relevant. In order to reduce the amount of data to treat, spectra were resampled to 232 points using a moving average centred on nine points.
2.2.3. Individual wavelength analysis
To evaluate the potential of each wavelength for discriminating defects from sound tissues, the Snedecor F-ratio of the group mean square to the residual (within-group) mean square was computed. The between-group mean square is a measurement of the deviations between the means of the different classes and the general mean. The residual mean square is a measurement of the deviations existing inside the groups between the observed values and the mean of the corresponding group. Higher F-ratios indicate that deviations between the groups are significant. Aneshanley et al. (1997) cited by Miller et al. (1998) used a similar approach to discriminate sound tissue from damaged. In their case, the distance between the means of the groups was evaluated with the Mahalanobis distance. F-ratio is the Mahalanobis distance multiplied by a constant proportional to the number of groups and to the sample size (Dagnelie, 1986). F-ratio gives supplementary information about the signification level of the observed difference. Data treatment was carried out with Microsoft Excel 97 Visual Basic (Microsoft Corp.).
Table 1:Number of recorded spectra per class tissue
Class Number of spectra
Green healthy tissue 1284
Red healthy tissue 1467
Scald 231
Hail damage 114
Hail damage with perforation
78
Limb rub 87
Russet + scab tissue 516
Frost damage 207
Rots 465
Visible flesh damage 507
Total 4956
2.2.4. Selection of the most interesting wavelength bands
The main purpose of the study was to select the four most suitable wavelength bands for discriminating defects from sound tissue within the scope of using a multi-spectral imaging system. Since multivariate analysis is not the same as considering a set of independent univariate analyses, like the F-ratio method, a method relating to dependent variates was used. Instead of computing combinations of individual wavelengths for the whole spectra (i.e. by means of neural networks or principal component analysis like that of Miller et al. (1998) and Mehl et al. (2002)) and then selecting the four filters that fit best the weight distributions, all the combinations of four commercially available filters were directly tested. Filters with bandwidths (full-width half maximum) of 50 and 100 nm centred every 50 nm from 450 to 1050 nm were considered. Bandwidths narrower than 50 nm were not considered to have sufficient light for further acquisition of short exposure time images. The filter effect on a camera was approximated by summing the reflectances of all the wavelengths within the filter bandwidth. The shape of the spectral response of the different filters had little influence on the results due to the fact that wavelengths were highly correlated within the considered bandwidths. Since there were 14,950 possible combinations of four filters (26C4), an automated method was set up to evaluate the performance of each
combination for discriminating damaged tissues from sound ones. This method classified data as either sound or damaged tissues for each combination by means of a quadratic discriminant analysis. Discriminant analysis was preferred to neural network methods because, on the one hand, the classification rules are not dependent on a determined training (neural network results are very sensitive to the number of hidden nodes or neural net architecture) and, on the other hand, this statistical method is better at extrapolation than neural networks (Michie, 1994). In discriminant analysis, the distance between each object to classify and the centre of each class is computed. The computed distance is the generalised Mahalanobis distance which takes into account attribute variances and the correlation existing between them. Quadratic discriminant analysis was chosen instead of the linear form because the latter supposes that the populations corresponding to the different classes have the same variance and covariance matrix. A variance equality test showed that, for certain wavelengths, some defect variances were not equal to the healthy one. Therefore, for each filter combination and for each measurement point, two Mahalanobis distances were computed according to the sound and damaged tissue classes. The measurement point was then classified into the nearest class. For each combination, the total correct
classification rate was calculated. The best combination was thus the one with the highest correct classification rate. Since the aim of this study was to find the best combination of filters and not to establish a determined discriminant model, no validation on unknown samples was performed. Therefore, it must be noted that
classification rates presented in Section 3 were only given to compare the different results with each other. They cannot be considered as reliable validation results. However, since the number of considered variables were limited to four and taking into account the number of measurement points (Table 1), the given classification results may be considered as well representative of the efficiency of the group separation. The method was implemented with Matlab version 6.1 (The MathWorks, Inc.).
3. Results and discussion 3.1. Recent bruises
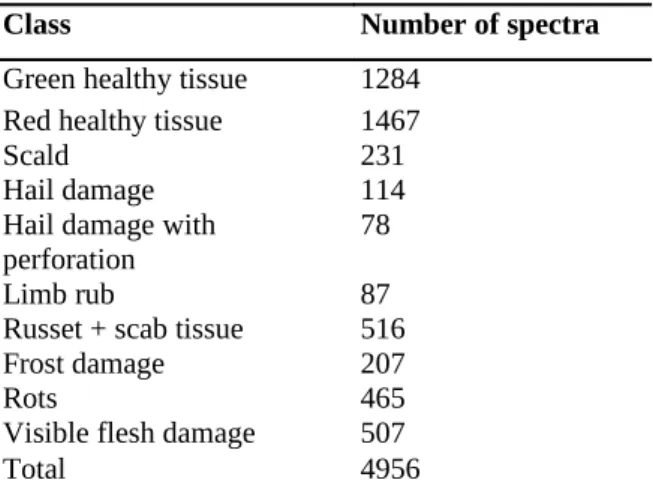
Fig. 1 presents the change in time of the signification level of the difference observed between the reflectances measured before and after the bruise creation for the wavelengths from 400 to 1080 nm. Since the sample sizes of the reflectances measured before and after the bruise creation were the same for each time interval, a theoretical value of the F-ratio was defined: it corresponded to a significance level of 0.1% (Fthr) above which
the observed difference was considered as very highly significant.
All the differences corresponding to the wavelengths above 600 nm (red visible range) were highly significant already 1 min after the bruise creation. An attenuation of the signification level was observed at around 670-680 nm corresponding to the chlorophyll absorption peak. The most significant wavelengths were observed in the near-infrared range from 700 to 920 nm. For this range, the average reflectance difference was 6% after 1 min and 15% after 2 h. Since bruises are internal tissue damage, these observations correspond with those of Lammertyn et al. (2000) who, studying the light penetration properties of NIR radiation in fruit, observed that the light penetration depth in 'Jonagold' apple tissue was the highest in the 700-900 nm range. It can also be noticed that the less significant wavelengths from 500 to 600 nm (green visible range) corresponded to the range where the difference between the ground and blush colours was the highest.
Fig. 1. F-ratio versus wavelength according to the time delay after the bruise creation (Fthr — theoretical
F-ratio).
3.2. Other defects
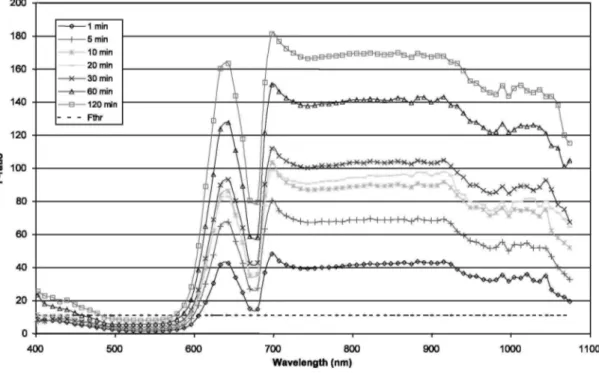
The average reflectance spectra of the defects and sound tissue are presented in Fig. 2 (a 1-h old bruise spectrum was also presented for comparison with other defects). On the basis of these spectra, four large defect categories could be identified: defects which were darker than sound tissue for the whole wavelength range such as rots and recent bruises, defects which were lighter also for the whole range such as scalds and russets, defects which were darker or very similar in the visible range (400-780 nm) and lighter in the NIR range ( > 780 nm) such as hail and frost damage, and finally damage where the flesh was visible which were lighter in the blue (400-500 nm) and green (500-600 nm) visible ranges and darker in the NIR range.
For each of these defect categories, the F-ratios between the average defect and sound tissue spectra were computed. The results are presented in Fig. 3. Some defect categories were well contrasted with the sound tissue in certain wavelength ranges such as visible flesh damage in the blue visible range, limb rubs and rot in the red visible range with an attenuation at around 670-680 nm due to the chlorophyll absorption peak, and scalds, russets and scab tissues in the near-infrared range. Other defects had less contrast for the whole range and therefore were the most difficult defects to detect. This was the case for recent bruises and also for hail and frost damage.
Since there was a lot of information to take into account simultaneously, it was not possible to determine visually, in an objective way, the specifications (centre and bandwidth) of the best filter combination that are able to enhance the detection of all defect categories.
Fig. 2. Average reflectance spectra of the different defect categories and sound tissue.
3.3. Filters selection
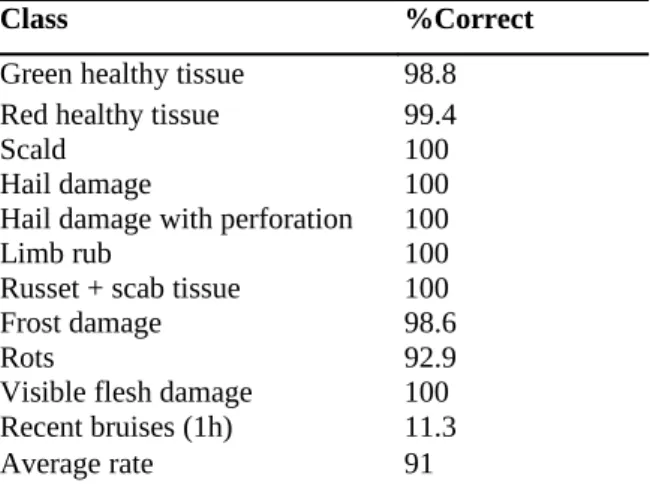
14,950 combinations of four filters with band-widths of 50 and 100 nm centred every 50 nm from 450 to 1050 nm were tested by means of quadratic discriminant analysis. Table 2 presents the classification test results of the best combination formed by the four filters centred at 450, 500, 750 and 800 nm and having respectively a bandwidth of 100, 50, 100 and 50 nm. Most of the correct classification rates were very satisfactory except for the 1-h old bruises (results for 2-h old bruises were not significantly better; correct classification rate = 11.9%). The errors committed on rot and frost damage had relatively low consequences. They belonged to defects for which other measurement points were correctly classified. These defects were therefore partially detected. Moreover, well-suited image analysis algorithms should reduce apple misclassification. In the same way, the misclassifi-cation of some healthy tissue points should also be compensated by image analysis algorithms. It was difficult to segment recent bruises in one step, considering all the other defects. A classification test performed only between sound and bruised tissues showed that 73% of the sound tissue and 83% of the bruised tissue were correctly classified.
Table 2: Correct classification rates for the best combination of four computed filters: 450/100, 500/50, 750/100 and 800/50 (xly: x = centre in nm and y — FWHM in nm)
Class %Correct
Green healthy tissue 98.8
Red healthy tissue 99.4
Scald 100
Hail damage 100
Hail damage with perforation 100
Limb rub 100
Russet + scab tissue 100
Frost damage 98.6
Rots 92.9
Visible flesh damage 100
Recent bruises (1h) 11.3
Average rate 91
On the other hand, since it was observed that there was already a very highly significant difference before and after the bruise creation after 1 min in the 700-920 nm range, it should also be possible to enhance bruise detection with the two filters centred at 750 and 800 nm by means of an image segmentation method based on local contrast variations rather than using a predefined threshold. Thus, the sorting of fruit could be conducted using a hierarchical segmentation method. This would consist first in segmenting all the defects (without considering the recent bruises) with the selected filters and then identifying bruised tissues within the healthy tissue by means of dedicated image analysis algorithms.
In order to know if it was imperative to use four filters for detecting defects on 'Jonagold' apples, the best combination of three filters was also computed and evaluated. The results showed that this combination included three filters of the best combination of four filters. Those were the filters centred at 450, 750 and 800 nm. Table 3 shows that there was no significant difference between results of the best combination of three and of four filters. It was thus possible to detect the defects using only three filters. However, within the scope of performing the complete automation of 'Jonagold' apple sorting, the best combination of four filters was more suited to quantify the ratio between the blush and ground colour which was not evident without the use of the filter centred at 500 nm.
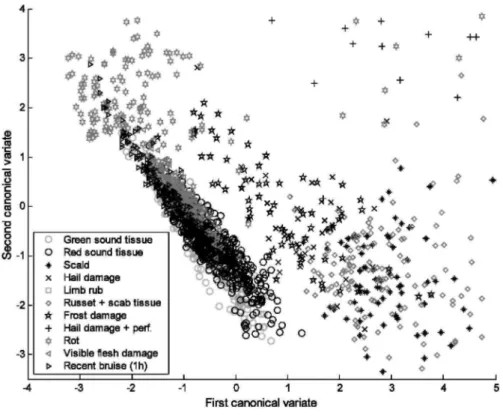
In order to analyse the contributions of the different filters for separating defects from sound tissue, Figs. 4a and b present respectively the scatter diagram of the filters centred at 500 and 800 nm, and 750 and 800 nm. It can be noted in Fig. 4a that defects which were the best separated from the sound tissue, such as visible flesh damage, rot, limb rub, scald and russet, were those that had the highest absolute signification levels in Fig. 3. Recent bruises, frost damage and hail damage, that presented the lowest absolute signification levels, were merged with the sound tissue. Fig. 4a also shows the contribution of the filter centred at 500 nm for discriminating blush and ground colours. Indeed, green and red tissue points were relatively well separated according to this axis. With
regards to Fig. 4b, the information provided by the two filters centred in the NIR range did not seem useful due to their high correlation. However, to better understand their contribution in discriminating defects from sound tissue, the first and second canonical variates were computed in order to represent the information provided by these two filters in an uncorrelated space that had the largest separation between groups. Fig. 5 presents the scatter diagram of these two canonical variates. It appeared thus that the two filters were well suited to separate frost and hail damage from the healthy tissue which was clearly more difficult with the other filter combinations.
3.4. Validation of the method with real interference filters
For further image acquisition, four interference filters with the computed specifications were acquired. Since it was not possible to obtain filters with those exact specifications, the purchased interference filters were centred at 450, 500, 750 and 800 nm with respectively a bandwidth of 80, 40, 80 and 50 nm. To validate the method to find the best combination of four filters, the spectral transmission curves of the selected filters (Fig. 6) were digitised by placing the filter between the light source output and the entrance of the illumination fibre optic. Recording the spectral data of the white reference illuminated with (Rraw) and without (W) the filter and using Eq.
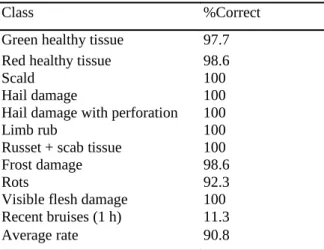
(1), the transmission curve of the filter was computed. The effect of applying a filter on a camera was achieved by computing the sum of the products of the spectral reflectance of the measurement point and the transmission curve of the filter. Results of the classification test with the data filtered with the real transmission curve of the chosen filters are presented in Table 4. These results were not significantly different from those obtained with the theoretical method (Table 2). It could be thus assumed that the proposed method was sufficiently robust to choose real interference filters for multi-spectral vision system.
Table 3: Correct classification rates for the best combination of three computed filters: 450/100, 750/100 and 800/50 (xly: x = centre in nm and y — FWHM in nm)
Class %Correct
Green healthy tissue 97.4
Red healthy tissue 99
Scald 100
Hail damage 100
Hail damage with perforation 100
Limb rub 100
Russet + scab tissue 100
Frost damage 98.6
Rots 91
Visible flesh damage 100
Recent bruises (1 h) 9.4
Average rate 90.5
Table 4: Correct classification rates for the combination of the four real interference filters: 450/80, 500/40, 750/80 and 800/50 (xly: x = centre in nm and y — FWHM in ran)
Class %Correct
Green healthy tissue 97.7
Red healthy tissue 98.6
Scald 100
Hail damage 100
Hail damage with perforation 100
Limb rub 100
Russet + scab tissue 100
Frost damage 98.6
Rots 92.3
Visible flesh damage 100
Recent bruises (1 h) 11.3
Fig. 5. Scatter diagram of the first and second canonical variates of the filters centred at 750 and 800 nm.
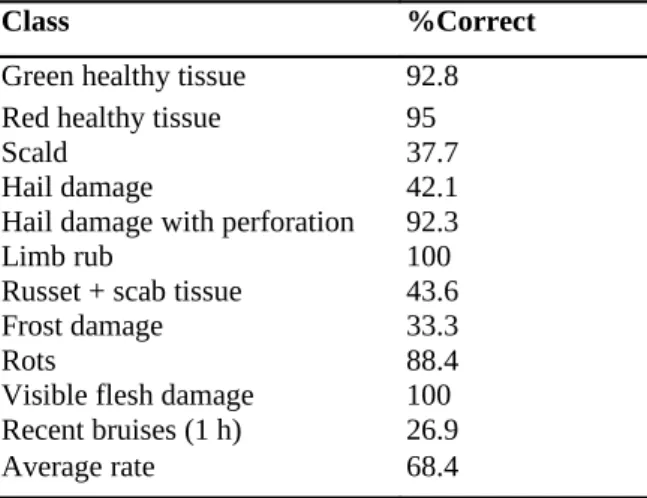
Table 5: Correct classification rates for the modelled filters of a standard 3-CCD RGB camera
Class %Correct
Green healthy tissue 92.8
Red healthy tissue 95
Scald 37.7
Hail damage 42.1
Hail damage with perforation 92.3
Limb rub 100
Russet + scab tissue 43.6
Frost damage 33.3
Rots 88.4
Visible flesh damage 100
Recent bruises (1 h) 26.9
Average rate 68.4
3.5. Comparison with a standard colour camera
Finally to confirm the relevance of using a dedicated imaging system for detecting defects on 'Jonagold' apples, a classification test was performed on the data set using the filter models of a standard 3-CCD RGB camera (Sony XC003P) which was used in a previous study (Leemans et al., 1999). Table 5 presents the results of this test. Like the observations of Leemans et al. (1999), discrimination of russets and scab tissue was not efficient with this standard colour camera. Moreover, defects which had visually less contrast with the sound tissue, like scald, and hail and frost damage, were also poorly discriminated. The dedicated solution was thus relevant.
4. Conclusion
An objective method was set up to select the most suited wavelength bands to sort 'Jonagold' apples. Detection of most of the 'Jonagold' apple defects can be enhanced using three specific wavelength bands. However, a fourth filter is necessary for the complete sorting automation to quantify the ratio between blush and ground colour. With regard to recent bruises, it appeared that the reflectance difference before and after the bruise creation was already very highly significant within a minute of impact. Nevertheless, image segmentation algorithms based on local contrast variations should be considered when attempting to detect them on the whole apple. Further research will involve image acquisition with the selected filters and image processing in order to validate the suggested image segmentation methods.
Acknowledgements
This research is funded by the General Direction of Technology, Research and Energy of the Walloon Region (Belgium). Convention No. 9813783.
References
Aneshanley, D.J., Throop, J.A., Upchurch, B.L., 1997. Reflectance spectra of surface defects for apples. In: Salius, M. (Ed.), Sensors for Nondestructive Testing, Measuring the Quality of Fresh Fruits and Vegetables, NRAES-97. NRAES, Ithaca, NY, pp. 143-160.
Anonymous, 2001. Commission Regulation (EC) No. 1619/ 2001 of 6 August 2001 laying down the marketing standard for apples and pears. Official Journal L 215, 09/08/2001, 0003-0016.
Chao, K., Chen, Y.R., Hruschka, W.R., Park, B., 2001. Chicken heart disease characterization by multi-spectral imaging. Appl. Eng. Agric. 17, 99-106.
Dagnelie, P., 1986. Analyse Statistique à Plusieurs Variables. Presses Agronomiques de Gembloux, Gembloux.
Geoola, F., Geoola, F., Peiper, U.M., 1994. A spectrophoto-metric method for detecting surface bruises on "Golden Delicious" apples. J. Agric. Eng. Res. 58, 47-51.
Ingle, M., Hyde, J.F., 1968. The effect of bruising on discoloration and concentration of phenolic compounds in apple tissue. Proc. Am. Soc. Hort. Sci. 93, 738.
Lammertyn, J., Peirs, A., De Baerdemaeker, J., Nicolai, B., 2000. Light penetration properties of NIR radiation in fruit with respect to non-destructive quality assessment. Post-harvest Biol. Technol. 18, 121-132.
Leemans, V., Magein, H., Destain, M.-F., 1999. Defect segmentation on 'Jonagold' apples using colour vision and a Bayesian classification method. Comput. Electron. Agric. 23,43-53.
Mehl, P.M., Chao, K., Kim, M., Chen, Y.R., 2002. Detection of defects on selected apple cultivars using hyperspectral and multispectral image analysis. Appl. Eng. Agric. 18, 219-226.
Michie, D., 1994. Machine Learning, Neural and Statistical Classification. Ellis Horwood, Chichester, UK.
Miller, W.M., Throop, J.A., Upchurch, B.L., 1998. Pattern recognition models for spectral reflectance evaluation of apple blemishes. Postharvest Biol. Technol. 14, 11-20.
Upchurch, B.L., Affeldt, H.A., Hruschka, W.R., Norris, K.H., Throop, J.A., 1988. Spectrophotometric study of bruises on whole red delicious apples. ASAE, Paper No. 88-6566. ASAE, St. Joseph, MI.
Wen, Z., Tao, Y., 1998. Fuzzy-based determination of model and parameters of dual-wavelength vision system for on-line apple sorting. Opt. Eng. 37, 293-299.
Wen, Z., Tao, Y., 1999. Building a rule-based machine-vision system for defect inspection on apple sorting and packing lines. Expert Syst. Appl. 16, 307-313.