Behaviour of single sided composite joints at room temperature and in case of fire after an earthquake
Texte intégral
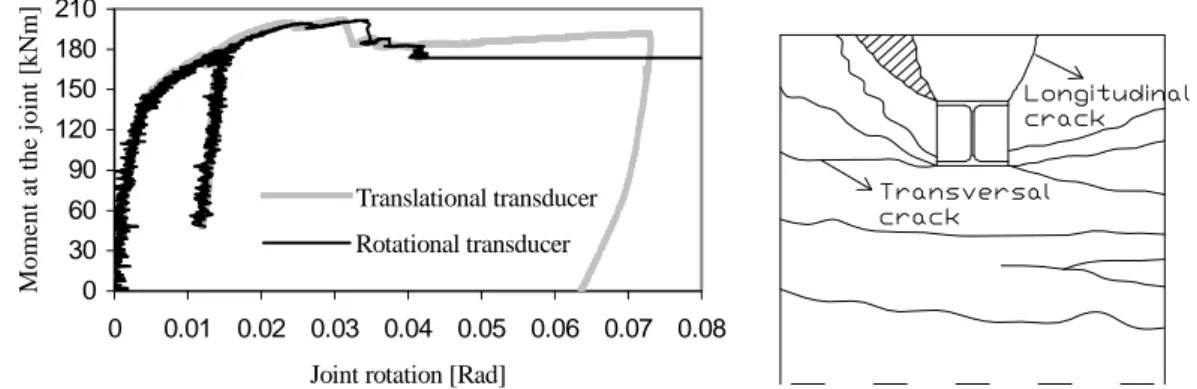
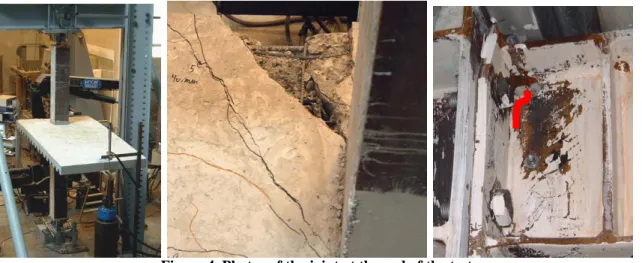
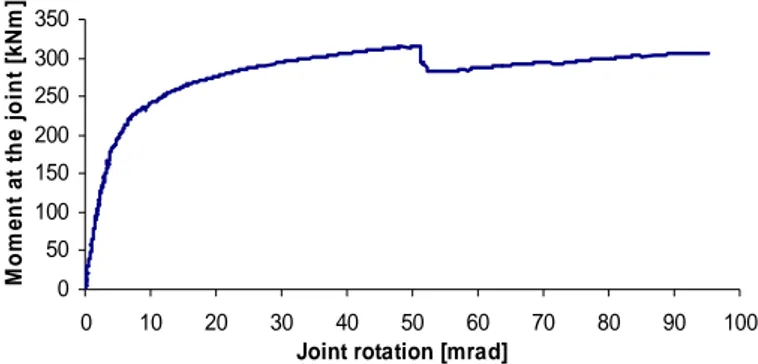
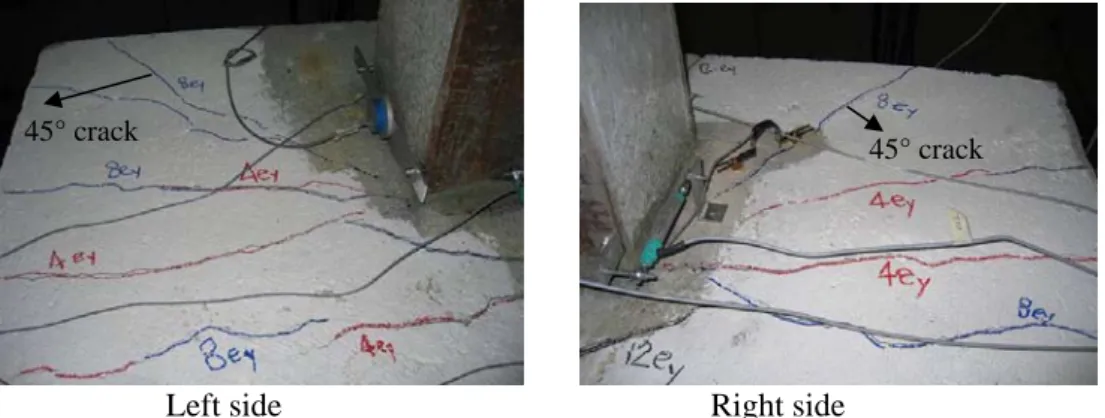
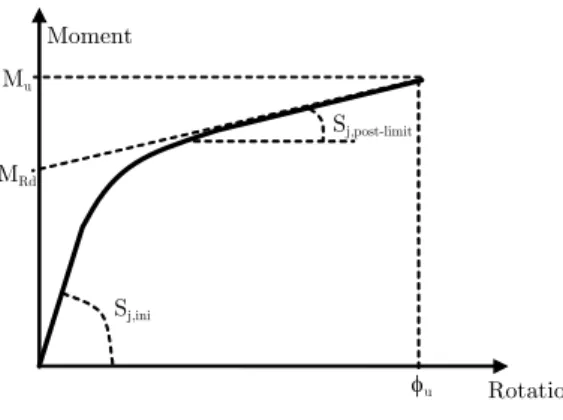
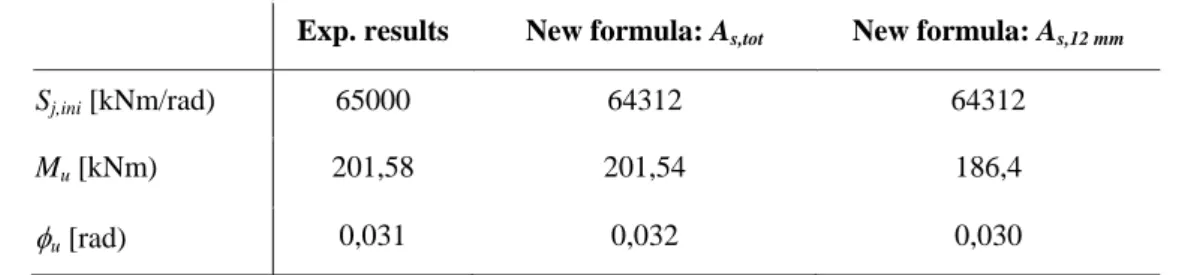
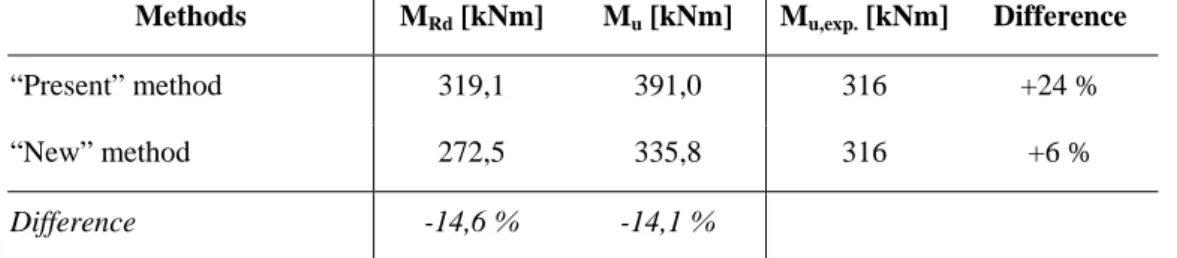
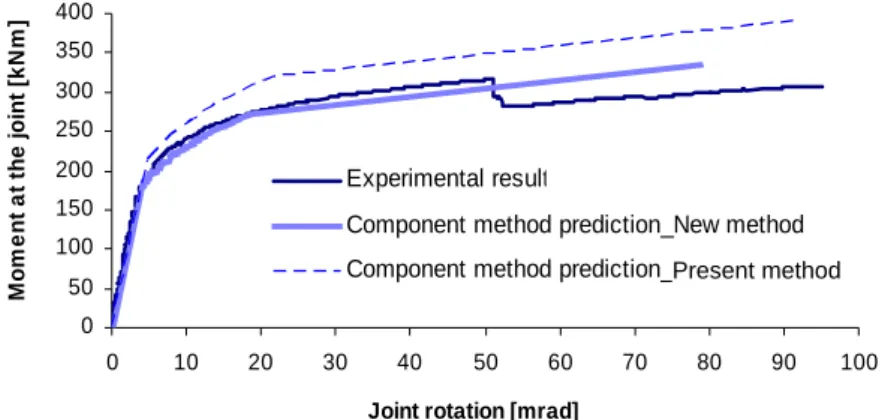
Figure


Documents relatifs
Turkey pointed out that the second paragraph of the preamble and Article 2.1 of the Convention for the Safeguarding Intangible Cultural Heritage, and
UN Secretary-General warned leaders not to come to his landmark Climate Action Summit with beautiful speeches, but to present concrete plans for cutting harmful greenhouse
L’étude Foodbook vient combler de vastes lacunes en matière de données sur l’exposition des Canadiens aux aliments, à l’eau et aux animaux aux fins d’enquête et de lutte
This article is concerned with the constitution of childbirth pain in biomed- ical settings in Portugal, and draws on both primary research in the obstetric ward of Hospital de
In# 1977,# poetry# was# still# writing# and# reading.# While# some# performance# artists# were#. experimenting# with# poetry# at# alternative# galleries# and# performance# spaces,#
The objective of this study is to experimentally measure adhesion strength between ice and concrete with various applied pressure and contact duration time under constant
Designers who serve as specialists and experts in the development of online instructional materials will need access to educational opportunities that focus on instructional
Model performance was measured using the relative absolute error (RAE) between observed and predicted rates of emerging alien species. Size of bubbles and colours indicate the
