HAL Id: pastel-00002742
https://pastel.archives-ouvertes.fr/pastel-00002742
Submitted on 17 Jan 2008HAL is a multi-disciplinary open access
archive for the deposit and dissemination of sci-entific research documents, whether they are pub-lished or not. The documents may come from teaching and research institutions in France or abroad, or from public or private research centers.
L’archive ouverte pluridisciplinaire HAL, est destinée au dépôt et à la diffusion de documents scientifiques de niveau recherche, publiés ou non, émanant des établissements d’enseignement et de recherche français ou étrangers, des laboratoires publics ou privés.
pour l’amélioration du diagnostic et de la maintenance
Johan Wiig
To cite this version:
Johan Wiig. Optimisation du système de surveillance des hélicoptères pour l’amélioration du diag-nostic et de la maintenance. Informatique [cs]. Arts et Métiers ParisTech, 2006. Français. �NNT : 2006ENAM0055�. �pastel-00002742�
N°: 2006 ENAM 55
Ecole doctorale n° 432 : Sciences des Métiers de l’Ingénieur
T H È S E
pour obtenir le grade de
Docteur
de
l’École Nationale Supérieure d'Arts et Métiers
Jury :
Sylviane GENTIL, Professeur, INPG / ENSIEG, Grenoble ...Rapporteur
Dominique SAUTER, Professeur, Université Henri Poincaré, Nancy I ...Rapporteur
Pierre-Antoine AUBOURG, Ingénieur, Chef de service, Eurocopter ...Invité
Daniel BRUN-PICARD, Professeur, ENSAM, Aix en Provence ...Examinateur
Mathieu GLADE, Docteur, Chef d’équipe, Eurocopter ...Examinateur
Hassan NOURA, Professeur, Université Paul Cézanne, Aix-Marseille III ...Examinateur
Mustapha OULADSINE, Professeur, Université Paul Cézanne, Aix-Marseille III ...Examinateur
Michel VERGÉ, Professeur, ENSAM, Paris ...Examinateur
Laboratoire des Sciences de l’Information et des Systèmes
LSIS – UMR CNRS 6168
L’ENSAM est un Grand Etablissement dépendant du Ministère de l’Education Nationale, composé de huit centres : AIX-EN-PROVENCE ANGERS BORDEAUX CHÂLONS-EN-CHAMPAGNE CLUNY LILLE METZ PARIS
Spécialité “Automatique”
présentée et soutenue publiquement par
Johan WIIG
le 11 décembre 2006
OPTIMIZATION OF FAULT DIAGNOSIS IN HELICOPTER
HEALTH AND USAGE MONITORING SYSTEMS
Directeur de thèse : Daniel BRUN-PICARD Codirecteur de thèse : Hassan NOURA
Acknowledgments
This study has been realized at Laboratoire des Sciences de l’Information et des Systèmes (UMR CNRS 6168) and Ecole Nationale Supérieure des Arts et Métiers. The subject and industrial context was provided by Eurocopter, with funding through the Marie Curie Host Fellowship.
First and foremost I would like to thank my advisors Daniel BRUN-PICARD, professor at LSIS, ENSAM, Aix en Provence, and Hassan NOURA, professor at LSIS, Université Paul Cézanne, Marseille.
Further, I would like to thank :
Sylviane GENTIL, professor at INPG, ENSIEG, Grenoble, and Domu-nique SAUTER, professor at Université Henri Poincaré, Nancy, for accepting to participate as reporters on the jury, as well as for their remarks and sug-gestions to my manuscript.
Michel VERGÉ, professor at ENSAM, Paris, for accepting to participate as examinator on the jury, as well as for his remarks and suggestions to my manuscript.
Pierre-Antoine AUBOURG at Eurocopter for accepting to participate on the jury, and for validating the industrial aspects of my work.
Mathieu GLADE at Eurocopter for accepting to participate as examina-tor on the jury, and for supporting me through the final year of my study.
Mustapha OULADSINE, professor at LSIS, Université Paul Cézanne, Marseille, for accepting to participate as examinator on the jury.
Luc DAURES, Tran BANG, Philippe JOLY, Cecile ALEXANDRE, Jean-Charles ANIFRANI and Jean-Pierre DERAIN at Eurocopter for their help and support.
Finally, I would like to thank my family and friends, as well as everyone else concerned at LSIS, ENSAM and Eurocopter, for their help and support in the completion of this study.
Contents
1 Introduction 11 2 Problem Statement 13 2.1 Background . . . 13 2.1.1 History . . . 13 2.1.2 Motivations . . . 14 2.1.3 Regulatory Definition . . . 162.2 Rotorcraft Failure Modes . . . 17
2.2.1 Engines . . . 17
2.2.2 Transmission System . . . 18
2.2.3 Rotors . . . 19
2.3 Health and Usage Monitoring Tasks . . . 20
2.3.1 Sensors and Acquisition Procedures . . . 21
2.3.2 Usage Monitoring . . . 25
2.3.3 Health Monitoring . . . 26
2.4 Impact of Current Technology . . . 27
2.4.1 Reliability . . . 27
2.4.2 Safety . . . 28
2.4.3 Maintenance Credit . . . 29
2.5 Objectives . . . 30
3 Current and Emerging Technologies 33 3.1 Introduction . . . 33
3.2 Data Validation and Correction . . . 34
3.2.1 Correction of Speed Variations . . . 35
3.2.2 General Contextual Correction . . . 36
3.2.3 Epicyclic Frequency Separation . . . 36
3.3 Feature Extraction . . . 37
3.3.1 Condition Indicators . . . 37
3.3.2 Stationarity Indicators . . . 42
3.3.3 Modeling . . . 42 5
3.4 Classification . . . 43
3.4.1 Threshold Testing . . . 43
3.4.2 Clustering . . . 45
3.4.3 Feedforward Networks and Fuzzy Logic . . . 46
3.4.4 Prognosis . . . 46
3.5 Commercial Solutions . . . 47
3.5.1 IHUMS . . . 47
3.5.2 North Sea HUMS . . . 47
3.5.3 EuroHUMS . . . 48
3.5.4 GenHUMS . . . 48
3.5.5 IMD HUMS . . . 48
3.5.6 T-HUMS . . . 49
3.6 M’ARMS and EuroARMS . . . 49
3.6.1 Airborne Segment . . . 49 3.6.2 Ground Segment . . . 50 3.6.3 Decision Flow . . . 52 3.6.4 Improvement Potential . . . 52 3.7 Axis of Research . . . 57 4 Data Migration 59 4.1 Introduction . . . 59 4.2 Analysis Process . . . 59 4.3 Architectural Layers . . . 61 4.4 Common Storage . . . 62 4.5 Discrepancy Reporting . . . 63 4.6 Benefits . . . 64 4.7 Conclusion . . . 65 5 Data Correction 67 5.1 Introduction . . . 67 5.2 Modeling . . . 68 5.3 Indicator Correction . . . 69 5.4 Signal Correction . . . 72 5.5 Conclusion . . . 77 6 Feature Extraction 79 6.1 Introduction . . . 79 6.2 Progression Analysis . . . 79
6.2.1 Basic Progression Types . . . 80
6.2.2 Progression Modeling . . . 82
CONTENTS 7
6.3.1 Segmentation . . . 90
6.3.2 Segment Concatenation . . . 90
6.3.3 Trend Analysis . . . 91
6.4 Sigmoid Progression Analysis . . . 93
6.4.1 Sigmoid Series . . . 94
6.4.2 Estimation Methods . . . 95
6.4.3 Trend Analysis . . . 101
6.5 Non-Parametric Progression Analysis . . . 103
6.5.1 Outlier Separation . . . 103
6.5.2 Edge Separation . . . 104
6.5.3 Random Noise Separation . . . 105
6.5.4 Trend Analysis . . . 107
6.6 Calibration . . . 109
6.6.1 Linear Progression Analysis . . . 110
6.6.2 Sigmoid Progression Analysis . . . 110
6.6.3 Non-Parametric Progression Analysis . . . 111
6.7 Conclusion . . . 112 7 Fault Detection 115 7.1 Introduction . . . 115 7.2 Classification . . . 115 7.3 Performance . . . 118 7.4 Conclusion . . . 125 8 Conclusion 127 8.1 General . . . 127 8.2 User Friendliness . . . 127 8.3 Reliability . . . 128 8.4 Forward Perspectives . . . 129 A Mathematical Notations 131 A.1 Moving Median . . . 131
A.2 Windowed RMS . . . 131
A.3 Wavelets . . . 131
A.3.1 Continuous Wavelet Transform . . . 132
A.3.2 Discrete Wavelet Transform . . . 132
A.3.3 Stationary Wavelet Transform . . . 133
A.4 Nonlinear Optimization . . . 134
A.4.1 Trust Region . . . 134
A.4.2 Evolutionary Optimization . . . 135
B IT Notations 139
B.1 Databases . . . 139
B.2 Object Oriented Programming . . . 140
B.2.1 Interface Programming . . . 140
B.2.2 Java . . . 141
B.2.3 Component Object Model . . . 141
Acronyms
ARMS Aircraft Recording and Monitoring System CAA Civil Aviation Authority (UK)
CBM Condition Based Maintenance CG Center of Gravity
COTS Commercial Off The Shelf CVR Cockpit Voice Reorder DFT Discrete Fourier Transform
EuroARMS Eurocopter Aircraft Recording and Monitoring System EVM Engine Vibration Monitoring
FAA Federal Aviation Authority (USA) FDR Flight Data Recorder
HARP Helicopter Airworthiness Requirements Panel HUMS Health and Usage Monitoring System
IAS Indicated Airspeed IGB Intermediate Gear Box IT Information Technology KTS Knots
LPC Linear Predictive Coding LCC Life Cycle Cost
MARMS Modular Aircraft Recording and Monitoring System MGB Main Gear Box
MMH/FH Mean Man Hours / Flight Hours (maintenance) MTBF Mean Time Between Failure
NF Engine turbine speed NG Engine generator speed
OEM Original Equipment Manufacturer PAC Power Assurance Check
RTB Rotor Track and Balance SHL Steward Hughes Limited TBM Time Based Maintenance TBO Time Between Overhaul TDS Tail Drive Shaft
TGB Tail Gear Box
VMS Vibration Monitoring System VPN Virtual Private Network
Chapter 1
Introduction
Increasing demand for both reduced rotorcraft maintenance cost and im-proved operational safety has paved the way for the Health and usage Mon-itoring System (HUMS). These systems emerged in the early nineties as a response to the relatively high accident rate experienced by offshore shuttle helicopters trafficking the petrol installations in the North Sea. However, it soon became clear that these systems, in addition to reducing accident rates, had a potential for maintenance cost reduction. Research and development into HUMS technologies over the years has kept a focus on both aspects by working toward better safety. At the same time, efforts have been made to exploit the increased situation awareness given by the HUMS in order to help the operators better organize their maintenance tasks.
A HUMS deploys both proactive and reactive methods to anticipate drive-train failure. Proactive methods include usage spectrum analysis such as load cycle calculation, allowing remaining component safe life to be estimated based on the actual stress a component has been under for the duration of its service. The reactive approach is based on detecting propagating component failure at an early stage, before seizure occurs. This method relies on a sensor network covering engines and transmission system. For the current generation HUMS, this sensor network is mainly limited to vibration sensors and angular shaft speed sensors.
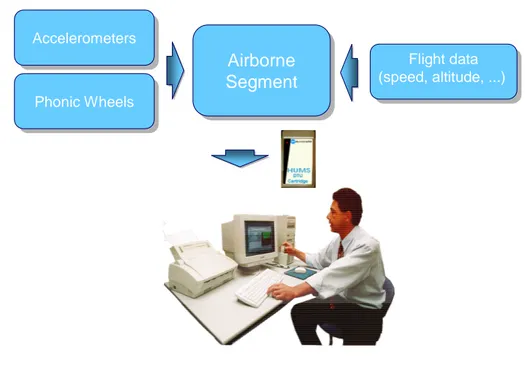
During operation, the HUMS airborne segment gathers data from its sensor network. Some HUMS performs diagnosis real time in flight, providing the pilots with instant warning of any suspected problems. However, most HUMS perform diagnosis and reporting between flights. This is achieved by transferring the data, by means of a data cartridge, to a stationary computer. The stationary computer, known as a ground station, analyzes the recorded data and produces a discrepancy report for the maintenance crew.
This study is concerned with methods to interpret the vibratory data as 11
accurately as possible. The motivation for this is twofold; increased safety and reduced maintenance cost. By improving the detection capabilities of the system, the risk of in-flight mechanical failure is reduced. As a rotorcraft drive-train is largely non-redundant, failure can have serious consequences. Further, all HUMS, like any automated fault detection system, are prone to produce unjustified alerts from time to time. This has implications both on the operational availability as well as on the maintenance cost of the ro-torcraft, as false alarms often results in unnecessary aircraft grounding and maintenance. The methods described in this study are designed to produce vibration-base diagnosis accurately as possible, so that the fault detection rate is maximized and the false alarm rate minimized. An additional objec-tive is removing any aircraft specific configuration of the HUMS. The need for configuring, or training, the HUMS for each aircraft, and retrain it after major overhauls, is a weak-spot on most commercial HUMS. This imposes a significant workload on the operator, and renders the HUMS vulnerable miss-training. Both of which detract from the system’s usefulness by increased operating cost and reduced fault detection capabilities.
This report is organized in 8 chapters. Chapter 1 contains the general introduction to the subject. More detail on HUMS is given in chapter 2, with chapter 3 detailing the state of the art for the technologies deployed in a HUMS. Practical issues concerning data transfer and storage are elabo-rated in chapter 4. Chapter 5 treats validation and pre-processing of HUMS vibration data. New methods for feature extraction are developed in chapter 6, and fault detection in chapter 7. Finally, concluding remarks are presented in chapter 8. In order to keep the report as brief and clear as possible, details on mathematical tools are kept in the appendixes.
Chapter 2
Problem Statement
2.1
Background
2.1.1
History
The history of Health and Usage Monitoring System (HUMS) dates back as far as the mid eighties. At this time, it became clear that helicopters operated in the North Sea where overrepresented in the accident statistics, compared to equal size turbo prop airplanes. The UK Civil Aviation Au-thority (UK) (CAA) Helicopter Airworthiness Requirements Panel (HARP) submitted a report in 1986, concluding that the risk level in North Sea he-licopter operations were above what could be seen as acceptable [47]. To improve rotorcraft airworthiness, several steps were recommended. Among them was the permanent installation of vibration monitoring equipment.
Vibration monitoring of mechanical systems was at the time already an established technology. Although not previously tested on aircraft, such tech-niques had already proven their effectiveness in condition monitoring of in-dustrial machinery, such as paper mills and power plants. However, it was not until the eighties that the size and weight of the necessary numeric hardware were in such a manner that it could be fitted on a helicopter.
By the end of the eighties, two parallel trials were under way. Motivated by the HARP report, and largely sponsored by the petroleum industry, these programs aimed at testing the concept of in-flight vibration monitoring. One of the programs was led by Steward Hughes Limited (SHL) / Teledyne, the other by Meggitt Avionics. The purpose of the trials was however more to create a proof of concept, than refining diagnosis algorithms. By the time the trials ended in 1991, the technology was, however promising, still regarded as immature.
In 1990, CAA issued new regulations making Flight Data Recorders 13
(FDRs) mandatory in helicopters operating in hostile environments. The avionics manufacturers participating in the HUMS trials saw this as an op-portunity to introduce their newly developed technology to the market. With the operators’ and the petroleum industry’s increasing interest in the tech-nology, creating combined FDR / Cockpit Voice Reorder (CVR) / HUMS systems had obvious competitive advantages. Thus, two FDR / CVR / HUMS systems were put on the market; SHL’s North Sea HUMS and Meg-gitt Avionics’ IHUMS.
Al though not mandatory by law, the oil companies’ great interest in these systems made them an important burgeoning point when negotiating service contracts with the rotorcraft operators. As a result, HUMS quickly became a reality for all operators involved in offshore flight, on both sides of the North Sea. In 1999, the CAA issued regulations making HUMS mandatory for all heavy rotorcraft registered in the UK.
2.1.2
Motivations
As already mentioned, the initial motivation for introducing vibration mon-itoring in helicopters was safety. However, it soon became clear that a tool capable of describing the actual condition of critical components had consid-erable potential in maintenance planning and cost reduction.
Aircraft maintenance workload is normally measured in Mean Man Hours / Flight Hours (maintenance) (MMH/FH). Maintenance workload is highly dependent on aircraft size and type, and can be found anywhere from less than one hour to several hours per flight hour. Compared to equal size turbo prop airplanes, even the most economical rotorcrafts have very high operating cost due to maintenance. In fact, around 25% of the total life cycle cost (LCC) for most helicopters is maintenance, equivalent to the acquisition cost.
Maintenance can be divided in two main categories: Condition Based Maintenance (CBM), and Time Based Maintenance (TBM). CBM represents the maintenance tasks which are generated as a result of faults uncovered during inspections, faults uncovered by HUMS, and operational irregularities, such as torque limit overshoots or rotor over-speeds. TBM, on the other hand, is performed at various fixed intervals. Some are just a few hours apart, or even between each flight. This is the tedious day-to-day work of inspections, to ensure that the aircraft is in an airworthy condition.
The TBM workload is very high on rotorcraft compared to most other vehicles, and is one of the main cost drivers in helicopter operations. This is due to the large amount of moving parts in the helicopter transmission system, as well as the lack of redundancy in the power path from engine
2.1. BACKGROUND 15 to rotor. Because of the lack of redundancy, several failure modes in the helicopter transmission system can be catastrophic. To minimize risk, very strict and expensive maintenance routines must be followed in rotorcraft TBM.
Every component on a helicopter has a safe life limit. Upon reaching this age, the component must be overhauled. The safe life limit of each component is derived from an expected usage spectrum of the aircraft, and then given a substantial margin. Consequently, most retired parts are in a perfectly good condition. However, if an aircraft is exposed to higher loads than what was anticipated when the maintenance schedules where created, components might be exposed to more stress than they where design to handle (Fig. 2.1).
Wear
Safe Life Limit
Time Component Retirement Expected Envelope Unused Potential Danger Possible Envelopes
Figure 2.1: HUMS Overview
Most of the inspections and overhauls performed as TBM are unneces-sary, in the sense that maintenance is performed on helicopters which are in a perfectly airworthy condition. This is however the proactive nature of TBM, if one is to ensure that the possibility of mechanical failure is mini-mized. Obviously, helicopter operating costs could be decreased dramatically if one were to perform maintenance only "on condition" (CBM), whenever a failure occurs. However, performing corrective maintenance after a fault has occurred will in most cases pose an unacceptable safety risk.
This is, of course, unless one has a reliable way, other than manual inspec-tion, to detect a propagating fault before it becomes critical. HUMS was, and still is, regarded as the answer to this problem. In addition to increase safety, HUMS was seen as the technology that would revolutionize rotorcraft maintenance, and shift rotorcraft maintenance strategy from TBM to CBM. For various reasons, these ambitions have so far not been reached.
2.1.3
Regulatory Definition
The only formal definition of HUMS is maintained by the UK CAA, as the UK is still the only country where HUMS is mandatory. HUMS is mandatory for helicopters in the following category:
United Kingdom registered helicopters issued with a Certificate of Airworthiness in the Transport Category (Passenger), which have a maximum approved seating configuration of more than 9 passengers.
In reality, HUMS is demanded on all offshore flights by the petroleum companies operating in the North Sea. Consequently, HUMS becomes a requirement for heavy helicopters operating in both British and Norwegian sector.
The CAA definition divides HUMS in two main subsystems; a Vibration Monitoring System (VMS), and "existing established techniques". The latter part covers functions such as temperature- and torque monitoring, magnetic plugs and chip detectors, thus corresponding to the Usage Monitoring System (UMS) of HUMS. It is worth noting that these functions are mandatory on all helicopters, regardless of whether a HUMS is installed or not. In case no HUMS is installed, these functions are maintained by other systems.
The VMS addresses the Health aspect of HUMS. The definition applies to all rotorcraft, and is thus not very precise. The CAA directive [1] reads as follows
Vibration monitoring System (VMS) should monitor : • Engine to main gearbox input drive shafts
• Main gearbox shafts, gears and bearings • Accessory gears, shafts and bearings • Tail rotor drive shafts and hanger bearings
• Intermediate and tail gearbox gears, shafts and bearings • Oil cooler drive
• Main and tail rotor track and balance
Further, the HUMS Minimum Equipment List (MEL) states that Depending upon system installation, if the data analysis (or fail-ure indication system) indicate a malfunction of any system or
2.2. ROTORCRAFT FAILURE MODES 17 sensor, i.e. accelerometer, then the maximum period that the item or system can be deemed unserviceable would be as follows: (1) 25 flying hours
However, if the specific item has been under investigation due to adverse trend identified by the HUM system, the maximum period of unserviceability would be as follows:
(2) 10 flying hours
2.2
Rotorcraft Failure Modes
The transmission system of a heavy rotorcraft is highly complex, and has a high number of possible failure modes. Failure scenarios are typically com-plex, in the sense that one propagating fault tends to trigger other failures. This is especially the case for gearboxes. Still, it is possible to distinguish some classical fault types, and their symptoms.
2.2.1
Engines
Helicopter jet engines consist of two stages. The first stage includes com-pressor, combustion chamber and turbine, and resembles the design of a traditional fixed-wing engine. This assembly is followed by the second stage, which is an additional turbine. The second stage delivers power from the engine to the transmission system.
Engine Compressor and Turbine Unbalance
Engine turbines and compressors rotate at very high speeds, and must be per-fectly balanced. Problems like disk cracks, blade cracks and broken blades typically produce unbalanced rotation, and are uncovered by monitoring vi-bration energy at the frequencies corresponding to the compressor and tur-bine rotating speeds.
Engine Power Degradation
Engine performance is gradually degraded throughout the lifetime of the engine. Performance must however not be allowed to drop below a certain minimum threshold. The potential of an engine is determined by measuring which engine temperature is required to sustain a given torque.
2.2.2
Transmission System
The helicopter transmission system is a set of shafts and gearboxes which receives the power from the engines, and forwards it to the rotors as well as equipment such as cooling fans, hydraulic pumps and power generators. Helicopter transmission systems are characterized by high exchange rates, high power and low weight, making it critical high-precision machinery. Shaft Unbalance
Unbalanced rotation is caused by bent or otherwise damaged shafts. This fault types is especially critical for the high speed shafts between the engines and the main gearbox, due to the amount of force generated by even slight unbalance. Shaft unbalance is easily detectable by measuring the energy corresponding to the shaft rotating speed.
Shaft Misalignment
Bad shaft coupling can cause one shaft element to become misaligned. This is a critical point for engine shafts, and for rotorcraft where the tail drive shaft is made up of concatenated segments. Shaft unbalance is easily detectable by measuring the energy corresponding to twice the shaft rotating speed. Localized Gear Damage
Bent or broken gear teeth are critical faults in helicopter transmission sys-tems, and require immediate retirement of the damaged components. A localized damage to a gear surface typically generates an irregularity in the vibration waveform whenever the damaged region interfaces with another gear.
Gear Hub Crack
A gear hub / web crack occurs, like localized damage, due to excessive load. This fault type will change the gear shape from perfect circular to some-what oval. An oval rotating track results in the vibration signature changing periodically, with period equal to the gear rotation.
Distributed Gear Damage
Distributed gear damage, or fretting, occurs as fine scratches across the gear tooth pattern. This fault type typically accompanies localized damage and hub cracks, as unbalanced rotation or rough tooth edges on one gear tend
2.2. ROTORCRAFT FAILURE MODES 19 to damage its interfacing gear. Distributed gear damage alters the vibration signature just slightly, and is inherently difficult to detect using traditional vibration monitoring.
Epicyclic Carrier Cracks
Several rotorcraft gearboxes have one or two epicyclic stages just before the output to the main rotor. Due to high torque, the epicyclic planet carrier is in some cases prone to crack propagation. Cracks from the carrier rim toward the center results in one or more planets interfacing with different force than the others. This will again result in a periodic change in vibration signature, with period equal to the carrier rotation.
Bearing Race and Roller Cracks
Excessive load to bearings might cause cracks in the races or the rolling elements themselves. A crack in a bearing race will generate a sharp pulse whenever a roller passes over it. A roller crack will generate a pulse whenever the roller interfaces with the inner or outer race.
Bearing Corrosion
Corrosion is a problem for external bearing, such as those on the tail drive shaft. Corroded bearing races typically produce wide band noise, creating an increase in the total vibration energy.
2.2.3
Rotors
The rotors are the non-redundant lifting and anti-torque devices of a heli-copter. Control and propulsion is also managed by the rotors, making them the most critical part of any helicopter. Serious rotor damage is usually catastrophic.
Unbalance
A rotor must have its Center of Gravity (CG) at the center of the mast to avoid vibration at the frequency corresponding to the mast rotating speed. The amplitude of an unbalance is identified by measuring vibration in the rotor plane. Unbalance direction (which blades are too light or too heavy) can be measured using a blade indexer. Correction is done by simply adding or removing weights from the blades.
Blade Track Split
All the blades of a rotor should ideally follow the same track. Worn blades do however tend to change track slightly, causing increased vibration levels. Blade track can be estimated either by measuring vertical acceleration, or by using a camera measuring the distance between each blade and the airframe. Correction is done by altering length of the blade pitch links, or by using bendable flaps on the blades.
Bearing Wear
Some rotorcraft use fully articulate rotors, meaning that each blade can be rotated along three axis. This is achieved by fixing the blade sleeve to the hub using an assembly of three traditional bearings, or a single spheric elastomer bearing. The former solution is prone to traditional bearing problems, while the latter might suffer from damaged elastomer. Such problems are identi-fiable by an increase in vibration energy at the frequency corresponding to the mast rotating speed or blade pass speed.
Damper Wear
Fully articulate rotors use dampers on the main rotor to damp blade move-ment in the lead / lag (horizontal) plane. Worn dampers are identifiable by an increase in vibration energy at the frequency corresponding to the mast rotating speed or blade pass speed.
Swashplate Eccentricity
The swashplate is basically a gigantic bearing which encircles the main rotor mast. One part of the swashplate is fixed to a set of actuators mounted on the top of the main gearbox. The other part is connected to the blade pitch links. The swashplate is the medium allowing the stationary actuators to control the angle of the rotating blades.
Like all bearings, the swashplate is prone to generate some eccentricity after excessive use. This is usually detectable as an increase in vibration energy at the frequency corresponding to the mast rotating speed or blade pass speed.
2.3
Health and Usage Monitoring Tasks
A HUMS is responsible for alerting the operator of any problems which might threaten the airworthiness of the aircraft. To accomplish this, the HUMS
2.3. HEALTH AND USAGE MONITORING TASKS 21 use a sensor array covering most critical components on the aircraft. Some of these sensors are part of the standard avionics package, such as airspeed sensors and engine temperature probes. Others, like accelerometers and rotor indexers, are proprietary to the HUMS.
A HUMS works both reactively and proactively. The reactive approach allows the HUMS to detect any faults present in rotorcraft, while the proac-tive methods allow faults to be anticipated before they occur.
2.3.1
Sensors and Acquisition Procedures
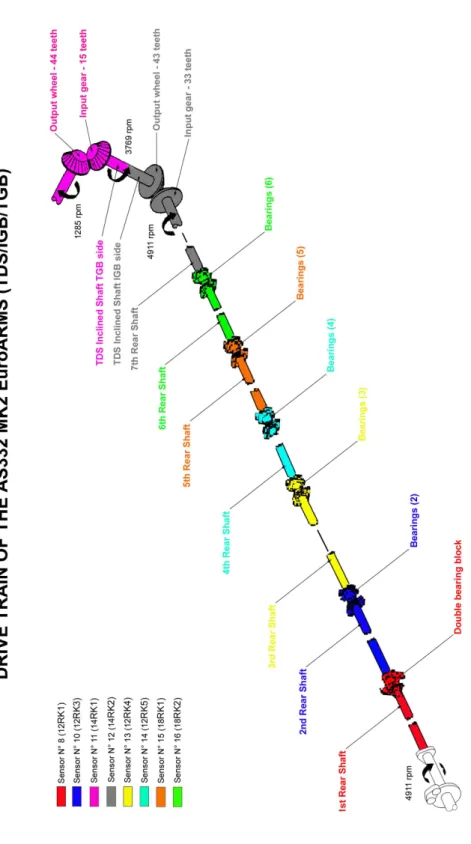
The vibration monitoring part of a HUMS uses three types of data; ac-celerometer and tachometer signals, as well as contextual parameters such as airspeed, temperature and torque. The need for the latter category of data will be explained later. Accelerometers are mounted on all critical compo-nents, including gearboxes, engines and the bearing block for the tail drive shaft (Fig. 2.2). The rotors are covered by accelerometers mounted on the airframe. Speed sensors are mounted on each engine compressor, engine out-put turbine, and on each rotor. The rotor speed sensors generate only one pulse per rotation, making it possible to know the position of the rotors relative to the vibration phase.
MGB IGB
TGB
AGBs Engines
TDS
AGB Accessory Gearbox
IGB Intermediate Gearbox
MGB Main Gearbox
TDS Tail Drive Shaft
TGB Tail Gearbox
Rotors
Figure 2.2: Mechanical Overview
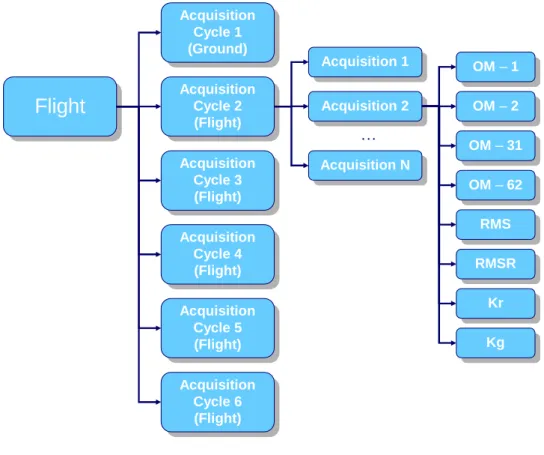
A HUMS solution for a large aircraft can require more than thirty ac-celerometers, making it impossible to acquire all accelerometers simultane-ously without generating enormous volumes of data. To counter this, all commercial HUMS solutions acquire only one component at a time with a finite length acquisition. During flight, the HUMS airborne segment cycles a preset program acquiring data from all components, one at a time.
2.3. HEALTH AND USAGE MONITORING TASKS 23
0 100 200 300 400 500 600 700 800 900 1000 −15 −10 −5 0 5 10 15 Acceleration (g) Sample Index
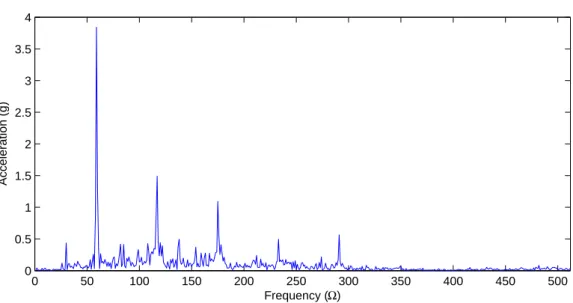
Figure 2.5: AS332L2 left hand ancillary intermediate gear acquisition.
0 50 100 150 200 250 300 350 400 450 500 0 0.5 1 1.5 2 2.5 3 3.5 4 Acceleration (g) Frequency (Ω)
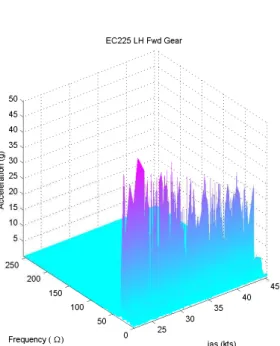
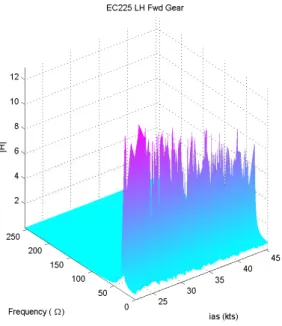
2.3. HEALTH AND USAGE MONITORING TASKS 25 As the transmission system of every rotorcraft is different, so is the sensor positioning. Figures 2.3 and 2.4 shows sensor positioning for the HUMS EuroARMS when fitted on a AS332L2 rotorcraft. Figures 2.5 and 2.6 shows an acquisition from the AS332L2 left hand ancillary intermediate gear in the temporal and the frequency domain.
2.3.2
Usage Monitoring
Two proactive methods exist. One is estimating the load on key each compo-nents, and integrating this over time to see the total stress the components have been subjected to. This allows the HUMS to estimate the remaining safe life limit for the components. The other method is simply detecting obvious misuse, such as engine overloads and over speeds.
Parameter Exceedance
Which parameters to monitor for exceedances and how to monitor them is aircraft dependent, but usually involves engine torque, engine temperature and rotor speed. Parameter threshold overshoots are automatically logged by the HUMS, together with additional information such as time, time over threshold, max value, etc. Traditional aircraft avionics displays a warning directly to the pilots whenever an event is detected. The pilots must then re-lay this information to the maintenance crew. The advantage of HUMS when recording excessive use is automated logging, more precise logging, as well as logging of additional information which helps determine the seriousness of the event, and consequently the best choice of corrective maintenance. Load Cycle Calculation
All rotorcraft parts have a safe life limit. For most parts, the safe life limit is defined in flight time. For more critical components, mainly engines, rotors and gearboxes, a safe life limit is also defined in load cycles. Al though flight time gives a good pointer to the total stress a component has been subject to, flight time does not reflect the severity of the actual use of the aircraft. For this, a more reliable metric must be defined. The load cycle scale is a metric which more accurately reflects actual accumulated component strain. Load cycles are calculated using reliable metrics such as torque, engine temperature and rotor speed. The HUMS then keep accumulative counters for the components for which load cycles are used, and alerts the maintenance crew whenever a component is about to reach its safe life limit. Load cycles must be calculated on all aircraft regardless of whether a HUMS is installed
or not. For aircraft with no HUMS, this task must be performed by other systems or by manual calculation.
Engine Power Assurance Check
Engine performance is gradually degraded throughout the lifetime of the engine. Performance must however not be allowed to drop below a certain minimum threshold. To ensure this, the engine Power Assurance Check (PAC) is performed at regular intervals, calculating the performance of each engine. The PAC consists in measuring the exhaust temperature needed to produce a given torque. On rotorcraft not equipped with HUMS, this procedure must be performed with engines running on the ground, using temporarily installed equipment.
2.3.3
Health Monitoring
The reactive part of a HUMS consists in detecting faults in the drive train as they occur, but before they become critical. This is a challenging task, as the system must be able to detect early in the propagation process, while at the same time not generate unjustified alarms.
Engine Vibration Monitoring
During engine power up and stabilized speed, temperature and vibration lev-els must be within certain limits defined by the engine manufacturer. These levels must be monitored at regular intervals to maintain airworthiness. For most HUMS, this task is performed automatically at each engine startup. On rotorcraft not equipped with HUMS, this procedure must be performed on the ground, temporarily installed equipment.
Transmission Monitoring
The health monitoring function tries to capture component condition using accelerometers mounted on the engines, gearboxes and shaft bearings. Chip detectors are also used on engines and gearboxes. A chip detector is capable of detecting metal debris in the lubrication. All rotorcraft are equipped with chip detectors generating cockpit warnings.
Rotor Track and Balance
In order to avoid violent vibrations at once per revolution of the main and tail rotor, the rotors must be well balanced. In addition, the track of each
2.4. IMPACT OF CURRENT TECHNOLOGY 27 blade must be adjusted, relative to the mast. Balance adjustments are made by adding or removing weights in the blades. Track is adjusted by changing the blade angle and profile. The vibration recordings required to calculate these adjustments are acquired during normal flight.
On rotorcraft not equipped with HUMS, this procedure must be per-formed with rotors running on the ground, temporarily installed equipment. Test flights are also required, to validate the result.
2.4
Impact of Current Technology
2.4.1
Reliability
Although effective in capturing several drive train failure modes, all existing HUM Systems are also responsible for generating a substantial number of unjustified warnings. The total number of warnings is aircraft and system dependent, but is reported by the operators [11] to be somewhere between 4.5 and 12 pr. 1000 flight hours, as a global average. The number of justified alerts is typically in the order of 1 or 2 pr. 1000 flight hours. Obviously, this number of false warnings can be quite overwhelming for inexperienced operators and the cause of a frustration for both HUMS personnel and man-agement. Also, this creates a significant unregulated void in the procedures of rotorcraft operations.
All aspects aircraft operations are highly regulated. What maintenance work to perform, when to perform it, how to perform it, and what information to report to regulatory bodies and Original Equipment Manufacturer (OEM) is defined in fine detail. This applies of course also to any fly / no-fly deci-sion, based on the outcome of maintenance inspections. The practical use of HUMS as a maintenance tool is however somewhat in contrast to this level of regulation.
Operators in the UK are obliged to submit documentation of their HUMS organizational structure and handling procedures to the CAA. Be that as it might, the day-to-day use of HUMS still leave waste room for subjective in-terpretation when it comes to HUMS based decision making. Even though the Eurocopter endorsed systems display reference to working cards in re-sponse to HUMS alarms, these can not be followed blindly. Obviously, a false alarm rate in the order of 4-1 would generate an immense amount of added (and unnecessary) maintenance work, if the alarms / working cards were to be followed without question. This leaves important decision making to the line technician or in best case to the company HUMS expert. As there is no formal training or certification for the interpretation of HUMS output,
it is up to each operator to maintain a level of training which ensures that safety is maintained. Thus, there are in reality no formal procedures for HUMS based decision making.
The Norne accident in 1997 did highlight the need for regulation of HUMS. In the Norne case, the aircraft was fitted with HUMS, but the sen-sor adjacent to the failed component was unserviceable at the time of the accident. If the HUMS would have been able to detect the fault, given a serviceable sensor, has been subject to debate. Regardless, the accident displayed the need for formal HUMS procedures and regulations, and was probably one of the contributing factors in the mandatory introduction of HUMS in the UK [1]. However, the regulations which are defined concerning HUMS address only the functionality and availability of the system. It does not specify formal procedures in the decision making process between HUMS output and possible maintenance responses.
In some cases, like the Eurocopter endorsed systems, the aircraft OEM and the HUMS provider is the same party. In these cases, the OEM can pro-vide maintenance recommendations in cases where the operator is in doubt. However, the customer support throughput is usually not sufficient to pro-vide diagnoses on flight-to-flight bases. As HUMS output should indeed to be analyzed between each flight, this still leaves much of the decision making to the line personnel.
There are no formal procedures for reporting detections and non-detections. As a result, it is difficult to create accurate statistics to determine which HUMS functions work and which do not. Some feedback is provided by the operators, but this information is highly biased and inconsistent. The follow-ing sections tries to extract whatever information possible, based on recorded data and expert opinions.
2.4.2
Safety
Helicopter accident rates have shown a clear downwards trend from the be-ginning of the eighties. Several measures, among them HUMS, where taken during the eighties to improve safety. Although it is difficult to quantify the effect of each measure, the safety enhancing effect of HUMS is none the less significant. The report "Helicopter Safety Study 2" by Sintef, states that HUMS is "the most significant isolated safety improvement measure during the last decade". The CAA estimates that about 70% percent of all drive train faults are uncovered by the current generation HUMS [38]. This figure is equivalent to the detection statistics available for the Eurocopter endorsed systems.
2.4. IMPACT OF CURRENT TECHNOLOGY 29 several in-service difficulties have been reported by the operators. Some of these difficulties are related to the fault diagnosis technology available. Others are related to more practical usability issues which were not foreseen during the design of these systems.
2.4.3
Maintenance Credit
Changes in maintenance procedures, removal of maintenance tasks, or ex-tension of component time between overhaul (TBO) due to the introduction of alternative monitoring techniques are referred to as maintenance credits. Maintenance credits to HUMS have been granted to the following functions:
• Load Cycle Calculation • Exceedance Monitoring
• Power Assurance Check (PAC) • Rotor Track and Balance (RTB) • Engine Vibration Monitoring (EVM)
The functions listed above are mandatory functions on most helicopters. The calculation of usage cycles on non HUMS rotorcraft is performed by another permanently installed device. On HUMS rotorcraft, this function is simply embedded into the HUMS. In the case of PAC, RTB and EVM, HUMS is certified to replace temporarily installed equipment, used at fixed intervals. Performing these tasks on non HUMS rotorcraft require ground-runs of engines and / or rotors. In the case of RTB, test flights are also required. On HUMS rotorcraft, the information needed for tasks is recorded during the normal operation of the helicopter. This is clearly a cost saver, both in terms of maintenance man hours and even pilot man hours (for RTB technical flights).
Although an effective cost saver in some areas, HUMS contribution to reduced TBM is a different matter. As mentioned in previous chapters, the probability of a technical failure in rotorcrafts is minimized through regu-lation. The consequences of system fault in a given component is put in one of the following categories; Catastrophic, Hazardous / Severe, Major or Minor. The probability of component failure must be no greater than 10−9, 10−6 or 10−3 pr. flight hour for the three upper categories respectively. For the rotorcraft transmission system, most components fall into the two upper categories. This means that a HUMS function set to monitor a component
which is "only" of Hazardous / Severe criticality must still have a probability of failure less than 10−6 / Flight Hour. This is a long way from the average detection rate of 70% experienced with the current systems. Although some of the diagnostic functions are well above 70%, there are still large regulatory boundaries which must be overcome on order to have any credit granted.
A major cost-driver in avionics development is the problem of hardware and software certification. A HUMS system which is to be qualified to Haz-ardous / Severe for a given function, must have airborne software certified in accordance to DO - 178 B Level B, which in itself is a feasible task. However, system criticality assessments are performed end-to-end. For instance, if a fault is captured by the airborne segment, but lost at the ground station due to buggy software, safety is obviously not maintained. For a Hazardous / Se-vere certified HUMS, this translates into level B software also on the ground station. As no operating systems are certified above level D, the entire ground station software, including operating system and hardware drivers, must be built from scratch. Further, all this software must also be certified to level B, which is a very expensive and time consuming task for such a large amount of software.
In theory, some mitigating solutions can be made to avoid this problem. This can for instance be to develop the software for two different platforms (OS + HW), and show that both solutions create identical results. Unfortu-nately, the Federal Aviation Authority (FAA) does not allow Commercial Off The Shelf (COTS) solutions containing software below level B in these cases. This means that custom made hardware must be ordered and certified for the ground station. Such a procedure would probably be even more costly than a level B software solution.
Given some improvements in detection reliability, HUMS has in theory a clear potential in the reduction of TBM. It is however difficult to see how any progress can be gained under the current regulatory regimes.
2.5
Objectives
The focus for this study is identifying methods which will improve fault de-tection rates and reduce false alarm rates for the health monitoring functions of EuroARMS and M’ARMS, two commercially available HUMS implemen-tations manufactured by Eurocopter. An additional objective is to increase the autonomy of these solutions, so that they require little or no configura-tion by the user. The main axis of research is improving the fault detecconfigura-tion methods which are based on vibration monitoring. Other sensor technologies for detecting propagating damage will also be discussed briefly. Further, the
2.5. OBJECTIVES 31 Information Technology (IT) solutions providing the infrastructure for the health monitoring functions will be reviewed, and improvement recommen-dations will be made to avoid IT related problems becoming a limited factor for the performance of the system.
Improved prognosis based on more precise load cycle calculation is cur-rently an important area of research. This path will however not be perused by this study. Nor will it treat problems related to airborne hardware, such as sensor and harness susceptibility to damage, digital hardware obsoles-cence, or practical problems related to the implementation of established usage monitoring techniques.
All tools used in this study, such as wavelets, artificial neural networks, and programming models are used without introduction. For any details on these technologies, the user might refer to the appendices and references.
Chapter 3
Current and Emerging
Technologies
3.1
Introduction
This chapter explains the technologies that make up a HUMS. The state of the art for these technologies is reviewed, including an review of existing commercial solutions. From this, shortfalls for complying with the objectives of this study are identified. Finally, improvement potential for the existing solutions are derived, and a number of research areas recommended.
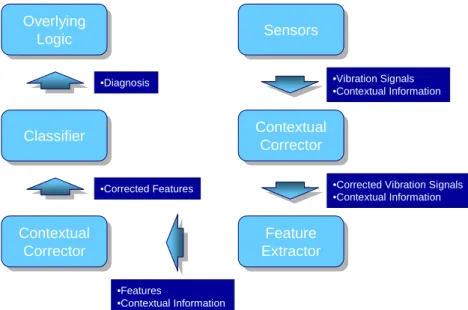
The HUMS diagnosis logic accepts a set of sensor signals and produces a diagnosis of the underlying assets based on this information. This requires a set of formal steps, including contextual validation and correction, feature extraction, and classification (Fig. 3.1). Contextual validation and correc-tion is necessary in order to ensure that the data is representative for the state of the underlying assets. Any invalid data, like overly noisy data or data recorded in unfavorable conditions are removed or corrected at this stage. Such correction can be performed both before and after the feature extraction.
Feature extraction is to extract metrics about the system input which is more informative the evaluating at the raw input itself. The purpose of this step is to extract the essential characteristics of this input, so that it is more easily interpretable for the classifier. The classifier, for instance a fuzzy logic system or a neural network, is responsible for translating a set of features to an output diagnosis. As a classifier is no more than a mapping tool, its performance is no more consistent than the features presented to it. It is thus vital that the pre-processing steps, contextual correction and feature extraction, does a good job in extraction features which makes it easy to
distinguish the different classes, i.e. states of the underlying assets, that the classifier is supposed to recognize.
A classifier can be implemented as a neural network, fuzzy logic system, or simply a threshold tester. The classifier accepts the data generated by the feature extractor, and makes a decision on the state of the monitored asset based on this. As a minimum, the classifier must be able to distinguish assets in a normal condition from those behaving abnormally. In a more complex setting, the classifier can produce more detailed information such as fault recognition and expected time to failure.
Sensors Sensors Feature Extractor Feature Extractor Classifier Classifier Overlying Logic Overlying Logic •Vibration Signals •Contextual Information •Corrected Features •Diagnosis Contextual Corrector Contextual Corrector Contextual Corrector Contextual Corrector
•Corrected Vibration Signals •Contextual Information
•Features
•Contextual Information
Figure 3.1: Diagnosis Overview
3.2
Data Validation and Correction
It is of course possible to test a mechanical assembly in a test-rig using a static environmental context, i.e. constant torque, constant rotation speed, constant temperature, and so on. A helicopter must however sustain sub-stantial variations in operating conditions. The vibrations signature of all components is to some extent sensitive to variations in environmental con-text. Consequently, such variations must be compensated for before data is passed on to the classifier.
3.2. DATA VALIDATION AND CORRECTION 35 Obviously, any change in rotating speed for a mechanical assembly will change its vibratory signature. Even though the rotating speed of a helicopter drive-train is relatively constant, any variations which might occur must be compensated for. Further, the vibratory signature for some components is also susceptible to other contextual factors, such as torque. It is indeed of interest to compensate for such factors as well, so that the information passed on to the classifier is as consistent as possible.
3.2.1
Correction of Speed Variations
The vibration signature of a component is a function of its rotating speed. A gear will generate a tone, known as the meshing tone, at the frequency corre-sponding to the tooth pass frequency. The frequency of this tone, measured in Hertz, is obviously dependent on rotating speed. To uncouple rotating speed and vibration signature, the signal is re-sampled using synchronous sampling. Synchronous sampling means that the sampling interval is synchronous with the shaft rotation rather than time. Consequently, the resulting output has a fixed number of samples per shaft rotation rather than per second.
Synchronous averaging [43] refers to the process of recording a given num-ber of rotations of a component, re-sample the signal to synchronize it with the shaft rotating speed, and adding together each segment representing one complete rotation. This will amplify any signal being periodic with the shaft rotating speed, and attenuate everything else. Synchronous averaging is a convenient tool for removing background noise. This is especially effective for gearboxes, where a single accelerometer will capture the vibration signa-tures of several components. By creating a re-sampled and averaged signal for each component, each resulting signal contains the vibration signature from only a single component. A few cases do however exist, where a signal captures the signals from several components. These are the cases where two similar components, like two gears or two bearings, are located in close proximity rotate at the same speed. In these cases, only the applicable selec-tion of vibraselec-tion features can separate the characteristics of each component. For some components, like the epicyclical planet gears, also the same vibra-tion features are applicable for each component in the acquisivibra-tion. Thus, no unambiguous error localization can be made.
Synchronous averaging is typically used for shafts and gears. Bearing acquisitions are typically re-sampled, but not averaged. This because roller slip will cause a phase delay in the vibration signal, causing it no longer to be periodic with the shaft rotation.
3.2.2
General Contextual Correction
Although the vibration signature from all rotating components is sensitive to rotating speed, some vibration signatures are also sensitive to other fac-tors. Helicopters in normal use experiences a large variation in contextual parameters, such as altitude, speed, oil temperature, torque, etc. Torque is a well known influence especially on gears.
Because the environmental context is random in time, variations in enronmental context are manifested as random variations on the recorded vi-bration signals, and consequently the vivi-brations features. Most commercial HUMS amend this problem by using a contextual window in where acqui-sition is allowed. This involves setting maximum and minimum thresholds for key parameters, such as speed and torque. A drawback of this method is that the contextual variation within the window can be substantial. Reduc-ing windows size might reduce random variation, but risk reducReduc-ing the data volume collected.
A supplementary method is by using a model representing the influence of contextual variations on the different vibration features. Once models are estimated for each feature, they can be used to cancel the effect of contextual variations. This method has been successfully deployed using engine torque as the only environmental context [21].
3.2.3
Epicyclic Frequency Separation
Frequency separation is a pre-processing technique particular to epicyclic planet gears and bearings. An accelerometer monitoring an epicyclic gear stage must, for practical reasons, be placed outside the gearbox housing. This means that the accelerometer will pick up the vibration signatures of the ring gear, the sun gear and bearing, as well as all planet gears and bearings. The ring, sun and planet vibration signatures can easily be separated using synchronous averaging, as these components rotate at different speeds. This method will however not separate the different planet signatures, as all planet gears and bearing are rotating at the same speed. Consequently, it is not possible to pinpoint any detected planet fault to a specific planet gear or bearing. Further, the error-indicating features from one faulty gear or bearing will get buried in the normal state vibration signatures from the other planets, making fault detection difficult.
A method known as frequency separation [32] [31] was developed to amend this problem. Frequency separation method requires an indexer to be placed on the planet carrier, so that it is possible to know when each planet passes the accelerometers. The recorded signal is then split up into equal
3.3. FEATURE EXTRACTION 37 size windows, where the number of windows equals the number of carrier rotations time the number of planets. Phase is adjusted so that each window contains one planet passing the accelerometer. The windows are then sorted by planet, forming one new signal for each planet.
3.3
Feature Extraction
Feature extraction is the process of extracting metrics about the system in-put which are more informative than evaluating at the raw inin-put itself. Inin-put features are the meta of the input, and constitutes a higher order interpre-tation. Feature extraction is a parameterization process which often reduces the data volume, though this is not always the case. Desirable properties for features are that they are sensitive to the characteristics of the input which differs between classes, while insensitive to characteristics which differ within each class. The latter typically being insensitivity to measurement noise and other irrelevant factors which might confuse the classifier.
In the case of vibration monitoring, a brute-force approach to feature extraction is extracting the Discrete Fourier Transform (DFT) of the vibra-tion signal. The absolute value of the DFT contains an estimate of the signal power spectrum, which displays substantially different behavior be-tween health state and damaged state signals. Further, the absolute DFT is insensitive to the shaft phase offset, which is random and thus a source of variation in signal characteristics within each class.
Given the geometry of a mechanical assembly, it is however possible to predict which frequencies, i.e. DFT coefficients, are affected by different failure modes. Consequently, any other coefficient becomes less relevant. Further, some fault-indicating signal characteristics are not well captured by the DFT, but are better enhanced using other transforms. Thus, it is common to design feature extractors which outputs only the information relevant for detecting the failure modes to which the associated components are susceptible. This information are in the context of HUMS referred to as indicators.
3.3.1
Condition Indicators
The feature extraction part of a HUMS attempts to isolate signal features which have substantially different behavior in normal state signals and signals recorded from damaged components. For shafts and bearing, this process is fairly straight forward. Normal state shafts do not produce much vibra-tion energy. Shaft failures, such as unbalance and miss-alignment, are easily
identifiable as vibration energy increases at the frequencies corresponding to multiples of the shaft rotation frequency. Classical bearing failures are, as already explained, identifiable as periodic energy pulses with frequency given by the rotation speed and bearing geometry, as well the fault type.
For gears, feature extraction is not that simple. According to [30], a perfect gear produces a distinct meshing tone (Eq. 3.1), with a harmonic distribution Pn given by the geometry of the gear, over a noise floor w(n). The variables z, Ω and Φn symbolized shaft rotation frequency, the number of gear teeth, and phase offset for each harmonic.
xperf ect(t) = ∞ X
n=0
Pncos(ntzΩ + Φn) + w(t) (3.1)
Due to the imperfect nature of any physically gear implementation, each gear mesh harmonic is subject to amplitude and phase modulation by any multiple of the shaft rotating frequency (Eq. 3.2).
xrealistic(t) = ∞ X n=0 an(t)cos(ntzΩ + bn(t)) + w(t) (3.2) an(t) = ∞ X k=0 Ak,ncos(ntΩ + αk,n) (3.3) bn(t) = ∞ X k=0 Bk,ncos(ntΩ + βk,n) (3.4)
Consequently, a gear vibration signature becomes a function of the am-plitude modulation amam-plitude matrix Ak,n, the amplitude modulation phase matrix αk,n, the phase modulation amplitude matrix Bk,n, and the phase modulation phase matrix βk,n. As the coefficient values tend to drop off quickly for increasing values of n and k, simplified finite-size approximations of these matrices can provide a good approximation of a gear vibration sig-nature.
According to [42], any presence of gear failures tends to increase the modulation between the meshing tone harmonics and low multiples of the shaft rotation. This corresponds to a value increase in the coefficient matrix Ak,n for low values of k. Traditional condition indicators are designed to capture this phenomenon. Indicators do also exist which capture changes in the noise floor w(t), which also is associated with certain types of damage.
3.3. FEATURE EXTRACTION 39 Overview
The indicator definitions presented here assume that the input signal is finite, which is the case for all commercial HUMS. It is indeed possible to create indicator algorithms working on infinite signals, but this topic is not treated in this study due to lack of relevance in the context of HUMS. The indicators explained here are only few examples of the total number existing in the literature, and only an extract of those are given an in-depth explanation.
Indicator Damage Detected Ref
IR Bearing inner race crack [35] OR Bearing outer race crack [35]
BS Bearing roller crack [35]
Crest Factor General gear [10]
Energy Operator Localized gear [26]
Energy Ratio General gear [44]
FM0 General gear [42]
FM4 Localized gear [42]
Kurtosis Localized gear / bearing [39] M6A Localized gear / bearing [28] M6A* Localized gear / bearing [44] M8A Localized gear / bearing [28] M8A* Localized gear / bearing [44]
MOD Gear web crack [42]
NA4 Localized gear [55]
NA4* Localized gear [17]
NB4 Localized gear [53] NB4* Localized gear [54] RMS General [10] RMSR General gear [44] Ω1 Shaft unbalance Ω2 Shaft misalignment Ωzn General gear
Table 3.1: Common condition indicators.
Root Mean Square
The root mean square represents the energy of the signal. As most serious defects in gear and bearing assemblies will increase the signal energy, this is a general fault indicator.
RM Sx = s 1 N X n∈N (x(n) − µx)2 (3.5) µx = 1 N X n∈N x(n) (3.6) Residual Energy
The residual signal [55] is given by (Eq. 3.7), where DF Cx is the DFT co-efficients of x. This transform captures the noise floor w(t) of the signal, by removing the signal components corresponding to the harmonics of the mesh-ing tone. An alternative definition [42] exists, which also removes the signal components corresponding to the first modulation sidebands. By calculating the rms of the residual signal, RM Sxres, the energy of the signal noise floor
is estimated. Several gear failures tend to increase the noise floor, making this an indicator both to localized and distributed damage.
xres = x − DF T−1[M DF C] (3.7)
M DF Ck= DF Ck.[modulus(z, k)! = 0] (3.8) Residual Energy Ratio
The residual energy ratio is the ratio between the residual energy and the total signal energy. Alternatively, it can be defined as the ratio between the residual energy and the meshing energy [44]. The former definition is always between zero and one, where zero indicates the perfect gear definition (Eq. 3.1).
ER = RM Sx RM Sxres
(3.9)
Kurtosis
Kurtosis is the fourth statical moment of a dataset, and indicates how outlier-prone the dataset is. In vibration monitoring, this provides a good shock indicator, indicating if a small portion of the signal has significantly higher amplitude than the rest. Kurtosis is associated with localized gear damage, as well as a cracks and corrosion for bearings.
3.3. FEATURE EXTRACTION 41 Kurtosisx = P n∈N (x(n) − µx)4 RM Sx (3.10) Omega
With Ω being the shaft rotation frequency, the Ωnis simply a spectral pointer defined relative to the shaft rotation. For synchronously sampled signals, Ωn corresponds simply to the n’th DFT coefficient. The values 1 and 2 for n, denotes frequencies for detection of shaft unbalance and misalignment respectively. Values for n being multiples of the number of teeth extracts frequencies associated with gear damage.
Modulation
According to (Eq. 3.1), a perfect gear should only produce vibration energy at multiples of its tooth pass frequency. A gear hub crack will however create a different energy of the meshing tone depending on the rotational position of the gear. Thus, gear rotation and meshing becomes modulated. This will manifest itself as modulation sidebands to the harmonics of the meshing tone, with sideband distance to the carrier equal to the shaft rotation frequency. Monitoring these frequencies will provide indications of gear web cracks, severe localized damage, and unbalance in the gear shaft [42].
Bearing Indicators
A crack in the inner race or outer race of a bearing will manifest itself as a pulse repeated every time a roller passes over the crack. A crack directly on the roller will generate a pulse every time the crack passes one of the races, i.e. twice for every rotation of the roller. This gives the three fault frequencies of a bearing; ball pass frequency inner race (IR) ball pass frequency outer race (OR) and ball spin frequency (BF) [35]. These frequencies, relative to the shaft rotation, are specific to each bearing.
Monitoring any of these frequencies directly will however not detect any faults, as repeated pulses on these frequencies will become modulate on the natural frequency of the bearing, and end up as sidebands to this frequency. As the natural frequency normally is high, and not necessarily known, looking for modulation sidebands in the expected locations is not practical.
A better approach is to demodulate the signal. The signal envelope, or Hilbert transform, will demodulate the bearing fault frequencies from the carrier and project them back to their expected locations. Calculating the DFT of the enveloped signal will thus reveal any bearing damage. Normally,
an area of ±10% around each fault frequency is extracted to accomodate for roller slip.
3.3.2
Stationarity Indicators
Although the basic condition indicators provide reliable indications to change in the condition in the underlying assets, they are of little use without a comparative baseline. Rather than defining a baseline for each indicator, it is possible to compare each observation with the most recent ones to look for any trends in the evolution of the indicators. A simple method is to perform a linear regression of the last couple of observations, and measure the rate of incline or decline over this segment [33] [21] [22]. Alternative, it is possible to extrapolate the linear model, and estimate the time remaining before it crosses some pre-defined threshold. If a condition indicator is seen as a parameterization of the raw sensor signal, a stationarity indicator constitutes a second level parametrization.
3.3.3
Modeling
A more general approach to feature extraction is modeling. A modeling ap-proach does not, unlike traditional condition indicators, make any assump-tions about features of importance, and does not require any a priori infor-mation about the geometry of the underlying assets.
General parametric signal models are MA, AR and ARMA [4]. By as-suming that a signal power spectrum is stationary, this power spectrum can be approximated by any of these models. Fitting a model to an observed signal can be done by a number of algorithms found in the literature [36]. The number of parameters for any of these models fitted to an observed sig-nal are far subsiding the number of DFT coefficients for the same sigsig-nal. Consequently, these parameters make a set of features suitable for classifier input. This was successfully tested in [14] [20], using a cluster classifier.
A similar approach is using the lifting scheme [45] to generate a wavelet capable of predicting a signal waveform. This method involves deriving a wavelet from a normal state transmission. The same wavelet can then be used for time domain prediction of subsequent observed signals. Any substantial prediction error indicates that the observed signal does not correspond to the normal state wavelet, and is thus an indication of failure [7] [40] [41].
3.4. CLASSIFICATION 43
3.4
Classification
With the exception of the usage functions, which utilize simple and precise metrics for decision making, HUMS lies within the field of pattern recogni-tion. There are however a few characteristics which separate HUM Systems from most other pattern recognition systems. This is mainly due to the crit-icality of detecting all failure modes, regardless of their frequency of occur-rence. Consequently, the systems are set to detect failure modes for which they are not trained, even some of which have never even occurred (and maybe never will). It is to some extent possible to extrapolate the tested and confirmed diagnosis functions of one component to other components for which training data does not exist. This is however not done without adding even more uncertainty to discipline which by default is quite "fuzzy", and is partially the reason for the high false alarm rate experienced with these systems.
3.4.1
Threshold Testing
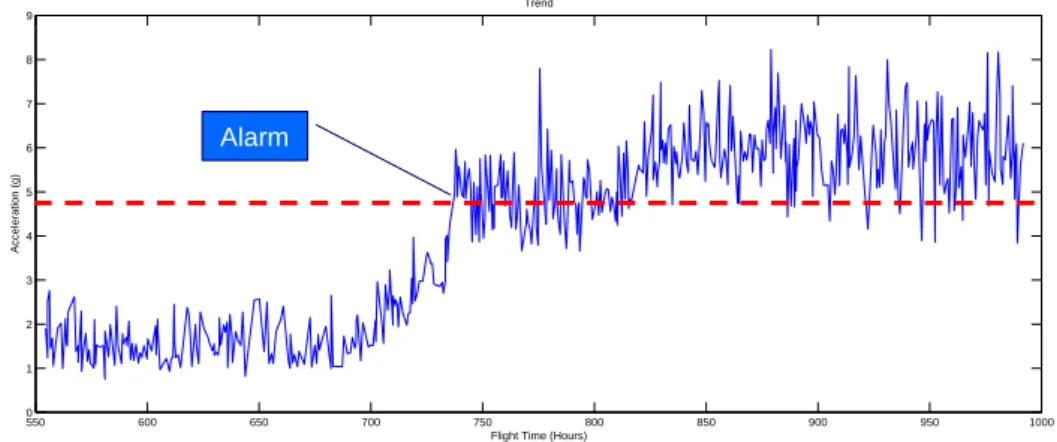
Condition indicator threshold testing is the oldest classification technique in the HUMS field, and is incorporated in several commercially available solu-tions. The technique consists simply of testing each indicator to a threshold (Fig. 3.2). Given the type of indicator and the component from which it originates, at threshold breach gives both an indication that something is wrong, as well as information on which component is faulty and what type of failure it suffers from. In a practical implementation, it is common to require N out of M threshold overshoots on a given indicator before an alarm is raised. This is to avoid that indicator outliers, in the context of HUMS referred to as spikes, result in unjustified alarms.
The main objection to threshold testing in health monitoring is the dif-ficulty in setting the optimal threshold values. Setting thresholds too low might result in false alarms, i.e. threshold overshoots despite the fact that nothing is wrong. Setting the thresholds too high renders the system less sensitive to variations in the vibration signature, and thus less equipped for detecting faults. For some indicators, it is possible to set global or fixed thresholds. This means that the same threshold is applied across an entire fleet. Unfortunately, most indicators have a normal state envelope which is unique to each aircraft. Further, this envelope is prone to change between major overhauls, a phenomenon known as a step change. To accommodate for this, thresholds must constantly be updated for each aircraft.
Threshold adjustment, or learning, is performed on new aircrafts and after major overhauls. The process consists in acquiring a statistically significant
550 600 650 700 750 800 850 900 950 1000 0 1 2 3 4 5 6 7 8 9 Trend
Flight Time (Hours)
Acceleration (g)
Alarm
Figure 3.2: An indicator breaching its threshold.
baseline of observations, typically on the magnitude of 50 flight hours, and calculating the gaussian localization µi and distribution σi parameters on the dataset. The threshold or thresholds for an indicator i are then defined using a threshold policy of type Ti = µi+ N σi. During the learning period, a set of alternate thresholds are used. These are global, and are to avoid false alarms set so high that they have reduced chance of detecting faults. Consequently, the aircraft is vulnerable during the training period.
Threshold re-learning is a tedious task for heavy aircraft with several hun-dred indicators, and it is not always possible to predict which overhauls will require re-learning of which indicators. This burden is a common complaint from operators who wishes more autonomous solutions.
Alternative variants are hysteresis thresholds, hypothesis testing and Bayesian decision approaches. Hysteresis thresholds are applicable in systems where it is necessary to measure the number of times a variable crosses a threshold over a given period. This method is used in several of the usage monitoring functions of the HUMS, but has no obvious applications in health monitoring. Using hypothesis testing it is possible to compare two groups of observa-tions, and find the possibility of the two groups originating from the same distribution. If one group represents the normal state baseline and the other a set of observations from an asset in an unknown condition, it reasonable to assume that the asset is in a damaged state if its associated observation dis-tribution is highly different from the normal state baseline. This is in reality a generalization of the threshold testing method described above, but per-mits comparing a group of samples to the learnt baseline. Another variant is analyzing the possibility of various failure modes given an alarm. By knowing these prior probabilities, it is possible to identify the most likely problem,