RESOURCE EFFICIENCY STRATEGIES AND MARKET CONDITIONS
Magali A. Delmas
University of California, Los Angeles Email: [email protected]
Sanja Pekovic,1
University of Paris, Dauphine Email : [email protected].
Forthcoming Long Range Planning
Abstract
In this paper we analyze the factors that drive the adoption of innovative resource efficiency strategies to reduce energy and material use, under different market conditions. We uncover the "paradox" of lower adoption of resource efficiency strategies in an economic downturn and identify the characteristics of firms that adopt these strategies. Using data from a French survey with responses from 5,877 firms, we show that only 10% of the firms in our sample adopt resource efficiency strategies in perceived economic downturn as compared to 46% in perceived steady or growing market conditions. However, the probability of adopting such strategies in downturn conditions rises to 24% for firms that focus on cost leadership strategies, have adopted environmental standards, conduct their research internally and are vertically integrated. We provide recommendations to encourage more widespread adoption of resource efficiency strategies.
Keywords: business strategy, corporate sustainability, energy efficiency, resource efficiency, contingent theory
1 Sanja Pekovic gratefully acknowledges the financial support from the AFNOR “Performance des Organisations” endowment in collaboration with the Paris-Dauphine Foundation.
INTRODUCTION
In the literature on business and the environment, important headway has been made in understanding the factors that drive firms to adopt environmental strategies, such as pollution prevention activities and international environmental management standards (Darnall et al., 2000; Delmas, 2001; Hart, 2005). However, less attention has been paid to the determinants of the adoption of innovative resource efficiency strategies that aim to reduce the use of energy, resource and/or material per unit of production. Such strategies include the introduction of product or services innovation, or process or marketing innovation that result in the reduction of the use of raw material or energy consumed by unit produced.
Energy and resource efficiency strategies have been recognized since the early 1970s with the potential for significant cost savings (Arny et al., 1998; Clinch & Healy 2000), and the recent economic downturn further enhances the appeal of the adoption of such frugal strategies to gain efficiencies in constrained times (von Weizsäcker et al., 2010). The promise of energy conservation and resource efficiency strategies as key in the effort to counteract the effects of climate change (IPCC, 2007) also adds to their desirability. However, evidence suggests that a significant proportion of energy and resource efficiency improvement potential remains untapped and that many energy and resource efficiency investments are not undertaken despite their apparent profitability (DeCanio, 1993; Blass et al., 2011); Expert Group on Energy Efficiency, 2007). In the current economic downturn, are firms more likely to invest in resource efficiency strategies? Are changes in the economic context sufficient drivers of changes in firms’ strategies regarding resource efficiency?
In this paper, we investigate the factors that drive the adoption of innovative energy and
resource efficiency strategies in different market conditions. We build on the contingency theory,
which contends that firm strategies need to be tailored to the particular internal and external circumstances faced by an organization in order to achieve success (Porter, 1980; Pearce, 1983;
Day, 1984; Miller & Friesen, 1986). In this perspective, businesses that manage their strategies in response to economic environmental changes are better able to thrive. However, these relationships become less clear during economic downturns because of the increasing economic environmental uncertainty and the need for firms to downsize (Bailey & Szerdy, 1988; Boyle & Desai, 1991). An economic decline might have differing impacts on firm strategies and performance depending on the firm capabilities and structures (Hamel & Prahalad, 1994). It is therefore very important to clarify the link between a given strategy, economic environmental preconditions and organizational factors (Wu et al., 2007).
In exploring this link theoretically as well as empirically, the paper takes a first step towards studying the effect of market conditions on the adoption of energy and resource
efficiency strategies, an issue that has received relatively little systematic analysis. We argue that
firms’ decisions to adopt energy and resource strategies may differ according to the market conditions under which they operate, and that such strategic choices may be contingent on the fit between the characteristics of the external market environment and the organization of the firm. Building on contingency theory, we contend that the successful adoption of innovative resource efficiency strategies by firms in perceived downturn economic conditions require complementary capabilities in innovation and environmental management, a suitable organizational structure and a compatible competitive strategy.
In order to test the impact of market conditions on the adoption of energy and resource efficiency strategies, we use data from a large representative sample of 5,877 French firms with more than twenty employees; the data is drawn from three French cross-sectional surveys: the Organizational Changes and Computerization Survey (COI, 2006), the Community Innovation Survey (CIS, 2008) and the Annual Firm Survey (EAE, 2006). This allows us to introduce many factors that can be considered as significant incentives in a firm decision to adopt energy and resource efficiency strategies.
Even though energy and resource efficiency strategies have the potential to lead to cost savings, we find that the , the adoption of these efficiency strategies is significantly lower under perceived downturn market conditions, as compared to perceived steady or growing conditions. However, firms with complementary environmental strategies, internal R&D, that are vertically integrated, or that pursue general cost leadership strategies, tend to invest more in energy and resource efficiency strategies in these downturn market conditions.
In both its theoretical and empirical domains, this paper extends existing research. We still have limited understanding of how firms are developing strategies to cope with resource constraints while maintaining or even improving their economic sustainability. Building on previous literature analyzing the organizational factors that drive the adoption of sustainable or environmental strategies (Darnall & Edward, 2006; Delmas & Toffel, 2008), our research highlights the links between existing organizational capabilities, market conditions and resource efficiency strategies. We show that energy and resource efficiency strategies are not adopted in isolation but operate in synergy with existing organizational capabilities and competitive strategies. Our findings also have important policy implications, as they can enable policy-makers to better formulate and effectively apply energy and resource efficiency policies.
LITERATURE REVIEW
Energy, material and resource efficiency strategies aim at reducing the footprint of industrial activities (Kounetas & Tsekouras, 2008), and may be regarded as a constituting a significant share of all environmental innovations (Rennings & Rammer, 2009). Energy efficiency strategies include all changes that result in decreasing the amount of energy used to produce one unit of economic output or services (e.g., Patterson, 1996). Material and resource efficiency strategies refer to changes that result in reducing the amount or quantity of material and natural resources
required to produce a unit of economic output or services. For the remainder of this paper, we will use the term resource efficiency as a generic umbrella term that covers energy efficiency on the one hand and material efficiency on the other hand.
Resource efficiency strategies are part of pollution prevention methods (Hart, 1995; Hart & Milstein, 2003). Not only can they reduce the negative environmental impact of a firm's activities, but may also be translated into lower procurement and waste management costs, and into more general cost savings (Von Weizsäcker et al., 1997; Hinterberger et al., 1997; Schleich, 2009). However, recent research has highlighted that such environmental impacts and cost savings might be contingent on external factors as well as the organizational structure of the firm (Aragón-Correa & Rubio-López, 2007), and some resource efficiency strategies could potentially lead to a rebound effect (Berkhout et al., 2000; Holm & Englund, 2009). It is therefore important to understand the external and organizational factors that lead to the adoption of resource efficiency strategies that favor efficiency gains.
Research indicates that, in spite of what would seem to be significant opportunities for profitability, many energy efficiency practices are not adopted; and a notable amount of energy efficiency improvement potential remains unrealized (Expert Group on Energy Efficiency, 2007; DeCanio, 1993). For example, Blass et al., (2011) found that only 35% of energy efficiency recommendations with an average payback of a year were adopted by small and medium enterprises, as part of the Department of Energy’s Industrial Assessment Center Program. Many explanations have been provided in the literature for this phenomenon, ranging from economic factors and complexity of regulation (Mueller, 2006) to organizational barriers, such as misplaced incentives, risk aversion and shortsightedness of management (Blumstein et al., 1980; DeCanio, 1993). For instance, scholars have argued that underinvestment in energy by firms is explained by the so-called “split incentive” problem, involving “transactions or exchanges where the economic benefits of energy conservation do not accrue to the person who is trying to
conserve” (Golove & Eto, 1996). Another cause for underinvestment may be the alleged myopia of management (DeCanio, 1993; Jaffe & Stavins, 1994; Thollander, 2008), which would explain why energy-efficient investments require shorter payback periods or very high internal hurdle rates as compared to other investments (DeCanio, 1993; Ross, 1986; Sorrell et al., 2004). This literature also suggests that energy conservation may not attract top management interest, and may therefore be given lower priority than other investments with similar payback (Sassone & Martucci, 1984). Although the literature focuses on cognitive or psychological factors, it has paid less attention to the question of how market conditions can influence the attractiveness of resource efficiency strategies, as well as to the question of how such conditions interact with organizational factors.
Similarly, the business and the environment literature to date has been limited in its analyses of the roles played by market and economic conditions in the adoption of pollution prevention strategies. Most studies have focused on the influence of external stakeholders, such as regulators, customers, or environmental non-governmental organizations, but have devoted less attention to the general economic conditions surrounding the firm. These studies have investigated how the adoption of pollution prevention strategies is influenced by environmental legislation and regulations (Carraro et al., 1996; Delmas, 2002; Delmas & Montes-Sancho, 2010; Delmas, et al., 2007; Majumdar & Marcus, 2001; Rugman & Verbeke, 1998; Russo, 1992), customer demand (Christmann & Taylor, 2001; Delmas & Montiel, 2009), and the desire to improve or maintain relations with their communities (Florida & Davison, 2001; Henriques & Sadorsky, 1996). Other studies have shown that managerial perceptions of the importance of various stakeholder pressures were associated with a more proactive environmental stance (Delmas, 2001; Henriques & Sadorsky, 1999; Sharma & Henriques, 2005). Several studies have found evidence that customer and/or buyer pressure has motivated firms to adopt environmental management practices (Delmas & Montiel, 2008; Henriques & Sadorsky, 1996). A recent
empirical analysis found customer pressure to be an important determinant of the likelihood of adopting the ISO 14001 standard (Delmas & Toffel, 2008). Yet, there is comparatively less research on how general market conditions impact the adoption of such pollution prevention strategies (Aragón-Correa & Sharma, 2003; Marcus & Geffen, 1998; Russo & Fouts, 1997; Sharma et al., 2007). The research demonstrates that perceived munificence in the general business environment increases the likelihood that a firm will use its capabilities and resources to develop a proactive environmental strategy (Aragón-Correa & Sharma, 2003). However the impact of economic conditions on firms’ ability to reap the benefits from proactive environmental strategies is less clear. Aragón-Correa and Sharma (2003) argue that perceived munificence in the business environment weakens the association between a proactive environmental strategy and competitive advantage, while Russo and Fouts (1997) find that firms are more likely to profit from environmental strategies when they are in high-growth industries rather than low-growth industries (Russo & Fouts, 1997). In addition, this research does not investigate how economic conditions impact the adoption of resource efficiency strategies.
Investigating the market conditions under which resource efficiency strategies are adopted is important, because this information might have important implications for the costs and benefits of such strategies. The literature has identified several opportunities for proactive environmental strategies to benefit shareholders directly (McWilliams & Siegel, 2001; Siegel, 2009). These include value creation strategies achieved through the development of greener products (Klassen & Whybark, 1999; Reinhardt, 1998), benefits resulting from non-market strategies to influence government regulation so that their rivals are at a disadvantage (Shrivastava, 1995), and cost savings achieved by preventing pollution (Ambec & Lanoie, 2008; Hart, 1995). However, such opportunities might depend on the market conditions surrounding the firm. Indeed, value creation strategies through the development of greener products might be
more attractive in growing market conditions, while cost savings achieved by preventing pollution might be more suited to declining economic conditions.
The lack of research on the factors that hamper or facilitate the adoption of resource efficiency strategies in downturn economic conditions, however, is problematic. The current economic conditions call for important changes in the way business is undertaking its activities (Von Weizäcker et al., 2010), yet we still have little empirical evidence about the most favorable combination of organizational factors and market conditions that facilitate the successful adoption of resource efficiency strategies.
HYPOTHESES
We first develop competing hypotheses on the role of downturn market conditions on the adoption resource efficiency strategies. Second, building on contingency theory, we develop hypotheses on how organizational factors impact the adoption of such strategies independently or in relation to downturn market conditions.
Downturn Market Conditions. There are two competing hypotheses regarding the impact of downturn market conditions on the adoption of innovative resource efficiency strategies. Downturn market conditions are marked with fewer market opportunities and general unpredictability of the economic environment (Anderson, 1988).
The literature indicates that the adoption of energy resource efficiency strategies is associated with cost savings for firms in the light of expected high future energy prices, improved security of energy services, and other co-benefits such as employment or productivity gains and health benefits due to lower emissions of local pollutants—e.g., nitrogen oxides and
sulfur (Schleich, 2009). We should thus expect that, in economic downturn conditions, firms would be more likely to resort to resource efficiency strategies in order to reduce their costs.
However, the innovation literature indicates that innovation often occur in periods during which a strategic window is opened, which is characterized by market growth (Abell, 1978; Lilien & Yoon, 1990). As Freeman et al. (1982) indicate, in adverse market environments, investments and innovation are likely to be reduced because of low profit margin, low cash flow and a general “pessimistic mood”, while in periods of market expansion there are opportunities for innovation to emerge. Furthermore, because of the general unpredictability of the economic environment, managers might favor shorter-term investment and or delay investment decisions in general (Dixit & Pindyck, 1994), including decisions to invest in resource efficiency strategies. We therefore provide two competing hypotheses on the relationship between market conditions and the adoption of resource efficiency strategies.
H1a: Firms are less likely to adopt resource efficiency strategies when they perceive that the market is down.
H1b: Firms are more likely to adopt resource efficiency strategies when they perceive that the market is down.
As we argue below, market conditions alone cannot determine the success of resource efficiency strategies. The adoption of such strategies, like the adoption of other strategies undertaken by the firm, need to be associated with capabilities and aligned with the main strategy of the firm. Contingency theorists have highlighted the importance of the fit of a firm's strategy with the environmental or organizational contingencies facing that firm (Andrews, 1971; Hofer & Schendel, 1978, Scholz, 1987), in order to improve firm performance (Ginsberg &
Venkatraman, 1985; Miles & Snow, 1994). Recent research has also demonstrated how organizational factors moderate the external economic and regulatory pressures faced by firms and play an important role in the adoption of environmental management strategies (Aragon-Correa & Sharma, 2003; Darnall & Edward, 2006; Delmas & Toffel, 2008).
General Strategy (Strategic Fit). Porter's (1980, 1985) generic business-level strategies, overall cost leadership, differentiation, and focus have become a dominant paradigm in the business policy literature. A cost leadership strategy involves the firm winning market share by appealing to cost-conscious or price-sensitive customers. This is achieved by having the lowest prices in the target market segment. To succeed at offering the lowest price while still achieving profitability, the firm must be able to operate at a lower cost than its rivals. This is attained by providing high volumes of standardized products and by limiting customization of service. Production costs can be kept low by using fewer components, or standardized components, and by limiting the number of models offered to increase economies of scale. Overheads can be kept low by paying lower wages, by encouraging a cost-conscious culture, and so on. Maintaining this strategy requires a continuous search for cost reductions in all aspects of the business. Because resource efficiency strategies should lead to cost reduction, such strategies should be more attractive to firms that are pursuing cost leadership strategies than to those pursuing quality or differentiation strategies. Indeed a strategy of differentiation aims to create a product that consumers perceive as unique and thus enables the firm to command a premium price that exceeds the accumulation of extra costs generated during product development. A differentiation strategy is usually supported by substantial investments in research, product or service design, and marketing (Miller, 1988) and firms focusing and such strategies are therefore less concentrated on cost reduction. We therefore hypothesize that:
H2a: Cost leadership strategy oriented firms will be more likely to adopt resource efficiency strategies.
H2b: Quality/differentiation strategy oriented firms will be less likely to adopt resource efficiency strategies.
Complementary Capabilities. Research has shown that knowledge in one field can ease the absorption of new knowledge in related fields (Cohen & Levinthal, 1990; Delmas et al., 2011). Firms that have developed organizational capabilities to acquire new knowledge will be better able to acquire knowledge related to resource efficiency strategies than firms that have not developed such capabilities (Marcus & Geffen, 1998; Darnall & Edwards, 2006). For example, given the conceptual similarity between environmental management systems that aim at reducing the firm environmental impact and resource efficiency that aims at reducing overall resource usage, it may be possible to accelerate the accumulation of resources in the former by integrating it into the latter. In firms that do not have well-developed environmental management systems, there could be barriers to implementing resource efficiency strategies, because of a lack of coordination between different units regarding the firm's environmental impact, as well as split incentive problems. Similarly, firms with R&D activities that are conducted in house should also be more prepared to invest in novel resource efficiency strategies as they have developed internal capabilities to innovate (Conrad, 1997; McWilliams & Siegel, 2001). We therefore hypothesize the following:
H3a: Firms that have adopted environmental standards are more likely to adopt resource efficiency strategies.
H3b: Firms with R&D investments are more likely to adopt resource efficiency strategies.
Vertical Integration. Research has shown that firms with centralized decision-making are more likely to invest in resource efficiency because centralization provides the necessary coordination to resolve split incentives issues (Howarth & Sanstad, 1995; Sorrell et al., 2004). Misplaced, or split, incentives are transactions or exchanges where the economic benefits of energy conservation do not accrue to the person who is trying to conserve (Howarth & Sanstad, 1995). Vertical integration can also facilitate the flow of information necessary to put into place resource efficiency strategies (Golove & Eto, 1996). As Williamson has argued (1985), the key issue surrounding information is not its public goods character, but rather its asymmetric distribution combined with the tendency of those who have it to use it opportunistically. Outside of vertical integration, accurate information may be difficult to obtain because those who have information have strategic reasons to manipulate it in order to inflate its value (Golove & Eto, 1996). We therefore hypothesize that:
H4: Vertically integrated firms are more likely to adopt resource efficiency strategies.
Downturn Market Conditions, Cost Leadership Strategy, Complementary Capabilities and Vertical Integration. Here we argue that investment in resource efficiency strategies requires a fit between overall cost leadership strategies, market downturn and innovative capacity.
First, a low-cost strategy should be more attractive in a downturn environment. This is consistent with Murray (1988), who argued that a low-cost strategy is most viable when customers are sensitive to price and the firm can sustain its cost advantage with economies of scale, or access to cheap materials or channels of distribution. Wu et al. (2007) also argued that a
low-cost strategy might be particularly beneficial in hostile economic environments that contain fewer opportunities and are more competitive than usual. They provided empirical evidence that differentiation-oriented firms underperformed efficiency-oriented firms in downturn economic conditions (Wu et al., 2007).
Second, firms that possess the existing capabilities to reduce their cost, but also those that have adopted green and innovative strategies might have already a lead in downturn conditions to adopt resource efficiency strategies. This is because in such constrained economic times, the cost of adopting resource efficiency strategies might be relatively lower for them since they already have complementary capabilities. Indeed, the pre-existence of complementary capabilities might reduce the information and search costs of resource efficiency strategies. In addition, the uncertainty of the success of resource efficiency strategies might be lower for firms with complementary capabilities since they already have some experience in developing related competencies. Firms that are vertically integrated should also have an advantage to access information in downturn condition marked by increased uncertainty and competition. This is consistent with Sharma et al., who argued that perceived uncertainty in a general business environment increases the likelihood of a firm’s deploying its organizational learning, cross-functional integration capability, continuous innovation capability to generate a proactive environmental strategy (Sharma et al., 2007). We therefore hypothesize the following:
H5a: Cost strategy oriented firms will be more likely to adopt resource efficiency strategies in perceived downturn market conditions as compared to those that are not cost leadership oriented.
H5b: Quality/differentiation oriented firms will be less likely to adopt resource efficiency strategies in perceived downturn market conditions as compared to those that are not adopted Quality/differentiation oriented.
H5c: Firms that have adopted environmental standards are more likely to adopt resource efficiency strategies in perceived downturn market conditions as compared to those that have not adopted environmental standards.
H5d: Firms with R&D investments are more likely to adopt resource efficiency strategies in perceived downturn market conditions as compared to those that have not invested R&D.
H5e: Vertically integrated firms are more likely to adopt resource efficiency strategies in perceived downturn market conditions as compared to non-vertically integrated firms.
Our framework is summarized in Figure 1. We highlight the role of a firm's external environment, competitive strategies, organization and resources as drivers of the adoption of resource efficiency strategies. We hypothesize that firms that are more likely to invest in resource efficiency strategies in downturn market conditions are those that have adopted cost leadership strategies, invested in environmental standards and internal R&D, and are vertically integrated. The combination of these characteristics makes these firms more likely to be able to adopt such strategies and to benefit from their implementation.
METHOD
Data. In order to test our hypotheses, we use data from three cross-sectional French surveys: the Organizational Changes and Computerization Survey2 (COI, 2006), the Community Innovation Survey3 (CIS, 2008) and the Annual Firm Survey4 (EAE, 2006). Our sample includes 5,877 firms based on merging the data of these three surveys. Although the surveys were administered in 2006, a little before the main worldwide economic recession, France had been in a relatively
2 More details about the design and scope of this survey are available on www.enquetecoi.net: Survey COI-TIC 2006-INSEE-CEE/Treatments CEE.
3 More details about the design and scope of this survey are available on
http://www.insee.fr/fr/methodes/default.asp?page=sources/sou-enq-communaut-innovation-cis.htm. 4 More details about the design and scope of this survey are available on
http://www.insee.fr/fr/methodes/default.asp?page=definitions/enquete-annuelle-entreprises.htm. Cost reduction Quality/ Differentiation Firm Strategies Perceived Downturn Market Conditions Adoption of Energy, Material and Natural Resource Efficiency
Practices
Firm Resources and Organization Environmental Standards Vertical Integration Innovation/ Research capacity H2 H5 c,d,e H5 a,b H1 H3
depressed economic situation for some time at that point with a GDP growth significantly lower than the countries of the Organization for Economic Cooperation and Development (OECD),5 but more importantly the surveys provide useful information about the general economic conditions surrounding the firms, as perceived by the respondent. This allows us to compare corporate behavior in different perceived economic conditions.
The COI survey is a matched employer-employee dataset on organizational change and computerization from the National Institute created this survey for Statistics and Economic Studies (INSEE), the Ministry of Labor and the Center for Labor Studies (CEE). The survey covers 7,700 firms from the private sector. This is a representative population of French firms from all industries except agriculture, forestry and fishing. Each firm completed a self-administered questionnaire regarding the utilization of information technologies and work organizational strategies in 2006, and concerning changes that had occurred since 2003. Firms were also interviewed about their economic goals and on the economic contexts in which organizational decisions were made.
The Community Innovation Survey (CIS) was administered by the French Institute for Statistics and Economic Studies over the period 2006-2008; the survey is based on the OECD Oslo Manual. Firms answered questions regarding innovations they had introduced within the past three years. The questionnaire was sent to 25,000 legal units and the response rate was also very high, 81%. The CIS survey is mandatory for firms with more with 250 employees or more so has a more important representation from firms with more than 250 employees.
The Annual Enterprise Survey is an annual survey conducted by the French Ministry of Industry to collect basic data on the structure of surveyed firms such as business activities, size
5 From 2003 to 2006, the average annual real GDP growth was 1.9, which is almost a point lower than the OECD average annual real GDP growth (2.75) during that period (OECD, 2011).
and location. The EAE is a mandatory survey and the sample we use comprises 80,000 enterprises that are surveyed each year
The three datasets are linked by firm identification code named SIREN. After merging these surveys, we obtain a sample of 5,877 observations. Our sample contains firms that have a higher number of employees as compared to the CIS survey, which is expected since bigger firms tend to have more resources to respond to questionnaires or are mandated to do so as is the case with the CIS survey. However, our sample still includes a broad range of firm sizes (from 18 employees to more than 100,000). The surveys do not include the specific title of the respondent but we know that 40% in our sample belong to general and upper management and 30% from the finance and accounting department. The average years of seniority in the firm is 13.5.
We describe below the variables used in our study and provide references to the databases in Table 1.
Dependent Variable
Resource Efficiency Strategies. In order to analyze the determinants of investments in energy and resource efficiency strategies, we construct a resource efficiency binary variable which takes the value of 1, if: a) the firm has introduced innovative strategies to reduce energy use per unit of output; and/or b) the firm has introduced innovative strategies to reduce material use per unit of output.6
6
CIS industry questionnaire. Question 11a. In the last three years, has your firm introduced a product or service innovation, a process or marketing innovation bringing environmental benefits for the production of products or services? 1) Reduction in the use of raw material (including packaging) by unit produced, 2) Reduction of energy consumption by unit produced.
Independent Variables
Market Conditions. In order to examine the impact of market conditions on firms’ investments in resource efficiency, we use a variable indicating the evolution of the market conditions of the main activity of the firm since 2003. Three different market conditions are considered: 1) down market conditions; 2) steady market conditions; and 3) growing market conditions. Higher numbers for this variable signify more unfavorable market conditions.
Cost Leadership Strategy. We introduce a variable that represents the level of strategic importance attributed to providing competitively priced products and services. The variable is coded from 1, representing very low strategic importance, to 4, representing very high strategic importance.
Quality/Differentiation Strategy. We introduce a variable that represents the level of strategic importance the firm allocates to the quality of its products or services. The variable is coded from 1, very low strategic importance, to 4, very high strategic importance.
Environmental Standards. We include a binary variable, coded 1, if the firm was registered according to one of the following standards in 2006: ISO 14001 standard; organic labeling; fair trade; another type of environment-related standard. Unfortunately, the database does not distinguish between these standards.
R&D. We introduce binary variable indicating whether the firm undertakes its R&D development activities internally (coded 1) or externally (coded 0).
Vertical Integration. We introduce a binary variable, coded 1, if the firm organizes its production activities internally or if it they are subcontracted.
Controls
Regulation. Research has shown that the regulatory context is a significant driver of firm investments in green strategies (Kounetas & Tsekouras, 2008; Delmas & Montes-Sancho, 2010). Hence, we include a variable representing whether the firm has been affected by change in regulations, standards (health, environment, worker rights, etc.) since 2003.
Quality Standards. Previous empirical findings support the notion that quality practices positively influence innovation performance, since quality practices, in both their human and technological dimensions, help to create an environment and a culture that support innovation (Darnall & Edwards, 2006; Pekovic & Galia, 2009). We therefore include a binary variable representing the adoption of quality standards by the firm.
Holding. Being part of a holding company could play an important role in resource efficiency investment. This might be because firms that belong to a holding have more financial resources available for investment in new technologies (Darnall & Edwards, 2006; Pekovic, 2010; Zyglidopoulos, 2002). Hence, we include a dummy variable that takes a value of 1 when the firm belongs to a holding.
Export. Research has shown firm exports to be a driver in the adoption of green strategies (Delmas & Montiel, 2009). We use a continuous variable representing the firm's volume of export divided by the firm's sales.
Profit. Limited access to capital may prevent resource efficiency measures from being implemented (Jaffe & Stavins, 1994; Kablan, 2003). We include a continuous variable that indicates a firm’s profit.
Size. Most empirical studies have found that the probability of investing in resource efficiency strategies increases with firm size (e.g., Ley, 2010; Kounetas & Tsekouras, 2008; Brunnermeier & Cohen, 2003). Firm size is measured by a continuous variable representing the number of employees within the firm.
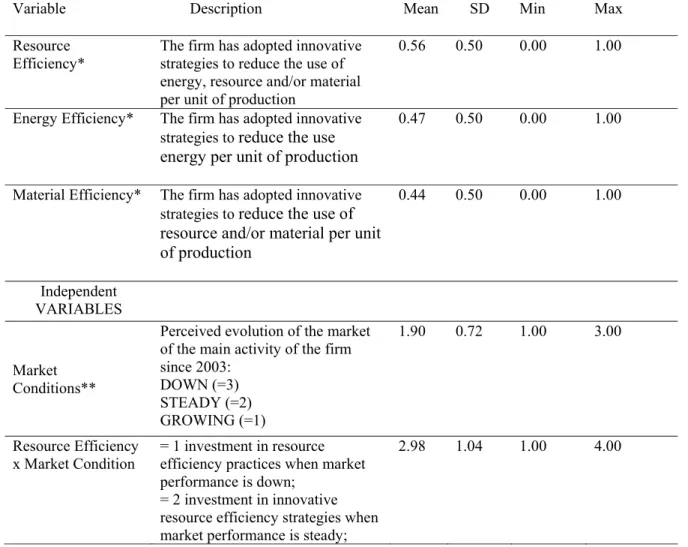
The variables used in estimation, as well as their definitions and sample statistics, are presented in Table 1. No problem of multicollinearity was detected (Appendix 1).
Table 1: Definition of variables and sample statistics
Variable Description Mean SD Min Max
Resource
Efficiency* The firm has adopted innovative strategies to reduce the use of energy, resource and/or material per unit of production
0.56 0.50 0.00 1.00
Energy Efficiency* The firm has adopted innovative strategies to reduce the use energy per unit of production
0.47 0.50 0.00 1.00
Material Efficiency* The firm has adopted innovative strategies to reduce the use of resource and/or material per unit of production 0.44 0.50 0.00 1.00 Independent VARIABLES Market Conditions**
Perceived evolution of the market of the main activity of the firm since 2003: DOWN (=3) STEADY (=2) GROWING (=1) 1.90 0.72 1.00 3.00 Resource Efficiency
x Market Condition = 1 investment in resource efficiency practices when market performance is down;
= 2 investment in innovative resource efficiency strategies when market performance is steady;
Variable Description Mean SD Min Max = 3 investment in innovative
resource efficiency strategies when market performance is growing; = 0 no investment in innovative resource efficiency strategies Cost Leadership
Strategy**
Strategic importance attributed to competitive priced products and services
3.35 0.64 1.00 4.00
Quality/Differentiati
on Strategy** Strategic importance attributed to product and service quality strategy
3.62 0.53 1.00 4.00 Environmental
Standards**
Registered for ISO 14001, organic labeling or fair trade
Dummy variable
0.40 0.49 0.00 1.00
R&D* R&D activities (internal or external) 0.56 0.50 0.00 1.00 Vertical
Integration** Production organized internally 0.88 0.33 0.00 1.00 CONTROLS
Regulation**
Since 2003, the firm has been affected by change in regulations, standards (health, environment, worker rights, etc.)
0.27 0.82 1.00 4.00
Quality Standard** Registered with ISO 9000, EAQF, etc. 0.72 0.45 0.00 1.00 Holding** Belongs to a holding group 0.83 0.37 0.00 1.00 Export*** Share of exports in total sales (€) 0.19 0.27 0.00 1.00
Profit*** Firm profit (€) 4,209 5.49 34,399 4.3 -571,691 6,619,330
Size** Number of employees 2,727.
59
9,824.8 6
18.00 111,956.00
Sector** Agrifood, consumption goods, cars and equipment, intermediate goods, energy, construction, commercial, transport, financial and real-estate activities, business services and individual services
* variables were retrieved from the CIS database; ** variables retrieved from the COI database ;*** variables retrieved from the EAE database.
Estimation Strategy
First, using a logit regression model, we investigate the determinants of firm’s decision to invest in energy resource efficiency strategies. The logit regression takes the following form:
13 * 1 , 1, 2,..., . i i i i i Y X i N
(1)where X represents the vector of variables for investment in energy efficiency strategies such as i market conditions, cost leadership, Environmental Standards, R&D, vertical integration, regulation, quality/differentiation strategy, Quality Standards, holding, export, profit, size, sector activity; 1 13 are slope coefficients to be estimated and
and are the intercept and the disturbance term, respectively. The model of firms’ energy resource efficiency investment choice is stated as a discrete-choice model, with the dummy variables indicating energy resource efficiency investment, as the dependent variablesY : i* 1 0, 0 . i i i Y if Y Y otherwise (2)
We specified logistic distributions for and maximized the log-likelihood of the logit models (Greene, 2003) to estimate models’ parameters up to a positive constant.
Second, to investigate resource efficiency investment under different market conditions, we create a dependent variable, denoted Resource Efficiency x Market Condition. This variable represents whether investments are realized in down, steady or growing market conditions. On the basis of this classification, we have created a variable RE1j that takes the value of 1, if the firm is investing in resource efficiency when the market performance is down; 2, if the firm is investing in resource efficiency when the market performance is steady; 3, if the firm is investing in resource efficiency when the market performance is growing; and 0, if a firm is not investing in resource efficiency.
We assume that firms choose one of the mutually exclusive alternatives characterized by our categorical variable. This variable reflects four distinct unordered alternatives: Resource Efficiency Investment when market performance is down (alternative j = 1), Resource Efficiency
Investment when market performance is steady (j = 2), Resource Efficiency Investment when market performance is down (alternative j = 3) and No Resource Efficiency Investment (j = 0). A multinomial logit model was used to evaluate the impact of the firm’s characteristics on resource efficiency investments.
In the multinomial logit model, the probability that the firm i belongs to the category of investors determined by different market situation j, j =0, 1, 2,3, is defined by:
2 2 0 0 ( ) ( ) Prob( ) ( ) 1 ( ) i j i j i i k i k k k Exp x Exp x RE j Exp x Exp x
(1)where X represents the vector of variables for firm i (cost leadership, ES, R&D, vertical i integration, regulation, quality/differentiation strategy, QS, holding, export, profit, size, sector activity); 1 12 are slope coefficients to be estimated.
Multinomial logit models are valid under the Independence of Irrelevant Alternatives (IIA) assumption that states that the characteristics of one particular choice alternative do not impact the relative probabilities of choosing other alternatives. We perform both the Haussmann and Small-Hsiao tests to test the validity of the IIA assumption. The results of the tests confirm the independence of irrelevant alternatives in all categories.
RESULTS
The descriptive statistics indicate that 3,295 firms representing 56% of the firms in our sample (5,877 firms) invest in resource efficiency strategies divided into 46.70% in energy efficiency, and 44.22% in material efficiency. Out of our sample of 3,295 firms, only 9.87% (580 firms) invest in resource efficiency in down market conditions, as compared to 25.98% (1527 firms), in steady market conditions and 20.21% (1188) in growing market conditions.
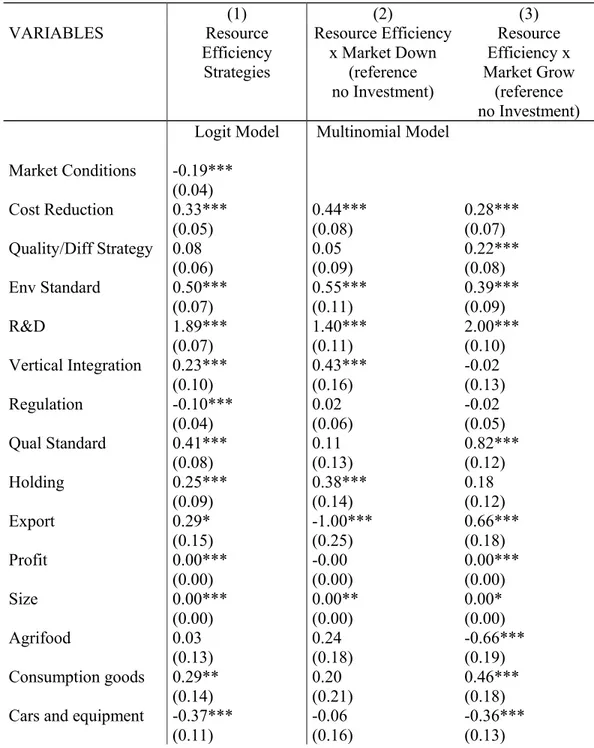
The results of the logit regression and multinomial regressions are presented in Table 2. In the first column, we present the logit results; the second column shows the results of the determinants of resource efficiency investments when the market is down as compared to no investment; the third column shows the determinants of resource efficiency investment when the market is growing compared to the no investment situation.
Table 2: The Determinants of the adoption of energy and resource efficiency strategies
(1) (2) (3) VARIABLES Resource Efficiency Strategies Resource Efficiency x Market Down (reference no Investment) Resource Efficiency x Market Grow (reference no Investment) Logit Model Multinomial Model
Market Conditions -0.19*** (0.04) Cost Reduction 0.33*** 0.44*** 0.28*** (0.05) (0.08) (0.07) Quality/Diff Strategy 0.08 0.05 0.22*** (0.06) (0.09) (0.08) Env Standard 0.50*** 0.55*** 0.39*** (0.07) (0.11) (0.09) R&D 1.89*** 1.40*** 2.00*** (0.07) (0.11) (0.10) Vertical Integration 0.23*** 0.43*** -0.02 (0.10) (0.16) (0.13) Regulation -0.10*** 0.02 -0.02 (0.04) (0.06) (0.05) Qual Standard 0.41*** 0.11 0.82*** (0.08) (0.13) (0.12) Holding 0.25*** 0.38*** 0.18 (0.09) (0.14) (0.12) Export 0.29* -1.00*** 0.66*** (0.15) (0.25) (0.18) Profit 0.00*** -0.00 0.00*** (0.00) (0.00) (0.00) Size 0.00*** 0.00** 0.00* (0.00) (0.00) (0.00) Agrifood 0.03 0.24 -0.66*** (0.13) (0.18) (0.19) Consumption goods 0.29** 0.20 0.46*** (0.14) (0.21) (0.18)
Cars and equipment -0.37*** -0.06 -0.36***
(1) (2) (3) VARIABLES Resource Efficiency Strategies Resource Efficiency x Market Down (reference no Investment) Resource Efficiency x Market Grow (reference no Investment) Energy 0.61*** -0.60 0.74*** (0.27) (0.48) (0.30) Construction 0.86*** -0.85*** 1.36*** (0.16) (0.35) (0.19) Commercial 0.37*** 0.38** -0.17 (0.13) (0.18) (0.18) Transport 0.92*** -0.19 1.41*** (0.14) (0.26) (0.17)
Financial and real
estate 1.91*** -14.24 2.58***
(0.24) (624.11) (0.29)
Services for firms -0.01 -0.65*** 0.30**
(0.12) (0.20) (0.15) Services for individuals 0.63*** -0.12 0.76*** (0.19) (0.31) (0.26) Constant -2.78*** -4.66*** -4.95*** (0.31) (0.48) (0.41) Pseudo R2 0.21 0.15 Correctly classified 73.80% 82.92% 78.83% Observations 5877 5,877 5,877
(*), (**), (***) indicate parameter significance at the 10, 5 and 1 per cent level, respectively.
In column 1, we observe that the variable representing market conditions is negative and significant, indicating that firms are less likely to invest in resource efficiency when market conditions are worse. The marginal effects indicate that constrained market conditions decrease by 5 points a firm's probability of investing in resource efficiency. This confirms hypothesis H1a but contradicts hypothesis H1b.
Furthermore, as expected, firms showing high values for the variables representing cost leadership strategy, investments in environmental standards, R&D and vertical integration are more likely to invest in resource efficiency strategies. This confirms our hypotheses H2a, H3 and H4. However, the quality/differentiation strategy variable is non-significant and H2b is therefore
not confirmed. However this non-significant finding indicates that quality/differentiation oriented firms are not driving the adoption of resource efficiency strategies.
Turning to the control variables, we find that larger firms, with higher shares of exports, that have adopted quality standards, are also more likely to invest in resource efficiency strategies. This confirms previous studies (e.g., Darnall & Edwards, 2006; Schleich, 2009; Pekovic & Galia, 2009; Porter & Van der Linde, 1995; Conrad, 1997; Malueg, 1989; Van Raaij & Verhallen, 1983). The results, regarding the negative and significant coefficient of our variable representing regulation, might indicate that in the context of resource efficiency, changes in regulation might be a barrier to the adoption of innovative strategies (Delmas, 2002). It is possible that such regulatory changes increased the environmental uncertainty and made resource efficiency strategies less attractive.
Regarding the determinants of resource efficiency investments when the market is down, compared to the no investment situation (the second column of Table 2), we observe that cost leadership strategy, environmental standards and internal R&D are significant predictors of investments in resource efficiency strategies. This confirms hypotheses H5a, H5c, and H5d. Similarly, the variable representing vertical integration is positively related to investments in resource efficiency strategies, and this confirms our hypothesis H5e. Overall firms with cost leadership strategy, internal R&D, environmental standards and that are vertically integrated are 24% more likely to adopt resource efficiency strategies when they perceive down market conditions. The variable quality/differentiation strategy is non-significant and therefore not a predictor of the adoption of resource efficiency strategies.
Turning to the control variables, larger firms, and firms belonging to a holding are more likely to invest in resource efficiency strategies, indicating some potential economies of scale associated with the adoption of such strategies. Furthermore, export negatively influences a firm’s probability of investing in resource efficiency when the market is going down.
The third column (Table 2) represents the results related to the determinants of resource efficiency investment when the market is growing, comparing to a no investment situation. export, cost leadership, quality standards, environmental standards, R&D and size are significant, as in the results of the logit estimates (first column). This is not surprising, since these investments represent a larger share of the overall investments. Additionally, profit positively influences a firm’s probability of investing in resource efficiency when the market is growing compared to the no investment situation. Vertical integration is non-significant which is consistent with our argumentation that favored vertical integration in downturn market conditions. The variable regulation is also non-significant, indicating that regulation is not a barrier for managers perceiving growing market conditions. Interestingly, the variable representing quality/differentiation strategy is positive and significant. This indicates that such firms are more likely to invest in resource efficiency strategies in perceived growing marking conditions although to a slightly lesser extent than cost reduction oriented firms.
Our analysis reveals significant differences in investment behavior towards resource efficiency according to the market conditions. Our results yield a number of interesting findings that help us better understand the relationships between market conditions, firm strategy and organization.
Several versions of the model have been investigated to confirm the robustness of our results (Appendix 2). These include an independent estimation of each of the indicators of resource efficiency—namely, reduced energy and material—in four different market situations. The results of this investigation indicate very few significant differences between these two sets of strategies indicating that they follow the same logic.
DISCUSSION AND CONCLUSION
Research indicates that resource efficiency strategies have the potential to lead to cost savings and that such strategies should therefore be more attractive in downturn economic conditions. We found on the contrary that fewer firms (10%) adopt resource efficiency strategies in perceived downturn market conditions as compared to steady or growing conditions (46%). Our goal was to uncover this apparent paradox and understand the set of characteristics of firms that adopt resource efficiency strategies in perceived downturn market conditions in order to provide recommendations to encourage more widespread adoption of such strategies.
Some scholars have argued that depressed market conditions reduce a firm’s willingness to invest in innovation (e.g., Kanerva & Hollanders, 2010). However, while, on the whole, a firms’ investment in innovation declines during a market downturn, a small but significant minority of firms is “swimming against the stream” and increasing their investments in innovative strategies (Filippetti & Archibugi, 2011). Such firms seek opportunities to invest more in constrained economic times, by developing strategies that are environmentally and economically oriented. Our results show the characteristics of such firms in the context of the adoption of resource efficiency strategies.
This paper broadens our understanding of the kind of firm-level resources and capabilities needed to develop models of frugal innovation that do more with less. In the context of resource efficiency strategies, our findings indicate that models of frugal innovation encompass a combination of various firm capabilities and strategies, which impact the likelihood of successful adoption of such innovations. We show that firms are more likely to invest in resource efficiency strategies in downturn market conditions if they are focusing their main strategy on cost leadership, if they have adopted environmental standards, if they have invested in R&D, if they are vertically integrated and of larger size. Firms with such characteristics are twice more likely than the average firm to invest in resource efficiency strategies in downturn conditions.
Our results indicate that investments in resource efficiency strategies are not conducted in isolation, but are part of a set of practices and strategies that potentially reinforce each other. Business models in downturn economic conditions are therefore significantly different from those in economically growing conditions, where resources are more readily available. This article builds on the literature analyzing the organizational factors that impact the adoption of sustainable strategies (Darnall & Edward, 2006; Delmas & Toffel, 2008). It shows that firms adopt different sustainable strategies even when they are experiencing the same depressed economic conditions. The reason for these differences lies into differences in firms’ organizational structures and resources (Aragón-Correa & Sharma, 2003). This research demonstrates the importance of opening the organizational black box to understand firm behavior in different economic conditions.
In addition, we broaden the context of application of the contingency theory. While scholars have used this approach in the context of general proactive strategies (Sharma et al., 2007), we were able to demonstrate its power in the context of much more focused resource efficiency strategies. This is significant because resource efficiency strategies, unlike more general proactive strategies, are expected to have a direct impact on cost savings and therefore somewhat less contingent on the organizational and economic context in which they are implemented. We reveal that resource efficiency strategies are not just “add-ons” that can be plugged into any organization, but rather developed jointly with other capabilities and in specific environmental conditions.
Our results have significant policy implications. Policymakers seeking to encourage corporations to reduce energy and resource use should infuse firms with a comprehensive set of strategies, rather than focusing solely on energy or resource efficiency. The United Nations Environmental Program (UNEP), as part of its resource efficiency program, is investing close to three billion dollars in demonstrating to public and private sector decision-makers that there is a
case to be made for resource efficiency, and in supporting entrepreneurial innovations. UNEP recognizes that managers tend to consider resource efficiency investments as “environmental”; i.e., add-on interventions not related to core business and market competitiveness (UNEP, 2010, p. 621). Our research confirms the need to focus on the synergies between a firm's main strategy and its resource efficiency investments and is useful for managers who seek to improve their efficiency in order to improve their competitiveness. These managers should think about including resource efficiency as part of their core strategy and look for synergies with existing environmental and quality programs.
Our research is not without limitations. First, our analysis was limited to the French context; future research should explore similar questions in an international setting, as scholars have identified international institutional differences regarding the implementation of environmental strategies (Husted, 2005; Husted & Allen, 2006; Darnall et al., 2008; Delmas & Montiel, 2008; Delmas & Montes-Sancho, 2011). Second, our dependent variable represented investments in innovative resource efficiency strategies but did not measure actual efficiency gains. Although such strategies aim at efficiency gains, it would be interesting in the future to measure the effectiveness of such measures. Third, while our database included a rich set of variables that allowed us to control for many organizational characteristics, its cross- sectional nature hampered us from conducting a dynamic analysis. Further research should examine whether the effects identified in this study persist over time, and should further investigate the precise nature of the dynamic interactions between the firm external environment, its main business strategy, resources and organization, and investments in resource efficiency.
Appendix 1: Pearson correlation coefficients Res ourc e Ef ficienc y Res ourc e Ef ficienc y x M ark et Co ndi tio n M ark et Co ndi tio n Cost Lea dership strate gy En v S tandar ds
R&D Vertical Inte
grati on Re gu la ti on Q ua lit y S trateg y Qu al St and ard s Ho ld ing Ex port Pr ofit Si ze Resource Efficiency 1.00 - - - - - - - - Resource Efficiency x Market Condition -0.86* 1.00 - - - - - - - Market Condition -0.14* -0.26 1.00 - - - - - - - Cost Leadership strategy 0.16* -0.14* 0.04* 1.00 - - - - - - - - Env Standards 0.25* -0.20* -0.04* 0.16* 1.00 - - - - - - - - -R&D 0.46* -0.36* -0.13* 0.16* 0.27* 1.00 - - - - - - Vertical Integration 0.07* -0.07* 0.02 0.06* 0.06* 0.09* 1.00 - - - - Regulation 0.01 0.00 -0.01 0.10* 0.05* -0.01 0.03* 1.00 - - - - Qual/Diff Strategy 0.09* -0.06* -0.06* 0.16* 0.09 0.11* -0.03* 0.12* 1.00 - - - - - Qual Standards 0.23* -0.16* -0.13* 0.11* 0.41* 0.27* -0.15* 0.04* 0.13* 1.00 - - - -Holding 0.11* -0.10* 0.00 0.12* 0.18* 0.12* -0.01 -0.02 0.08* 0.18* 1.00 - - - Export 0.20* -0.14* -0.09* 0.19* 0.31* 0.38* 0.07* -0.01* 0.10* 0.27* 0.15* 1.00 - - Profit 0.09* -0.02* -0.09* -0.00 0.09* 0.09* -0.12* 0.04* 0.06* 0.06* 0.02 -0.01 1.00 Size 0.11* -0.06* -0.07* 0.07* 0.16* 0.10* -0.13* 0.12* 0.06* 0.09* 0.05* 0.01 0.60* 1.00 * p < 0.01
Appendix 2: The Determinants of Energy Efficiency and Energy Resource Efficiency Strategies under Different Market Conditions (1) (2) (3) (4) (5) (6) VARIABLES Energy Efficiency Investment vs No Investment Energy Efficiency x Market Down vs No Investment Energy Efficiency x Market Grow vs No Investment Material Efficiency Investment vs No Investment Material Efficiency x Market Down vs No Investment Material Efficiency x Market Grow vs No Investment Market Condition -0.15*** -0.13*** (0.04) (0.04) Cost Leadership Strategy 0.24*** 0.33*** 0.22*** 0.20*** 0.36*** 0.10 (0.05) (0.090) (0.071) (0.05) (0.091) (0.071) Quality/Diff Strat 0.12** 0.16 0.21** 0.21*** 0.01 0.41*** (0.06) (0.104) (0.083) (0.06) (0.100) (0.087) Env. Standards 0.42*** 0.41*** 0.26*** 0.65*** 0.77*** 0.58*** (0.07) (0.120) (0.093) (0.07) (0.120) (0.095) R&D 1.66*** 1.19*** 1.72*** 1.59*** 1.22*** 1.68*** (0.07) (0.123) (0.103) (0.07) (0.123) (0.105) Vertical Integration 0.13 0.65*** -0.30** -0.26*** 0.04 -0.53*** (0.10) (0.196) (0.133) (0.10) (0.177) (0.135) Regulation -0.16*** -0.06 -0.06 -0.06 -0.01 0.09* (0.04) (0.066) (0.052) (0.04) (0.066) (0.053) Qual. Standards 0.44*** 0.19 0.90*** 0.57*** 0.36** 0.80*** (0.08) (0.142) (0.123) (0.08) (0.146) (0.127) Holding 0.08 0.09 0.03 0.10 0.13 0.08 (0.09) (0.153) (0.119) (0.09) (0.157) (0.124) Export 0.54*** -0.72*** 0.84*** 0.46*** -0.87*** 0.73*** (0.14) (0.257) (0.182) (0.14) (0.259) (0.182) Profit 0.00 -0.00*** 0.00 0.00*** -0.00*** 0.00*** (0.00) (0.000) (0.000) (0.00) (0.000) (0.000) Size 0.00*** 0.00*** 0.00*** -0.00 0.00 -0.00*** (0.00) (0.000) (0.000) (0.00) (0.000) (0.000) Agrifood -0.06 0.20 -0.80*** -0.08 0.08 -0.74*** (0.12) (0.183) (0.203) (0.12) (0.192) (0.193) Consumption goods 0.13 0.04 0.45** 0.56*** 0.56** 0.66*** (0.14) (0.227) (0.177) (0.14) (0.221) (0.179) Cars and equipment -0.46*** -0.11 -0.41*** -0.36*** 0.02 -0.39*** (0.10) (0.168) (0.134) (0.10) (0.168) (0.134) Energy 1.16*** -0.05 1.36*** -0.39* -1.53*** -0.76** (0.25) (0.481) (0.288) (0.21) (0.542) (0.294) Construction 1.27** -0.45 1.75*** 0.25* -1.89*** 0.71*** (0.16) (0.347) (0.189) (0.15) (0.476) (0.185) Commercial 0.22* 0.39** -0.36* 0.27*** 0.36* -0.23 (0.12) (0.191) (0.196) (0.12) (0.197) (0.188) Transport 1.11*** -0.21 1.61*** 0.02 -0.69** 0.30 (0.14) (0.286) (0.175) (0.14) (0.295) (0.189)
Financial and real estate
1.97*** -14.41 2.58*** 0.18 -14.37 0.57*
(0.23) (708.765) (0.281) (0.24) (478.115) (0.304)
Services for firms -0.34*** -1.39*** 0.02 -0.05 -0.48** 0.09
Services for individuals 0.92*** 0.17 1.05*** 0.28 -0.42 0.32 (0.19) (0.322) (0.260) (0.19) (0.383) (0.277) Constant -2.68*** -4.85*** -4.63*** -2.97*** -4.32*** -5.04*** (0.30) (0.531) (0.414) (0.31) (0.516) (0.429) R2 0.19 0.14 0.18 0.14 Correctly classified 71.70% 87.09% 80.14% 71.87% 87.71% 80.94% Observations 5,877 5,877 5,877 5,877 5,877 5,877
34 REFERENCES
Abell, D.F., 1978. Strategic Windows. Journal of Marketing 42, 21−26.
Ambec, S.; Lanoie, P., 2008. When and Why Does It Pay To Be Green. Academy of Management Perspective 23, 45-62.
Anderson, E., 1988. Transaction costs as determinants of opportunism in integrated and independent sales forces. Journal of Economic Behavior and Organization 9, 247–264. Andrews, K., 1971. The Concept of Strategy. Irwin, Homewood, IL.
Aragón-Correa, J.A.; Rubio-López, E.A., 2007. Proactive corporate environmental strategies: Myths and misunderstandings. Long Range Planning 40(3), 357-381.
Aragon-Correa, J.A.; Sharma, S., 2003. A Contingent Resource-Based View of Proactive Corporate Environmental Strategy. Academy of Management Review 28, 71-88.
Arny, M.; Clemmer, S.; Olson, S., 1998. The Economic and Greenhouse Gas Emission Impacts of Electric Energy Efficiency Investments: Report 4 of the Wisconsin Greenhouse Gas Emission Reduction Cost Study. The Consortium for Integrated Resource Planning/University of Wisconsin/Leonardo Academy Inc. for the US Department of Energy and Oak Ridge National Laboratory, Wisconsin.
Bailey, G.; Szerdy, J., 1988. Is there life after downsizing? Journal of Business Strategy 9(1), 8– 11.
Berkhout, P.H.G.; Muskens, J.C.; Velthuijsen, J.W., 2000. Defining the rebound effect. Energy Policy 28, 425-432.
Blass, V.; Corbett, C.J.; Delmas, M.; Muthulingam, S., 2011. Top Management Involvement in the Adoption of Energy Efficiency Projects. UCLA: Institute of the Environment and Sustainability. Retrieved from: http://escholarship.org/uc/item/0018v62d
Blumstein, C.; Krieg, B.; Schipper, L.; York, C., 1980. Overcoming Social and Institutional Barriers to Energy Conservation. Energy 5, 355- 371
Boyle, R.; Desai, H., 1991. Turnaround strategies for small firms. Journal of Small Business Management 29(3), 33–43.
Brunnermeier, S.B.; Cohen, M.A., 2003. Determinants of environmental innovation in US manufacturing industries. Journal of Environmental Economics and Management 45(2), 278-293.
Carraro, C.; Gallo, M.; Galeotti, M., 1996. Environmental Taxation and Unemployment: some Evidence on the Double Dividend Hypothesis in Europe. Journal of Public Economics 6, 148-182.
Christmann, P.; Taylor, G., 2001. Globalization and the Environment: Determinants of Firm Self-Regulation in China. Journal of International Business Studies 32(3), 439-458. CIS, 2008. Enquête communautaire sur l'innovation, Institut national de la statistique et des
35
http://www.insee.fr/fr/methodes/default.asp?page=sources/sou-enq-communaut-innovation-cis.htm
Clinch, J.P.; Healy, J.D., 2000. Cost-benefit analysis of domestic energy efficiency. Energy Policy 29(2), 113-124.
Cohen, W.; Levinthal, D., 1990. Absorptive Capacity: A New Perspective on Learning and Innovation. Administration Science Quarterly 35(1), 128-152.
COI, 2006. Changement organisationnel et informatisation, Institut national de la statistique et des études économiques (INSEE), Centre d'études de l'emploi (CEE), Direction de l'animation de la recherche, des études et des statistiques (DARES), Paris, France. www.enquetecoi.net
Conrad, K., 1997. An Econometric Model of Production with Endogenous Improvement in Energy Efficiency 1970–1995. Manheim University Department of Economics.
Darnall, N.; Edwards Jr., D., 2006. Predicting the cost of environmental management system adoption: the role of capabilities, resources and ownership structure. Strategic Management Journal 27(4), 301–320.
Darnall, N.; Gallagher, D.R.; Andrews, R.N.L.; Amaral, D., 2000. Environmental Management Systems: Opportunities for Improved Environmental and Business Strategy? Environmental Quality Management 9(3), 1-9.
Darnall, N.; Henriques, I.; Sadorsky, P., 2008. Do Environmental Management Systems Improve Business Performance in the International Setting? Journal of International Management 14(4), 364-376.
Day, G.S., 1984. Strategic Market Planning: The Pursuit of Competitive Advantage. West Group, St. Paul.
DeCanio, S.J., 1993. Barriers within firms to energy-efficient investments. Energy Policy 21(9), 906-914.
Delmas, M.; Hoffmann V.; Kuss, M., 2011. Under the Tip of the Iceberg: Absorptive Capacity, Environmental Strategy and Competitive Advantage. Business & Society 50(1), 116-154. Delmas, M., 2001. Stakeholders and Competitive Advantage: the case of ISO 14001. Production
and Operation Management 10(3), 343-358.
Delmas, M., 2002. Innovating against European rigidities: Institutional Environment and Dynamic Capabilities. Journal of High Technology Management Research 13(1), 18-42. Delmas, M., 2002. The Diffusion of Environmental Management Standards in Europe and in the
United States: an institutional perspective. Policy Sciences 35(1), 1-119.
Delmas, M.; Montes-Sancho, M., 2010. Voluntary Agreements to Improve Environmental Quality: Symbolic and Substantive Cooperation. Strategic Management Journal 31(6), 576-601.
Delmas, M.; Montes-Sancho, M., 2011. US State Policies for Renewable Energy: Context and Effectiveness. Energy Policy 39, 2273-2288.
Delmas, M.; Montiel, I., 2008. The Diffusion of Voluntary International Management Standards: Responsible Care, ISO 9000 and ISO 14001 in the Chemical Industry. Policy Studies Journal 36(1), 65-93.
36
Delmas, M.; Montiel, I., 2009. Greening the Supply Chain: When is Customer Pressure Effective? Journal of Economics and Management Strategy 18(1), 171-201.
Delmas, M.; Russo, M.; Montes-Sancho, M., 2007. Deregulation and Environmental Differentiation in the Electric Utility Industry. Strategic Management Journal 28(2), 189-209.
Delmas, M.; Toffel, M., 2008. Organizational Responses to Environmental Demands: Opening the Black Box. Strategic Management Journal 29(10), 1027-1055.
Dixit, A.; Pindyck, R., 1994. Investment Under Uncertainty. Princeton University Press, Princeton.
EAE, 2006. Enquête annuelle d'entreprise dans le commerce, Institut national de la statistique et des études économiques (INSEE), Paris, France.
http://www.insee.fr/fr/methodes/default.asp?page=definitions/enquete-annuelle-entreprises.htm
Expert Group on Energy Efficiency, 2007. Realizing the Potential of Energy Efficiency: Targets, Policies, and Measures for G8 Countries. United Nations Foundation, Washington, DC, p. 72.
Filippetti, A.; Archibugi, D., 2011. Innovation in times of crisis: National Systems of Innovation, structure, and demand. Research Policy 40, 179-192.
Florida, R.; Davison, D., 2001. Gaining from Green Management: Environmental Management Systems Inside and Outside the Factory. California Management Review 43(3), 64-84. Freeman, C.; Clark, J.; Soete, L., 1982. Unemployment and Technical Innovation. Frances
Pinter, London.
Ginsberg, A.; Venkatraman, N., 1985. Contingency Perspectives of Organizational Strategy: A Critical Review of the Empirical Research. Academy of Management Review 10, 421-434. Golove, W.H.; Eto, J.H., 1996. Market Barriers to Energy Efficiency: A Critical Reappraisal of the Rationale for Public Policies to Promote Energy Efficiency, Energy & Environment Division. Lawrence Berkeley National Laboratory, University of California, Berkeley, California 94720 LBL-38059, UC-1322, p. 1-55.
Greene, W.H., 2003. Econometric Analysis, 5th Edition. Prentice Hall, New York.
Hamel, G.; Prahalad, C.K., 1994. Competing for the Future. Harvard Business School Press, Boston, MA.
Hart, S.L., 1995. A Natural-Resource-Based View of the Firm. Academy of Management Review 20(4), 986-1014.
Hart, S.L.; Milstein, M., 2003. Creating Sustainable Value. Academy of Management Executive 17(2), 14–56.
Hart, S.L., 2005. Capitalism at the Crossroads: The Unlimited Business Opportunities in Solving the World's Most Difficult Problems. Wharton School Publishing, Upper Saddle River, NJ.
Henriques, I.; Sadorsky, P., 1996. The Determinants of an Environmentally Responsive Firm: An Empirical Approach. Journal of Environmental Economics and Management 30, 381-395.
37
Henriques, I.; Sadorsky, P., 1999. The Relationship Between Environmental Commitment and Managerial Perceptions of Stakeholder Importance. Academy of Management Journal 42(1), 87-99.
Hinterberger, F.; Luks, F.; Schmidt-Bleek, F., 1997. Material flows vs. ‘natural capital’: What makes an economy sustainable? Ecological Economics 23, 1-14.
Hofer, C.; Schendel, D., 1978. Strategy Formulation: Analytical Concepts. West Publishing, St. Paul, MN.
Holm, S.-O.; Englund, G., 2009. Increased ecoefficiency and gross rebound effect: Evidence from USA and six European countries 1960-2002. Ecological Economics 68(3), 879-887. Howarth, R.B.; Sanstad, A.H., 1995. Discount Rates and Energy Efficiency. Contemporary
Economic Policy 13, 101-109.
Husted, B.W., 2005. Culture and ecology: a cross-national study of the determinants of environmental sustainability. Management International Review 45(3), 349–371.
Husted, B.W.; Allen, D.B., 2006. Corporate social responsibility in the multinational enterprise: strategic and institutional approaches. Journal of International Business Studies 37(6), 838-849.
IPCC, Climate Change, 2007. The Physical Science Basis Contribution of Working Group I to the Fourth Assessment Report of the Intergovernmental Panel on Climate Change. Cambridge University Press, Cambridge.
Jaffe, A.B.; Stavins, R.N., 1994. The Energy Efficiency Gap: What Does It Mean? Energy Policy 22(10), 804-810.
Kablan, M.M., 2003. Energy conservation projects implementation at Jordan’s industrial sector: a total quality management approach. Energy 28, 1533-1543.
Kanerva, M.; Hollanders, H., 2009. The Impact of the Economic Crisis on Innovation. Analysis based on the Innobarometer 2009 Survey. Thematic Paper, European Commission, D.G. Enterprises, Brussels.
Klassen, R.D.; Whybark, D.C., 1999. The Impact of Environmental Technologies on Manufacturing Performance. Academy of Management Journal 42(6), 599-615.
Kounetas, K.; Tsekouras, K.D., 2008. The Energy Efficiency Paradox Revisited through a Partial Observability Approach. Energy Economics 30, 2517-2536.
Ley, M., 2010. Insights into the Determinants of Innovation in Energy Efficiency. KOF Working Papers No. 266, September, Zurich.
Lilien, G.; Yoon, E., 1990. The Timing of Competitive Market Entry: An Exploratory Study of New Industrial Products. Management Science 36, 568−596.
Majumdar, S.K.; Marcus, A.A., 2001. Rules Versus Discretion: The Productivity Consequences of Flexible Regulation. Academy of Management Journal 44, 170-179.
Malueg, D.A., 1989. Emission credit trading and the incentive to adopt new pollution abatement technology. Journal of Environmental Economics and Management 16, 52-57.
Marcus, A.A.; Geffen, D., 1998. The dialectics of competency acquisition: pollution prevention in electric generation. Strategic Management Journal 19, 1145-1168.