HAL Id: hal-02483189
https://hal-mines-albi.archives-ouvertes.fr/hal-02483189
Submitted on 18 Feb 2020
HAL is a multi-disciplinary open access
archive for the deposit and dissemination of
sci-entific research documents, whether they are
pub-lished or not. The documents may come from
teaching and research institutions in France or
abroad, or from public or private research centers.
L’archive ouverte pluridisciplinaire HAL, est
destinée au dépôt et à la diffusion de documents
scientifiques de niveau recherche, publiés ou non,
émanant des établissements d’enseignement et de
recherche français ou étrangers, des laboratoires
publics ou privés.
Classification using a three-dimensional sensor in a
structured industrial environment
Ivan Mikhailov, Igor Jovančević, Nour Islam Mokhtari, Jean-José Orteu
To cite this version:
Ivan Mikhailov, Igor Jovančević, Nour Islam Mokhtari, Jean-José Orteu. Classification using a
three-dimensional sensor in a structured industrial environment. Journal of Electronic Imaging, SPIE and
IS&T, 2020, 29 (04), pp.041008. �10.1117/1.JEI.29.4.041008�. �hal-02483189�
Classification using a three-dimensional sensor
in a structured industrial environment
Ivan Mikhailov,
aIgor Jovancevic,
b,*
Nour Islam Mokhtari,
band
Jean-José Orteu
caUniversité de Bourgogne, Centre Universitaire Condorcet, Le Creusot, France bDIOTASOFT, Labège, France
cUniversité de Toulouse, Institut Clément Ader, CNRS, IMT Mines Albi, INSA, UPS,
ISAE, Albi, France
Abstract.
Usage of a three-dimensional (3-D) sensor and point clouds provides various benefits over the usage of a traditional camera for industrial inspection. We focus on the development of a classification solution for industrial inspection purposes using point clouds as an input. The developed approach employs deep learning to classify point clouds, acquired via a 3-D sensor, the final goal being to verify the presence of certain industrial elements in the scene. We possess the computer-aided design model of the whole mechanical assembly and an in-house developed localization module provides initial pose estimation from which 3-D point clouds of the elements are inferred. The accuracy of this approach is proved to be acceptable for industrial usage. Robustness of the classification module in relation to the accuracy of the localization algorithm is also estimated.Keywords:three-dimensional point cloud; three-dimensional scanner; classification; robotized industrial inspection; neural networks.
1 Introduction
1.1 Problem Statement and Hardware Setup
Our main objective is to perform automatic visual inspection of a mechanical assembly by using a three-dimensional (3-D) scanner. This includes checking if the assembly (an airplane engine, for example) is in a state corresponding to its 3-D computer-aided design (CAD) model speci-fication and consequently providing a report to an operator with a list of objects of interest and their statuses. This work is focused on the verification of the presence of the elements, typically metallic supports whose sizes vary from 5 to 15 cm.
The sensor used for this task is an Ensenso N35. It is a 3-D sensor mounted on a robot end-effector. The setup is shown in Fig. 1. We rely on an in-house-developed model-based two-dimensional (2-D)–3-D alignment method in order to obtain an initial guess of the relative pose of our sensor with respect to the assembly being inspected.
Our inspection module requires as accurate as possible pose estimation in order to properly observe or focus on an element of interest. However, our pose estimation module has limited accuracy. This comes from the fact that robot-based inspection platform is a complex system, each part of which introduces a certain degree of calibration error, which gradually accumulates. In addition, the robot is moving while performing the inspection. For all of these reasons, in some cases, the final pose estimation might not be accurate enough. Therefore, it is important to combat these difficulties due to the fact that they directly affect the system’s performance. In the system discussed in this paper, there are two available directions of improvement for the overall system’s accuracy:
• Make classification more robust to the noisy pose, i.e., when there is an error present in a pose estimation phase [the region of interest (ROI) is placed in a way that the object to be inspected is only partially visible].
• Improvement of the pose estimation approach directly.
The main goal of this work is the first direction: development of a classification approach with the pose estimation as it is, i.e., the approach should be suitable for usage with pose esti-mation errors being present. Therefore, this classification solution was evaluated on cases with different levels of noise in the pose estimation results.
1.2 Related Work
Automatic visual inspection (AVI) is gaining popularity due to the development of affordable 2-D and 3-D sensors as well as new software solutions. There are numerous application fields where development and integration of AVI systems is actively ongoing, including automobile industry,1structure damage evaluation,2inspection of the textile materials,3quality inspection of food products,4and inspection of printed circuit boards.5Many of these solutions rely on differ-ent approaches from convdiffer-entional image processing.6,7 AVI in industry is also a topic of our earlier publications, which propose various solutions for existing problems in the field.8–11
There is another direction from which the problem of AVI can be tackled. Machine learning techniques are currently gaining an influx of attention in the computer vision community, pro-viding more generalization for some of the tasks. Many works applied machine learning for inspection types of tasks, such as surface defect inspection,12 AVI of machine components,13 and AVI of microdrill bits in printed circuit board production.14With the rise of the interest in deep learning, this specific technology was also applied to a wide range of AVI tasks, for example, structural inspection,15surface defect detection and recognition,16defect classification system,17and others.18–21Even design tools for the creation of deep convolutional networks for AVI were developed.22 To conclude, deep learning is being applied to a wide range of tasks inside the AVI field, starting with detection, classification, and recognition for the purpose of defect inspection and finishing with full-scale automated production support.23
Classification is a process of assigning a class or a label to an entity, the representation of which depends on the data used. In this paper, classification of 3-D point clouds has been per-formed. There are many works presented for the classification of point clouds with the use of traditional computer vision approaches. Usually, such works are based on a pipeline, which can be generalized to extract salient features from the clouds, followed by generation of descriptors and their consequent comparison to the ones previously extracted from a reference object or a set of objects of interest. In this case, the approaches mostly differ by the algorithms used at each step of the said pipeline (e.g., which key-point extraction or description-matching method to use) and the treatment of data (e.g., usage of transformations to different representations).24–26 Fig. 1 (a) Robot-based inspection system with three cameras mounted on an end effector and (b) Ensenso N35 3-D sensor.
Some of the methods used, depending on the field, are presented in the following works: classification of point cloud data by using local neighborhood statistics,27,28usage of geometric features for classification,29 employment of a covariance descriptor for classification,30 and others.31–33
Currently, deep learning in the imaging domain mostly focuses on treating 2-D images for various purposes. Usages of other types of data, including point clouds, for the purpose of deep learning are being researched, but they are still underrepresented. Nevertheless, many publica-tions are discussing deep learning on point clouds and possible network designs and correspond-ing approaches, for example, segmentation-based classification in the road environment,34 treatment of LiDAR data of urban objects,35airborne data,36and others.37
As indicated in this section, similar works mostly deal with surface inspections using 3-D sensors for industry. For nonindustrial approaches, classification using 3-D is usually done on household objects (e.g., ModelNet40 dataset).38Our work features a deep learning approach for classification of point clouds in an industrial environment.
There are several main directions in the development of deep learning on point clouds that can be followed:
• deep learning on unordered sets (raw point clouds),
• deep learning on multiview data representation, and
• deep learning on volumetric representation.
Out of these directions, deep learning on unordered sets and also deep learning on multiview data representation currently show the highest performance. This work strongly relies on the state-of-the-art achievements in deep learning on unordered sets. Specifically, a concept from a paper“PointNet: deep learning on point sets for 3D classification and segmentation” will be used.39The cited paper introduces a type of neural network that directly consumes point clouds and provides a unified architecture for three modes: classification, part segmentation, and scene semantic parsing.
PointNet manages to extract the so-called set of critical points from each object, which it uses to differentiate between them. A set of critical points can be roughly called a skeleton of the object. While critical points jointly determine the global shape feature for a given object, any point cloud that falls between the critical points set and the upper bound shape gives exactly the same feature. This emphasizes the robustness of PointNet, meaning that losing some noncritical points does not change the global shape signature.39
2 Methodology
PointNet is used as a network for our classification task. This section covers all the steps taken for the task at hand, starting with prior organization of the data and corresponding information about the network. Results will be discussed in Sec.3.
2.1 Dataset
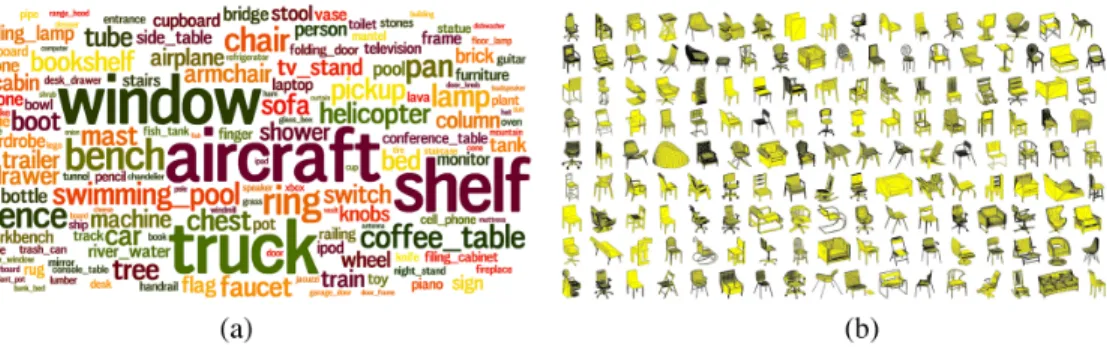
We have trained PointNet with a ModelNet40 dataset.38It contains 12,311 CAD models from 40 man-made object classes, split into 9843 models for training and 2468 models for testing. Available classes and some models from one of the classes (class“Chair”) as an example are shown in Fig.2.
2.2 Industrial Dataset Generation
As shown in Fig.2, ModelNet40 dataset consists mostly of nonindustrial objects. It represents different objects we can find in our everyday life. Considering the domain at hand (e.g., mechani-cal assembly of an aircraft engine), first, a relevant dataset should be created.
We first implemented a pipeline to adapt our industrial dataset to the input expected by PointNet system. It is shown in Fig. 3.
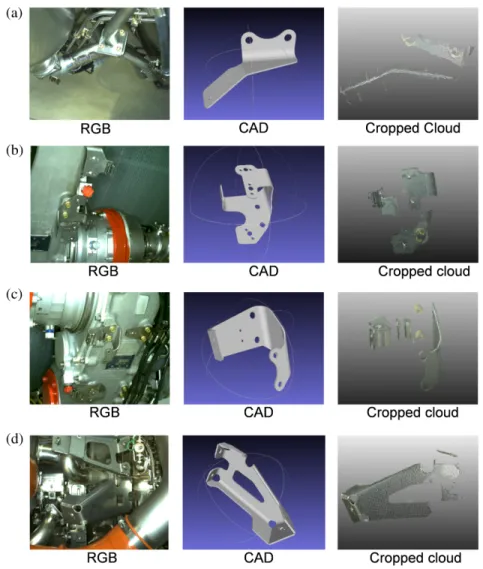
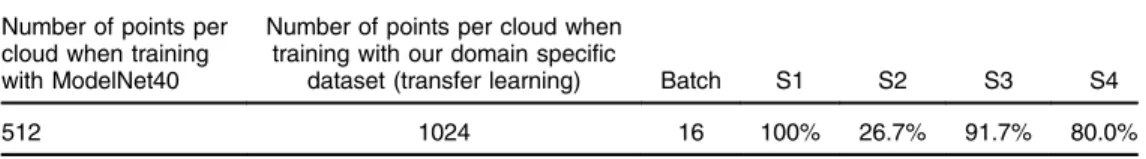
First, initial data, obtained with the Ensenso N35 sensor, is converted to point clouds. One of the resulting examples in comparison with the regular scene image in RGB is shown in Fig.4. The data used in this paper features four industrial objects or, specifically,“supports”—one at each scene (e.g., see Fig.4). To form the said dataset, a 3-D annotation tool was implemented to crop the ROI in point cloud scenes (crop the objects of interest out of the scene) using a movable 3-D box. Each scene is cropped only once, to extract the corresponding support. These four supports form four classes of our dataset that will be fed to PointNet. Cropping results are shown in Fig.5along with the RGB images of the corresponding scenes from which the crops and CAD models of the objects in question were obtained.
Fig. 3 Steps for industrial dataset generation and preparation of data for PointNet. Fig. 2 (a) Cloud of classes, bigger word marks class with more samples and (b) some samples from class“Chair.”
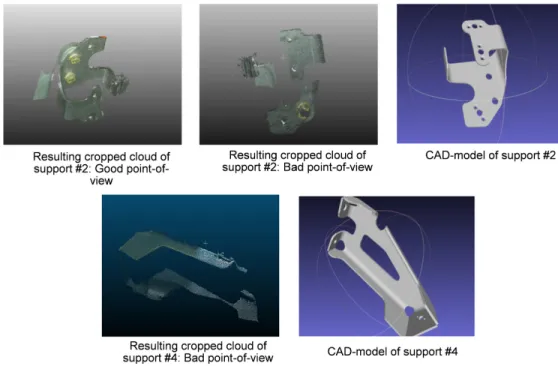
It is important to note that the quality of point clouds varies, depending on the scene and lighting conditions. Namely, parts of the support can be missing due to a not favorable point of view (causing occlusion) or poor scanning (e.g., because of reflective materials). In the case of support #2 shown in Fig.6, two examples of point clouds are provided—one acquired with a favorable point of view and the other with the one that is less informative, which leads to missing points due to auto-occlusion of the object by itself. In addition, a CAD model of the support is shown for reference. The same problem for support #4 is also showcased. Sometimes this issue cannot be solved in an industrial environment, since the assemblies, as shown in Fig.5, have complicated structure. This does not allow to obtain a satisfactory point of view for each chosen element of interest, since it might be unsuitably positioned and be subject to severe occlusion by other pieces. The solution proposed in this paper is developed with this limitation in mind.
To showcase the point-of-view issue, an example of the resulting crops of supports #2 and #4 is shown in Fig.6, which represents a cloud with missing parts.
The original shape of the support is shown in Fig.7in the form of a CAD model (to observe the final size of our manually produced training and testing set per class, refer to Fig. 7).
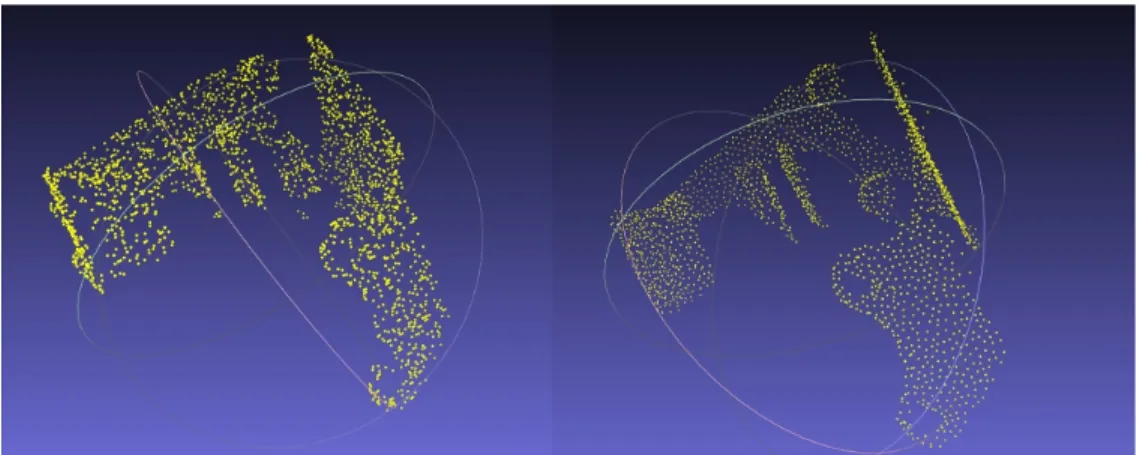
To match the ModelNet40 dataset format and the input format of PointNet, the clouds should be downsampled to 2048 points. For this purpose, initially, random sampling was used, which was made available by MeshLab.40Results of downsampling and comparison with the original crop are shown in Fig.8.
As can be seen, random sampling does not preserve the structure of the cloud. For this reason, the farthest point sampling (FPS) algorithm was employed. It shows much better results in
comparison with a random sampling approach. FPS preserves the structure of the cloud, which is shown in Fig.9.
It is important to mention that PointNet by itself can internally perform a downsampling of a point cloud given to it as an input. Nevertheless, the points are selected randomly, which can be
Fig. 7 Final training and testing set for all classes along with their CAD models.
Fig. 8 (a) Original and (b) downsampled (random sampling) clouds of the support. Fig. 6 Examples of point-of-view issue—supports #2 and #4.
viewed as a further random sampling from 2048 to a prespecified size (1024/512/256 or 128 points). Lower numbers of points (higher levels of downsampling) allow to perform training faster, while the resulting classification accuracy is negatively affected, which is discussed in Sec.3. The whole downsampling pipeline is shown in Fig.10. We will specify our experi-ments and our final choice of the cloud size in Sec.3.
It is important to note that data augmentation of training data in the form of rotation and jittering was applied using PointNet. Rotation was performed randomly around one axis placed in the center of the support. Jittering refers to a random displacement of each point of a point cloud by a small value. Both of these augmentation steps positively affect generalization capa-bilities of the network. The corresponding sizes of the final training sets after data augmentation for each support can be observed in Fig.11.
3 Results and Analysis
3.1 Experiments with PointNet
Based on the limited amount of data being available and prior experiments with PointNet, trans-fer learning was chosen as a learning method for this task. PointNet is first trained with original
Fig. 10 Generalized developed cloud processing pipeline for usage with PointNet.
Fig. 11 Training set sizes for all four classes after applying data augmentation with PointNet along with their CAD models.
ModelNet40 dataset, which features nonindustrial objects. Afterward, the obtained weights are used for transfer learning with the aforementioned newly generated industrial dataset. It is impor-tant to note that for both training the whole network with ModelNet40 dataset and transfer learn-ing with the relevant industrial dataset, it is possible to choose the size of the point clouds. This is done by changing downsampling parameters. Therefore, while discussing the experiments’ results, the number of points used will be specified additionally.
3.1.1 Training two fully connected layers
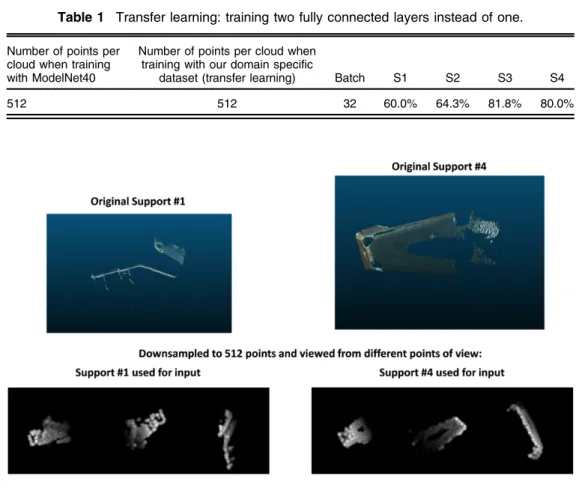
For the first experiment, corresponding parameters and accuracy can be found in Table1, where:
• the column “Number of points per cloud when training with ModelNet40” will signify which size of point clouds was used for training with ModelNet40 dataset in order to get weights for transfer learning;
• the column“Number of points per cloud when training with our domain specific dataset (transfer learning)” states which size of point clouds was used during transfer learning for both training and testing sets. This amount can reach 2048 points maximum, due to the used PointNet setup;
• the column“Batch” shows batch size;
• the columns S1 to S4 feature resulting classification accuracies for each of the four classes (supports).
Results of the first experiment, training two fully connected layers, chosen based on the amount of data available, is shown in Table1
Misclassified examples for this experiment can be observed in Fig.12. It can be seen that one of the good acquisitions of support #2 is misclassified, as well as a comparatively worse
Table 1 Transfer learning: training two fully connected layers instead of one.
Number of points per cloud when training with ModelNet40
Number of points per cloud when training with our domain specific
dataset (transfer learning) Batch S1 S2 S3 S4
512 512 32 60.0% 64.3% 81.8% 80.0%
acquisition of support #1. While observing the resulting accuracies, it must be noted that sup-ports #1 and #2 have very variable data. This means that acquisitions of point clouds for these supports have very variable points of view due to their placement in the assembly. This resulted in unstable quality of point clouds.
Owing to the aforementioned factors, after downsampling, some supports from different classes may look quite similar. This happens due to the loss of information caused by down-sampling. For example, for this experiment, only 512 points out of the initial 30,000 to 50,000 were given to the network to match ModelNet40 and PointNet convention. Nevertheless, this experiment showed positive results and can be a good baseline for further ones.
3.1.2 1024 points for training and testing with lower batch size
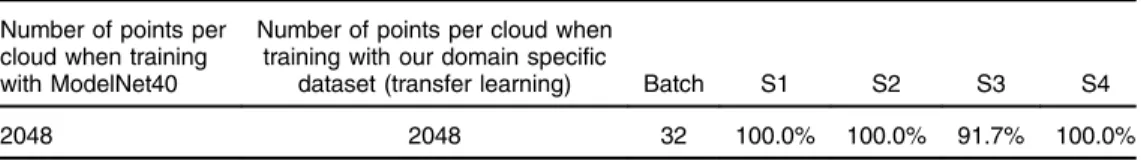
For this experiment, the algorithm was tested with clouds that contain 1024 points (both training and testing) but with a reduced batch size. This was done to evaluate the importance of the number of points per cloud and batch size for the network. The results and parameters are pro-vided in Table2.
It can be seen that there is a big improvement over the previous experiment’s results. Support #1 improved by 40%, support #3 improved by 9.9%, while support #4 kept the same accuracy— 80%—and support #2 lost 37.6%. This leads to two important conclusions.
• First, it is confirmed that support #1 became similar to support #2 due to a low number of points used previously, which negatively affected classification results. The increase in the number of points drastically improved the accuracy for support #1, hence this conclusion is viable.
• Batch size strongly affects the performance of PointNet.
Following these conclusions and a manual checkup of the available data for support #2, it can be declared that clouds put in the training set for this support were not representative enough for all cases present in the testing set. This issue results from the fact that initial training/testing set separation was done only once for all experiments covered so far, and the choice of whether a certain cloud belonged to the training or to the testing set was random. As a result, each already-discussed experiment had the same data used for training and testing sets from one experiment to another, but the initial decision, where each of the exemplars belonged, was made randomly. To solve this issue, it was decided to select the training set data in such a way that it will be representative, i.e., allow the network to observe the most diversity from the available data. Therefore, point clouds for this support were sorted based on their qualities into seven groups. From each group, 80% were taken for training and 20% for testing. Furthermore, examples, which did not fit into any of the groups, were put in a testing set to test the network’s gener-alization capabilities.
3.1.3 Using weights from training ModelNet40 with 2048 points and manual
training and test sets segregation
In this and further experiments, the weights from training PointNet with ModelNet40 were acquired using 2048 points for each point cloud, showcasing an increase in the number of points per cloud in comparison with previous experiments. In addition, manual sorting of the data to create a representative training set for support #2 was done as described above. This led to the results that can be observed in Table3.
Table 2 Transfer learning: 1024 points for training and testing with lower batch size.
Number of points per cloud when training with ModelNet40
Number of points per cloud when training with our domain specific
dataset (transfer learning) Batch S1 S2 S3 S4
Based on the results observed, there are some important remarks that need to be made.
• Considering the previously low accuracy score for support #2, it is important to note that the low number of points in a cloud was not the only reason for poor accuracy results. As a result of manual forming of the training set and an increase in the number of points being used, the accuracy has substantially improved.
• It can be seen that the batch size is confirmed to be very important for PointNet. Therefore, the batch size was selected empirically based on the specifications of PointNet and con-ducted experiments, which contributed to overall improvement of accuracy.
3.1.4 Usage of farthest point sampling instead of random sampling
Following the previous results, a different sampling algorithm was used—FPS. This algorithm excels at preserving the meaningful structure of the cloud compared to random sampling. Corresponding results can be observed in Table4.
Some remarks on the results achieved should be made:
• It is confirmed that a clear structure of a cloud and, hence, FPS, positively affects the performance of PointNet.
• In addition, it is important to note that FPS is generally fast when used on clouds with fewer than 35,000 points, amounting to less than a second per cloud on average. To speed up the processing of clouds with more than 35,000 points, it is possible to use a two-step downsampling for each cloud: first, random sampling is used to reduce the number of points below 35,000. Then, FPS is performed. This two-step approach makes FPS usable in real time even on clouds with more than 35,000 points. This might be beneficial if usage of bigger clouds becomes desirable.
Improvement, shown during this experiment, confirms that even when the dataset features clouds that are only parts of the object itself—given some key shape features are preserved— good classification accuracy can still be achieved.
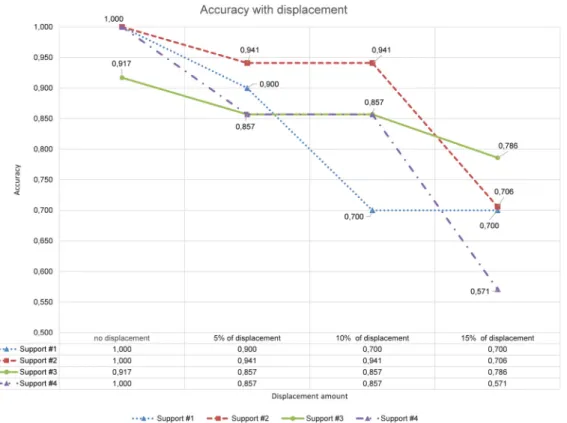
3.2 Robustness to Noise
Estimation of the ability of the network to classify point clouds with the absence of a part of the cloud is crucial to the task at hand. It is based on the fact that the bounding box marking the object of interest (e.g., support) in the scene, which at the runtime will be given using 2-D camera through CAD-based tracking, is not accurate to a certain degree. Evaluation of the maximum amount of displacement of the bounding box in relation to the real position of the object of
Table 4 Transfer learning: usage of FPS instead of random sampling.
Number of points per cloud when training with ModelNet40
Number of points per cloud when training with our domain specific
dataset (transfer learning) Batch S1 S2 S3 S4
2048 2048 32 100.0% 100.0% 91.7% 100.0%
Table 3 Transfer learning: using weights from training ModelNet40 with 2048 points and manual train and test sets segregation.
Number of points per cloud when training with ModelNet40
Number of points per cloud when training with our domain specific
dataset (transfer learning) Batch S1 S2 S3 S4
interest in the scene will allow to estimate and further improve the performance of the network in relation to noisy pose.
For this purpose, the classification approach is evaluated with damaged data. It is important to note that the damaging process is applied only to the testing set, while the training set stays the same as described in the last classification experiment. The damaging process is based on the idea of the noise being introduced in the positioning of the bounding box, simulating the result of obtaining a wrong pose. The bounding box, which crops the element of interest out, is displaced randomly by the following rules:
• The bounding box is moved from its original position, which results in certain parts of the element of interest being absent and an increase in the number of outliers.
• The movement of the bounding box is done by using random vectors fx; y; zg where fx; y; zg cannot be equal to {0, 0, 0}, so that the displacement will always occur.
• The values ofx, y, and z are always capped by a percentage of the width, length, and height of the bounding box correspondingly (e.g., 5%, 10%, and 15%).
As an example, when a 10% displacement is chosen, for all of the point clouds in the testing set, the bounding boxes will get displaced by displacement vectors such as the following: {10% of width, 0, 0}, {10% of width, 0, 10% of height}, or {10% of width, 10% of length, 10% of height}.
The results of the displacement and corresponding accuracy changes, compared to the origi-nal results (i.e., without noisy pose simulation), can be observed in Fig.13.
In Fig.13, it can be seen that classification accuracy for all four classes decreases along with the localization (pose estimation) becoming more noisy and consequently cropping results becoming less accurate. As discussed above, noise complicates the classification, since for each cropping result the number of outliers increases, while parts of the object of interest (support) are cut off, which makes the objects less recognizable to the network.
4 Conclusion and Future Work
4.1 Conclusion
During this work, various tasks were completed for creating a solution with capabilities to clas-sify point clouds obtained from a 3-D sensor in an industrial environment. More precisely, our application has a goal to inspect mechanical assemblies by verifying the presence of certain elements (e.g., supports). Initially, the state-of-the-art research of the visual inspection was per-formed, outlining the main direction for the implementation—deep learning approach. As shown by the experiments, usage of point clouds and deep learning is especially efficient in terms of missing data and specifics of the industrial environment. This is a particularly important result due to regular limitations in the choice of point of view as well as presence of metallic or similar surfaces, which might pose a problem for more conventional approaches or other data formats, such as 2-D imagery.
4.2 Future Work
It must be noted that, in regard to the next steps proposed for deep learning on point clouds, the results presented in this paper can be improved further. One of the available directions is to continue improvement of the currently developed approach, which uses raw point clouds. Another suggestion is to use a multiview representation approach, which also gives a high prom-ise, based on the state-of-the-art research. These and other factors make researched directions and consequently developed solution promising for further work and improvement with the pur-pose of achieving the ultimate goal of developing a generalized 3-D classification tool applicable for a wide range of similar industrial tasks. Moreover, considering the results achieved with deep learning for the purpose of classification of point clouds, it would be wise to consider a cor-responding object detection solution with the potential usage of PointNet.
Following this progress, the work will be continued, which will allow to further improve the accuracy and also develop the network’s generalization capabilities. It is proposed to improve the current solution, so that it can be used for pose estimation enhancement (i.e., perform bounding box position refinement). Afterward, it is planned to develop a semantic scene segmentation approach using point clouds in order to segment and then classify all elements (e.g., supports) present in the given scene with the approach developed in this paper as a base.
References
1. Y. Chung and K. Kim,“Automated visual inspection system of automobile doors and win-dows using the adaptive feature extraction,” in Second Int. Conf. Knowl-Based Intell. Electron. Syst. Proc., Adelaide, Australia (1998).
2. M. Ichitsubo, I. Horiguchi, and M. Nagamachi,“A study on the evaluation of structure dam-ages for the visual inspection,” in Proc. Int. Conf. Active Media Technol., Takamatsu, Kagawa, Japan (2005).
3. C. Cho, B. Chung, and M. Park,“Development of real-time vision-based fabric inspection system,”IEEE Trans. Ind. Electron. 52(4), 1073–1079 (2005).
4. T. Brosnan and D. Sun,“Improving quality inspection of food products by computer vision —a review,”J. Food Eng.61(1), 3–16 (2004).
5. W. Wu, M. Wang, and C. Liu, “Automated inspection of printed circuit boards through machine vision,”Comput. Ind.28(2), 103–111 (1996).
6. C.-J. Lu and D.-M. Tsai, “Automatic defect inspection for LCDs using singular value decomposition,”Int. J. Adv. Manuf. Technol. 25(1–2), 53–61 (2005).
7. D.-M. Tsai and S.-C. Lai,“Defect detection in periodically patterned surfaces using inde-pendent component analysis,”Pattern Recognit.41(9), 2812–2832 (2008).
8. H. B. Abdallah et al., “Automatic inspection of aeronautical mechanical assemblies by matching the 3D CAD model and real 2D images,”J. Imaging 5, 81–108 (2019). 9. I. Jovancevic et al.,“3D point cloud analysis for detection and characterization of defects on
10. I. Jovancevic et al.,“Automated exterior inspection of an aircraft with a pan-tilt-zoom cam-era mounted on a mobile robot,”J. Electron. Imaging24, 061110 (2015).
11. H. B. Abdallah et al.,“3D point cloud analysis for automatic inspection of aeronautical mechanical assemblies,”Proc. SPIE 11172, 111720U (2019).
12. P. Je-Kang et al.,“Machine learning-based imaging system for surface defect inspection,”
Int. J. Precis. Eng. Manuf.3, 303–310 (2016).
13. S. Ravikumar, K. Ramachandran, and V. Sugumaran,“Machine learning approach for auto-mated visual inspection of machine components,”Expert Syst. Appl.38(14), 3260–3266 (2011).
14. D. Guifang et al.,“A machine learning-based framework for automatic visual inspection of microdrill bits in PCB production,”IEEE Trans. Syst. Man Cybern.42(6), 1679–1689 (2012). 15. V. Hoskere et al.,“Vision-based structural inspection using multiscale deep convolutional neural networks,” in Third Huixian Int. Forum Earthquake Eng. Young Res., University of Illinois, Urbana-Champaign (2017).
16. T. Xian et al.,“Automatic metallic surface defect detection and recognition with convolu-tional neural networks,”Appl. Sci.8(9), 1575 (2018).
17. Y. Ruifang et al.,“Intelligent defect classification system based on deep learning,” Adv. Mech. Eng.29(3), 168781401876668 (2018).
18. E. Oumayma, L. Hamid, and S. Chafik,“Automatic detection and classification of manu-facturing defects in metal boxes using deep neural networks,”PLoS One13(11), e0203192 (2018).
19. L. Yiting et al., “Research on a surface defect detection algorithm based on MobileNet-SSD,”Appl. Sci.8(9), 1678 (2018).
20. C. Young-Jin et al., “Autonomous structural visual inspection using region-based deep learning for detecting multiple damage types,” Comput.-Aided Civ. Infrastruct. Eng.
33(9), 731–747 (2017).
21. D. Weimer, A. Y. Benggolo, and M. Freitag,“Context-aware deep convolutional neural networks for industrial inspection,” in Australas. Conf. Artif. Intell., Canberra (2015). 22. N. Fusaomi et al.,“Design tool of deep convolutional neural network for intelligent visual
inspection,”IOP Conf. Ser. Mater. Sci. Eng.423(1), 123 (2018).
23. B. Vogel-Heuser et al.,“Evolution of software in automated production systems: challenges and research directions,”J. Syst. Software 110, 54–84 (2015).
24. S. V. Khedaskar et al.,“Survey of image processing and identification techniques,” VIVA-Tech Int. J. Res. Innov. 1(1), 1–10 (2018).
25. R. S. Hegadi,“Image processing: research opportunities and challenges,” in Natl. Seminar Res. Comput., Coimbatore, India (2010).
26. V. Zharkova et al.,“Feature recognition in solar image,”Artif. Intell. Rev.23(3), 209–266 (2005).
27. A. M. Kim, R. C. Olsen, and F. A. Kruse,“Methods for lidar point cloud classification using local neighborhood statistics,”Proc. SPIE 8731, 873103 (2013).
28. M. Weinmann et al.,“Contextual classification of point cloud data by exploiting individual 3D neighbourhoods,”ISPRS Ann. Photogramm. Remote Sens. Spat. Inf. Sci.II-3/W4(4), 271–278 (2015).
29. M. Weinmann, B. Jutzi, and C. Mallet,“Geometric features and their relevance for 3D point cloud classification,”ISPRS Ann. Photogramm. Remote Sens. Spat. Inf. Sci.IV-1/W1(1), 157–164 (2017).
30. Z. Heng, Z. Bin, and L. Yanli,“Object classification based on 3D point clouds covariance descriptor,” inIEEE Int. Conf. Comput. Sci. and Eng. and IEEE Int. Conf. Embedded and Ubiquitous Comput., Guangzhou, China (2017).
31. M. Omidalizarandi and M. Saadatseresht,“Segmentation and classification of point clouds from dense aerial image matching,”Int. J. Multimedia Appl. 5(4), 4145–4169 (2013). 32. C. Becker et al.,“Classification of aerial photogrammetric 3D point clouds,”ISPRS Ann.
Photogramm. Remote Sens. Spat. Inf. Sci. 84(5), 287–295 (2018).
33. M. Zhenga, M. Lemmens, and P. van Oosterom,“Classification of mobile laser scanning point clouds from height features,”Int. Arch. Photogramm. Remote Sens. Spat. Inf. Sci.
34. X. Binbin et al., “Segmentation-based classification for 3D point clouds in the road environment,”Int. J. Remote Sens.39(19), 6182–6212 (2018).
35. Y. Zegaoui et al., “Urban object classification with 3D deep-learning,” in Joint Urban Remote Sens. Event, Vannes, France (2019).
36. Z. Ruibin, P. Mingyong, and W. Jidong,“Classifying airborne lidar point clouds via deep features learned by a multi-scale convolutional neural network,” Int. J. Geogr. Inf. Sci.
32(5), 960–979 (2018).
37. X. Roynard, J.-E. Deschaud, and F. Goulette,“Classification of point cloud for road scene understanding with multiscale voxel deep network,” in 10th Workshop Plann., Percept. and Navig. Intell. Veh., Madrid, Spain (2018).
38. Z. Wu et al.,“3D ShapeNets: a deep representation for volumetric shapes,” inIEEE Conf. Comput. Vision and Pattern Recognit., Boston, Massachusetts (2015).
39. C. R. Qi et al.,“Deep learning on point sets for 3D classification and segmentation,” inIEEE Conf. Comput. Vision and Pattern Recognit., Honolulu, Hawaii (2017).
40. P. Cignoni et al.,“MeshLab: an open-source mesh processing tool,”http://www.meshlab .net/(2008).
Ivan Mikhailovgraduated in 2016 from the Saint-Petersburg National Research University of Information Technologies, Mechanics and Optics (Russia) with a bachelor’s degree in infocom-munication technologies and systems. He received his master’s degree in computer vision in 2019 from the University of Burgundy (France). Currently, he is conducting his PhD at SurgAR (Clermont-Ferrand, France) in partnership with the University of Clermont Auvergne and Endoscopy and Computer Vision research group. His work is primarily focused on computer vision and machine learning applications for surgical augmented reality.
Igor Jovancevicgraduated in 2008 from Faculty of Natural Science and Mathematics at the University of Montenegro with a mathematics degree (speciality computer science). He gradu-ated in 2011 from joint Erasmus Mundus Master program in Computer Vision and Robotics (VIBOT) conducted by University of Burgundy (Le Creusot, France), University of Girona (Girona, Spain), and Heriot Watt University (Edinburgh, UK). He received his PhD in computer vision in 2016 from IMT Mines Albi (Albi, France), a French “Grande Ecole” specialized in process engineering, under the supervision of Professor Jean-José Orteu and Dr. Thierry Sentenac. Currently, he is working at Diotasoft, Toulouse, as a research engineer focusing on computer vision applications on the problems of inspection and manufacturing process monitoring.
Nour Islam Mokhtari graduated in 2018 from the University of Burgundy with a master’s degree in computer vision. He also holds an engineering degree from Polytechnic School of Algiers (Ecole Nationale Polytechnique) in the field of control and automation. Currently, he is working at Diotasoft in Toulouse, France, as a research and development engineer, focusing on computer vision and machine learning applications for industrial visual inspection. Jean-José Orteu graduated in 1987 from a French “Grande Ecole” (ENSEIRB, Bordeaux, France) with an engineering degree in electrical and software engineering and a master’s thesis in automatic control. He received his PhD in computer vision in 1991 from Université Paul Sabatier (Toulouse, France). Currently, he is a full professor at IMT Mines Albi (Albi, France), a French“Grande Ecole” specialized in process engineering. He carries out his research work in the Institut Clément Ader laboratory (200 people). For more than 15 years, he has developed computer vision-based solutions for 3-D measurements in experimental mechanics (photome-chanics) and for a few years he is more specifically involved in the application of computer vision on NDE, inspection, and manufacturing process monitoring.