Master thesis
Presented for Master Diploma of Sciences Technologies, Agricultural sciences and agrifood sciences under the EMJMD Plant Health in Sustainable Cropping System
On the subject
by
Rafael Feriche Linares
College : Montpellier SupAgroPresented the 27th September 2018 at Montpellier, to the jury compose by : President: Véronique Marie-Jeanne MSA
Members: Véronique Marie-Jeanne MSA
Manu Plantegenest AO
Nicolas Sauvion BGPI
Evolution forces involve in aphid
populations Aphis gossypii on resistant melon plants
Internship done at : Centre de recherche Provence-Alpes-Côte d’Azur INRA, UR1052, Génétique et Amélioration des Fruits et Légumes (GAFL) Domaine St Maurice - 67, Allée des Chênes
CS 60094– 84143 Montfavet Cedex, France
Under the direction of: Nathalie Boissot
1
Résumé
i) Introduction
Les pucerons sont parmi les insectes phloèmophages le groupe de ravageurs le plus important sur le plan économique et le plus cosmopolite (Dixon et al., 1987) (C Michael Smith et Chuang, 2014). La plupart des pucerons sont hautement spécialisés et ne peuvent infester que les plantes appartenant à une famille ou à un petit nombre d’espèces apparentées. Cependant, certaines espèces peuvent coloniser des plantes dans plusieurs familles, y compris parmi les 6 principales cultures alimentaires de climat tempéré (blé, pomme de terre, betterave à sucre, maïs , tomate et orge) ( Blackman & Eastop, 2000 ). Les infestations peuvent se développer rapidement dans la plupart des paysages agricoles en raison de leurs taux de reproduction élevés, de leur grande plasticité à l’environnement et de leurs grandes capacités de dispersion.
De multiples stratégies sont disponibles pour contrôler les pucerons: le contrôle chimique, biologique et la résistance de l'hôte. Leur applicabilité et leur succès dépendent des types de culture. De manière générale, les programmes de lutte intégrée contre les ravageurs (IPM) intègrent spatialement et ponctuellement plusieurs stratégies pour accroître leur efficacité.
Les pucerons sont l'un des principaux groupes cibles du développement des pesticides. En fait, l’usage illimité et répétitif de pesticides de synthèse au cours du siècle dernier a entraîné l’émergence de nouveaux génotypes de pucerons qui ont acquis une résistance à une ou plusieurs familles d’insecticide. La législation de l'Union européenne a imposé de plus en plus de restrictions à l'application des insecticides en raison de leur impact négatif sur l'environnement (Jaouannet et al., 2014). Des variétés résistantes aux pucerons et aux virus qu’ils transmettent sont de plus en plus utilisées pour contrôler les populations en raison de leurs avantages écologiques et de leur grande efficacité.
Parmi les pucerons, le puceron du melon et du cotonnier Aphis gossypii est un cas d'étude fascinant. A. gossypii est un ravageur mondial capable de coloniser plus de 600 plantes hôtes dans des familles telles que les Cucurbitaceae, Rutaceae et Malvaceae. Récemment, la lutte chimique contre A. gossypii a été de plus en plus restreinte parce qu’il a développé une résistance à une grande variété de classes d'insecticides (Carletto et al., 2010). Par conséquent, l'identification de résistance chezla plante hôte et le développement de nouvelles variétés ayant intégré ces résistances sont devenus essentiels dans le contrôle d’A. gossypii. Une résistance génétique, contrôlée par le gène Vat-1, a été identifiée dans des lignées de Cucumis melo du monde entier et introduite dans les lignes commerciales, principalement en France. Une étude génétique suggère qu’en fait deux gènes situés dans un groupe de gènes appartenant à la famille CC-NBS-LRR des gènes de résistance des plantes contrôlent la résistance (Boissot et al., 2016 a). Le gène Vat-1 confère non seulement une résistance aux infestations par A. gossypii mais inhibe également les infections des plantes par des virus non circulants transmis par ce puceron (Dogimont et al., 2014).
Dans l’étude présentée ici nous avons étudié l’évolution dynamique entre deux forces évolutives, de compétition et de dérive, dans une population de deux clones d’A. gossypii, CUC1 et C6, capables de se développer sur des plantes de melon Vat. Douze plantes issues de lignées quasi-isogéniques, possédant ou non le gène Vat, ont été infestées selon diverses conditions. Les deux populations de pucerons se sont développées et ont été échantillonnées après 4 et 8 jours.
La fréquence des deux clones de pucerons a été utilisée comme estimateur de la présence ou de l'absence de forces d'évolution ; Elle a été déterminée en utilisant des méthodes de séquençage à haut débit (HTS). Nous avons développé un amplicon spécifique qui contient plusieurs SNP homozygotes
2 permettant de différencier les deux clones. Nous avons construit un gradient de fréquences connues pour vérifier la puissance et la précision des fréquences mesurées par notre amplicon.
Nous avons constaté que la sélection naturelle était présente et que la compétition était favorable pour le clone CUC1 sur les plantes sans le gène Vat et pour C6 sur les plantes avec le gène Vat. De même, nos résultats suggèrent que la dérive génétique était également présente lors des infestations à très faibles densités.
ii) Matériel et méthodes
Nous avons dans un premier temps identifié le polymorphisme de nucléotides simples (SNP) homozygotes dans le transcriptome de deux clones d’A. gossypii, CUC1 et C6. Puis plusieurs étapes de filtrage ont été effectuées pour choisir les meilleurs amplicons permettant de différencier ces 2 clones par séquençage NGS Illumina (appel de variantes, conception des amorces et vérification par des méthodes de séquençage Sanger). Pour vérifier que les amplicons répondent aux attentes d’estimation des clones dans un mélange, nous avons construit un ensemble de mélanges connus des deux clones de pucerons, appelé "Abacus", et les avons soumis au séquençage NGS. La relation entre les fréquences attendues et les fréquences estimées nous a permisd’estimer, l’efficacité de notre technique.
Trois essais biologiques ont été réalisés pour étudier l'effet des fréquences de départ, de la densité et du positionnement sur les effets de compétition et de dérive. Dans chaque essai, 12 plantes de chaque lignée quasi-isogénique Charentais, avec et sans le gène Vat, ont été infestées par CUC1 et C6. Les populations de pucerons ont été collectées 4 et 8 jours après l'infestation. Les échantillons contenant un pool de pucerons CUC1 et C6 et du matériel végétal ont été soumis à une extraction par ADN isopropanol-éthanol et à un séquençage NGS. Les données de séquences , ont été traitées par plusieurs outils de bio-informatique afin d’obtenir pour chaque échantillon, le nombre de ‘reads’ pour chaque SNP.
Alors, nous avons calculé la fréquence de chaque SNP C6 par Rstudio v 1.1.456 . Les forces de la compétition ont été étudiées en comparant les fréquences mesurées et les fréquences attendues entre les clones dans chaque modalité et en examinant la direction de cette compétition. La présence de dérive génétique a été étudiée en regardant la distribution des valeurs de fréquence des clones.
iii) Résultats
Nous avons conçu deux amplicons contenant respectivement six et quatre SNP homozygotes pour les clones CUC1 et C6 d’A. gossypii.
Les deux amplicons définis à partir d’un transcriptome de référence étaient différents des résultats attendus. Dans l'amplicon 1, un intron de 75 pb a été trouvé au milieu. Cette séquence contenait 3 nouveaux SNP homozygotes pour CUC1 et C6, augmentant la fiabilité de l'amplicon 1. Cependant, la précision pour l’estimation de la fréquence des 3 SNP initialement identifiés a été réduite en raison du décalage du principe de chevauchement lors de la construction des bibliothèques de séquençage NGS. Les séquences d'amorces par paires de l'amplicon 2 incluaient par erreur l'un des trois SNPS. Cela a suggéré que l'amplification du locus 2 n'était pas spécifique pour les deux clones.
Ensuite, nous avons vérifié la fiabilité de la fréquence des SNPs détectés pour les échantillons de l’abaque en vérifiant la relation entre les fréquences mesurées et attendues en plusieurs étapes: i) régression linéaire ; ii) bande de confiance de la droite de régression ; iii) bande de confiance du point prévu et enfin iv) simulations d'erreurs lors de la préparation des échantillons. Seul l’amplicon 1 est
3 apparu approprié pour étudier la fréquence de C6 /CUC1 dans une population. Il a été utilisé pour la suite de l’étude.
Pour étudier la présence ou l'absence de compétition entre les clones CUC1 et C6 dans une population, nous avons comparé les fréquences initiales avec les fréquences moyennes mesurées après 4 et 8 jours. Globalement, les résultats ont montré que la compétition était favorable à CUC1 sur les plantes sensibles (sans le gène Vat) et à C6 sur les plantes résistantes (avec le gène Vat).
Pour étudier la présence ou l'absence de dérive génétique, nous avons examiné les fréquences mesurées en dehors du CI à 95% et l'écart type (S). Les fréquences mesurées fluctuent considérablement lorsque le nombre initial de pucerons est faible, suggérant que la dérive est présente lorsque le nombre initial de pucerons est inférieur à 4.
iv) Conclusion
Bien que les deux clones CUC1 et C6 d’A. gossypii soient génétiquement proches et appartiennent à un même cluster génétique (Thomas et al., 2016), nous avons réussi à définir un amplicon capable de les distinguer. Les SNP contenus dans l'amplicon sont homozygotes pour les deux clones.
La méthode d'étude que nous avons mise au point permet de mettre en évidence la compétition entre clones de manière ni complexe ni coûteuse. Nous avons mis en évidence une compétition entre les clones CUC1 et C6opérant dans des directions opposées sur des plantes avec et sans Vat. Nous faisons deux hypothèses sur l’origine de cette compétition observée qui peut être en relation soit avec la capacité de chacun des clones à se reproduire sur plantes sensibles et résistantes, avec une pénalité liée l’adaptation à la résistance de la plante plus forte pour CUC1 que pour C6, soit à des effets comportementaux. Pour trancher entre ces deux hypothèses, nous proposons de déterminer la nature de la compétition en quantifiant le taux intrinsèque de reproduction de chaque clone, CUC1 et C6, séparément dans les plantes sensibles et résistantes.
Nos méthodes de base sont disponibles pour explorer l'effet de la dérive. Cependant pour aller plus loin dans l’étude de la dérive comme force évolutive, il faudra soit compter le nombre de pucerons dans chaque échantillon soit développer un modèle à partir des données que nous avons obtenues. Mot clés : évolution, dérive, compétition, NGS, Vat, diversité, résistance.
Abstract
Target-gene amplicon sequencing is being more and more exploited high-throughput sequencing application to study diversity and interactions within a population. We studied the dynamic evolution of drift and natural selection forces between two resistant clones of A. gossypii, CUC1 and C6, in two plant genotypes of Cucumis Melo, one containing the Vat gene. Plants were infested with resistant aphid clones at diverse range of departure conditions in twelve of each genotype and sampled at two periods after the infestation. We developed a specific amplicon that contains multiples homozygous SNPs that allow differentiating between clone. This method required to construct and estimate a frequency gradient to verify the power and accuracy of the measured frequencies by the amplicon. The study methods for put in evidence the effect of competition were not either complex or expensive. Overall, the results showed that competition was favorable to CUC1 on susceptible plants and to C6 on resistant plants. We observed that no basic methods are available to study effect of drift. New approaches, either quantifying aphids or the use of models can to disclose the effect of drift in populations.
5
Index
1. Background………...7 1.1. Aphid as a pest ………..7 1.2. Control management……….7 1.2.1. Chemical……….…..7 1.2.2. Biological……….…….81.2.3. Host plant resistance……….……….8
1.3. The biological system Melon/Aphid ……….……10
1.4. Evolution forces involve in resistance……….…12
2. Material & Methods………13
2.1. Amplicon design……….………13
2.1.1. Amplicon design from transcriptome data……….………13
2.1.2. DNA Genomic primers design………..………13
2.1.3. Abacus construction………..………..…………..……15 2.2. Experimental design..……….………16 2.2.1. Aphids clones……….….……….….……….……16 2.2.2. Plants lines……….…………..……….………16 2.2.3. Biological test……….……….……….………16 2.3. DNA extraction……….……….……….…18 2.4. NGS sequencing……….……….………...18 2.5. Data Analysis……….……….……….….…19 3. Results ……….………...………..……19 3.1. Amplicon design……….……….……….…..…19
3.2. Frequency of specific amplicons as a predictor of frequency of clones ……….…….……21
3.2.1. Coverage estimation……….………….….…...21
3.2.2. Relationship SNP frequencies and clones frequencies………..…………....23
3.3. Evolution forces: competition vs drift ……….……….………26
3.3.1. Competition.………..………..……….……….……….…26
3.3.2. Drift forces………...27
4. Discussion……….……..29
4.1. Amplicon as a tool to study diversity………..…...29
4.2. Evolution forces: Relation between competition and drift………...30
5. Conclusion……….……..……….…..31
6. Acknowledgement……….…..31
7. Bibliography……….…….………..32
6
Table & Figures Index
Figure 1 Schematic of the plant immune system...10
Figure 2 Interaction between Vat plant and A. gossypii………..…….…..……11
Figure 3. Amplicon candidates SNPs verification………..….14
Figure 4. Schematic construction of abacus ………..………..…..…….15
Figure 5. Plants ready to be infested by aphids under control conditions. ……….17
Figure 6. Amplicon characteristics………..………….….19
Figure 7. Amplicon tagging process ………..……….….……….….21
Figure 8. Number of reads sample per modality………..….23
Figure 9. Relationship between expected and measured frequencies of C6 clone in C6/CUC1 pool samples...24
Figure 10. Relationship between expected and measured frequencies of C6 clone in C6/CUC1 pool samples………..….25
Figure 11. Accuracy of amplicon 1 to estimate C6 frequency..……….……26
Figure 12. Distribution of frequencies fluctuations of C6 clone in C6/CUC1 pool samples………28
Table 1. Departure conditions for three biological essays……….…….17
Table 2. Amplification of first primer set for A.gossypii clones………...20
Table 3. Aphid number estimation for the three biological essays……….………….22
Table 4. Coverage estimations for amplicon 1………..………..22
Table 5. Competition between CUC1 and C6 clones……….27
7
1. Background
1.1 Aphids as a pest
Aphids, belonging to the family Aphididae and the order Hemiptera, are recognized as the largest, most economically important and cosmopolitan widespread group of plant phloem feeders (Dixon et al., 1987) (Michael Smith&Chuang, 2014). This insects group counts approximately 5000 species (around 600 in France) and live mostly in temperate regions where they are able to colonize around 25% of existing plant. Nevertheless, only about 100 species are considered dangerous and cause significant economic los (Blackman&Eastop, 2000). Most of the aphids have developed highly specialized feed habits and can only infest plants belonging to a family or a small number of related plants. However, some species are able to colonize plants in several families, including the 6 main food crops of temperate climate (wheat, potatoes, maize sugar beet, tomatoes and barley) (Blackman&Eastop, 2000).
Ordinarily, aphids feed on the underside of leaves or the growing tips of shoots, sucking phloem sap by inserting their mouthparts into sieve element tissues. This unique feeding behavior can injure the host plants in diverse ways. First, as sap-feeders, aphids inflict injury via direct feeding, taking plant nutrients intent to plant growth and reproduction to their own benefits, causing seedling death, leaf withering and curl, and serious yield loss in several plants families. Secondly, aphid saliva compounds, such as enzymes or polysaccharides, injected during the feeding phase could be phytotoxic. Thirdly, aphids have an extraordinary ability to transmit approximately 300 plant viruses, making them by far on the most important plant viruses vectors (Nault, 1997). Ultimately, large aphid populations produce abundant amount of honeydew, collecting dust and others particles, and promoting sooty mold growth that can hinder photosynthetic activity (Beckendorf et al., 2008)
Infestations can develop relatively quickly due to their ability to colonize and rapidly exploit resources in most agricultural landscapes. This ability is consequence of high reproductive rates, great plasticity to environment and their great dispersal capacities.
1.2 Control management
It has been reported that aphids possess several mechanisms to manipulate host responses, as reflected by their ability to affect host morphology and evade or suppress plant defense responses (van Emden and Harrington, 2007; Girousse et al., 2005).
Knowing their pest potential, multiples strategies are available to control aphids: chemical, biological control and host resistance. Their applicability and success is dependent of cultivation types. Generally, integrated pest management (IPM) programs integrate spatially and timely several strategies to increase their efficacy.
1.2.1 Chemical
Aphids are one of the main target groups for pesticides development. These chemical compounds involve only immediate and temporary reduction of localized populations and do not contribute to natural control. Nicotine was the first insecticide efficient against aphids used in the 1930s. After that, new pesticide groups were coming to light quickly, such as organochlorinated compounds (1940s), organophosphorous (1950s), carbamates (1960s), pyrethroids (1970s) and neonicotinoids (1980s).
8 Presently, aphid control strategies depend upon the frequent used of these insecticides in field or greenhouse conditions. Although, an increasing number of restrictions on the application of insecticides have emerged under European Union (EU) legislation due to their negative impact on the environment (Jaouannet et al., 2014).
In fact, the unrestrained and repetitive use of synthetic pesticides during the last century has resulted in the emergence of new aphid genotypes that have acquired resistance to one or more families of insecticides. Resistant genotypes to pesticides have been mainly reported in two aphids’ species Myzus persicae and Aphis gossypii, but not exclusively(Dedryver et al., 2010). Different mechanisms were associated to the development of resistance including alterations in the cuticle, mutations in pesticides target sequences and overexpression of genes responsible of production of metabolic enzymes that can break down insecticides (Ahmad et al., 2006; Jaouannet et al., 2014; Li et al., 2007). It was also observed that resistant populations have never invaded susceptible populations, presumably because there is a “resistance cost”. Therefore, without the insecticide sprays, resistant clones should be counter-selected for local clones better adapted (F. Vanlerberghe-Masuti et al.,2007; Jaouannet et al., 2014).
Regarding to the integration of other aphids control methods, wide spectrum insecticides can lead to decimate natural aphid enemies of great importance in biological control. Systematic plants insecticides, such as neonicotinoids, reduce considerably this collateral because natural enemies are not target in a direct way. Additionally, this makes them a great measure for stopping some virus spread by seeds(Dedryver et al., 2010).
1.2.2 Biological and cultural
Aphids are attacked by a wide range of natural enemies. These include predators (e.g ladybirds-Coccinellidae and lacewings-Chrysopoidea), parasitoids (e.g Aphidiinae) and some pathogens, such as viruses and the considered ‘true’ fungi (Zygomycota and Ascomycota)(Nielsen C ,2002). These natural enemies are commonly implemented in three main strategies of biological control: Inoculation, augmentation and conservation. Usually, biological control is combined with cultural management practices such late sowing of winter cereals, reducing the number of aphid and viruses reservoir or the use plant non-corps as refuges for natural enemies.
Laboratory studies suggest that many of these natural enemies of aphids decimate successfully the host or prey population under controlled conditions , however, they do not often demonstrate same level of effectiveness in the nature. Also a high control potential is attributed to short term efficiency while the population regulation at long term is still uncertain.
1.2.3 Host plant resistance
Host resistant plants to aphids and /or plants viruses are excellent methods to control populations of aphid species. Besides that fact, use of host resistant plant results in ecological benefits decreasing pesticides application and residues, slowing down the dissemination of aphids-vectored viruses, and reducing mortality of pest natural enemy populations.
The sources of aphid resistant traits are limited and usually identified in not domesticated plants and wild accessions, these traits have been incorporated aphids resistant into commercial cultivars. During the last decades, an intense screening effort was performed to find new aphids resistant sources. This results in the identification of multiple aphid resistant accessions in the major family cultivars. For instance, over 40.000 accessions were evaluated to fight against wheat aphid Diuraphis noxia and only 300 have exhibited partially or resistant responses (Berzonsky et al., 2010).
9 Despite the fact that a high number of resistant accessions were discovered, aphid resistance usually relies on few genes with a small numbers of resistant alleles. Inheritance of aphid resistance may occurs as a result of single genes (qualitative) or many (qualitative). More often, single and dominant R genes determine aphid resistance across species and host plants. (Dogimont et al., 2010) For instance, expression of resistance to the pea aphid Acyrthosiphon pisum, in the species Medicago truncatula, relies on the gene RAP1 that is inherited as a dominant trait (Stewart et al., 2009). Two recessive genes, aph 1 and aph2, were also reported in maize plants involved in resistant to the corn lead aphids Rhopalosiphum maidis (Carena et all, 2004). Finally, a quantitative and pool trait locus resistance against the green peach aphid Myzus persicae was identified in peach (Pascal et al.,2002). Aphid resistance depends on the genotype of host plant. Aphid resistant mechanisms induce changes in aphid biotic potential, reducing fecundity, growth and developing rates, and also dissuade primary infestations of the crops. In the recent years, transcriptomic responses to resistant plants have revealed the expression of R genes, plant reactive oxygen species (ROS), and pathogenesis-related (PR) pathways operating as response against aphids. However, only two aphids resistance genes, Mi-1.2 and Vat, has been isolated and successfully cloned (C. Michael Smith and Chuang, 2014).
The Mi-1.2 gene, from the wild tomato Lycopersicon peruvianum confers resistance to three Meloidogyne root-knot nematode species and to the potato aphid. The gene Vat from melon plants, confers resistance to the melon-cotton aphid A. gossypii. Both are dominant and constitutive genes and belong to the family of resistance genes nucleotide-binding-site and leucine-rich repeat region (NBS-LRR) (Dogimont et al., 2010; Rossi et al., 1998). The response of both genes, Mi-1-2 and Vat, is expected activated upon recognition of aphid effectors, resulting in effector-triggered immunity (ETI) (Figure 1). Aphid effectors are fundamentally expressed in salivary glands and secreted into saliva which is delivered by stylets during the feeding act (Hogenhout and Bos, 2011; Jaouannet et al., 2014). Finally, it is important to mention that considerable progress has been made in transgenic plant resistance to aphids in the last decades. Aphid resistance was reported in transgenic plants containing genes encoding mannose-specific or N-acetylglucosoaminespecific lectins (Down et al., 2003; Stoger et al., 1999). In spite of Bt-derived toxins having thus far not been proved to be effective against aphids, recent results seem promising with a novel insecticidal protein from Bt effective against Aphis gossypii Glover (Sattar, 2011). These results generate the opportunity to increase the understanding of Bt aphid-resistant transgenic plant.
10 Figure 1. Schematic of the plant immune system from Dangl et.al, (2013). Pathogens of
all lifestyle classes (color coded and labeled) express PAMPs and MAMPs as they colonize plants (shapes are color coded to the pathogens). Plants perceive these via extracellular PRRs and initiate PRR-mediated immunity (PTI; step 1). Pathogens deliver virulence effectors (step 2) to block (PTI; step 3). Intracellular NLR receptors can sense effectors in three principal ways (step 4). Molecular activation mechanisms results in NLR-dependent effector-triggered immunity (ETI) are not yet elucidated.
1.3 The biological system Melon/Aphid
Among aphids, the cotton-melon aphid A. gossypii is a fascinating study case. A. gossypii is an important and worldwide pest, distributed in tropical, subtropical and temperate regions. It is a major pest of cotton and cucurbits. It is also able to colonize more than 600 host plants in families such as Cucurbitaceae, Rutaceae and Malvaceae. Recently, chemical control measures against A. gossypii have been becoming more and more restricted because A. gossypii has demonstrated a capacity to evolve resistance to a wide variety of insecticide classes (Carletto et al., 2010). The first chemical breakdown was observed in 1928 with hydrocyanic acid, and then one after another, failures were reported for other organophosphates, carbamates, pyrethroids, and newly, neonicotinoids.
Therefore, identifying and developing host-plant resistance has become essential for the control of the cotton melon aphid. A genetic resistance to A. gossypii was identified in multiples Cucumis melo lines around the world and introduced into commercial lines. It is controlled by the major gene Vat-1 and several quantitative trait loci. In fact, recently studies revealed that at least another gene, Vat-2, is involved in the resistant to A. gossypii in melon lines. Genetic study suggests that both genes are located in a cluster of genes belonging tothe CC-NBS-LRR family of plant resistance (R) genes (Boissot et al., 2016b).The Vat-1 gene confers not only resistance to A. gossypii infestations but also inhibits plant infections by non-persistent viruses transmitted by this aphid (Dogimont et al., 2014).
11 The Vat-1 gene figuratively works as two-steps process, firstly the aphid recognition and secondly the activation of a broad spectrum resistance to inhibit virus infection (Boualem et al., 2016) and aphid colonization. It is involved in hypersensitive response to A. gossypii resulting in a rapid accumulation of callose deposits, phenol and lignin synthesis (Villada et al., 2009). This defense mechanism could impede the normal stylet penetration and phloem sap ingestion by aphids, which can lead to smaller aphids in size and fewer progeny mostly due to a longer pre-reproductive period (Sattar et al., 2012). Studies about interactions between aphids and plants (Figure 2) have reported populations capable to overcome the Aphid-Triggered Immunity in Vat plants (Boissot et al 2016a). Two mechanisms to overcome resistance are hypothesized. Firstly, a modification in the effector could lead to the absence of recognition and do not activate ETI. Secondly, effector is recognized and ETI responses are triggered but A.gossypi is still able to feed and reproduce in Vat plant (Boissot et al., 2016b). The responsible mechanism a have not been elucidated. However, once defense are triggered, viruses are not able to infect Vat plants (Boissot et al 2016a).
Figure 2.Interaction between Vat plant and A. gossypii from Boissot et al., (2016). (A), (C) Effector-triggered immunity (ETI). (A) Efficient against both aphids and virus. (C) Efficient only against virus. (B)No ETI was observed. (D) resistance to aphids and susceptibility to virus case was never observed.
12
1.4 Evolution forces involve in resistance
When pesticides and resistant plants are used against a sensitive insect population, only a few individuals acquire resistance as a result of genes mutations. Then, these resistant genotypes are introduced in the new populations given an important competitive advantage relative to the sensitive individuals. It is mean that, at the population level, resistance breaking is related to an increase in clone frequencies able to overcome the resistance. This advantage plays an important role, but more forces determine the establishment of the resistant genotype in a population.
In populations, evolution is the determined by the interactions between different forces: mutations, natural selection, gene flow and genetic drift. Mutation and gene flow forces originate genetic diversity within a population. Selection and genetic drift drive the evolution of diversity within the population. Selection force favored those individuals with highest ability of survive, reproduce, and spread to a new host or environment. Regularly, it is calculates as the relative difference in fitness of two genotypes. Genetic drift, contrary to selection, acts equally on all variants. It is as the change between generations over time due to chance and chance alone(Rousseau et al., 2017a).
In this study, we investigated the dynamic evolution between drift and natural selection forces between two resistant clones of A. gossypii in two plant genotypes. Plants were infested with resistant aphid clones at diverse range of departure conditions in twelve plants of each genotype, population developed and were fully collected at two periods after the infestation. Two plant genotypes of the line Charentais of Cucumis Melo, susceptible and resistant, were used as host plants. Aphid resistant plant, Charentais Vat R, contains the gene Vat originating from the Korean melon line PI 161375 (Boissot et al., 2016a). The interactions were studied between the two aphid clones CUC1 and C6 both capable to reproduce and develop in resistant to Vat plants. The mechanism to overcome Vat resistance is different for each clone; CUC1 triggers the immunity plants defense, while C6 does not activate effector-triggered immunity.
Clone frequency was utilized as estimator of presence or absence of evolutions forces. We stablished that natural selection was present and competition was favorable for one clone when the measured frequencies were significantly higher for that clone. Similarly, we determined that genetic drift was present when frequencies extremely fluctuates around the mean frequency, implying high values of frequency standard deviation.
Mutations were ignored because of the short time and population sizes in the experiments. Gene flow force was neutralized, isolating plants sample from each other and using adults that only reproduce by parthenogenesis. This assures to observe only the effects of drift and competition. Clone frequency was determined by using high-throughput sequencing (HTS) methods. We developed a specific amplicon that contains multiples homozygous SNPs that allow differentiating between clone. We constructed and estimated frequency gradient to verify the power and accuracy of the measured frequencies by the amplicon.
Several departure conditions were set up to study the effects in the evolution forces. We hypothesized that density, proportions and positioning could be potential factor of how drift and competition occurred.
13
2. Material and Methods
2.1 DNA amplicon design
We first developed amplicons with SNP and we checked if reads obtain from a mix of aphids clones allowed to estimate clone frequency in the mix.
2.1.1 Amplicon design from transcriptome data
We used a head reference transcriptome available at GAFL Lab, built using the RNA extract of four A. gossypii clones. To that end, four libraries were built, one per each clone, and sequenced on two lanes of an HiSeq2000 (Illumina,Fluidgim). Sequences were subjected to several assembly, and a reference transcriptome of 33.813 contigs and 72.5 million bases was obtained (Dutartre-Fricaux Let all , 2014). Firstly, we used variant calling software Varscan for the identification of homozygous single nucleotide polymorphism (SNP) in the transcriptome of two clones, CUC1 and C6, used for the biological tests. Varscan is a complex open set tool that detects single nucleotide variants (SNVs) such as deletions, mutations and assesses their frequencies in samples from alignments of next-generation sequencing data (Koboldt et al., 2009). When considering the different variant calling tools, the algorithms can differ considerably. Varscan uses heuristic/statistical method to identify variants, although other tools such as GAPK, Platypus and SAMtools operate based in Bayesian approaches (DePristo et al., 2011; Koboldt et al., 2013; Li et al., 2009). Varscan is compatible with some of the most currently available read aligners such as BLAST or Bowtie and report variants in both individual and pooled samples. Varscan operates giving a score and sorting the alignments on a per read basis. Reads with low identity scores or that aligned in various contigs in the reference sequence are discarded. Then, Varscan proceed to screen changes in the sequence for the single best alignment for each real (Koboldt et al., 2013).
Before calling the variants, data were prepared in the proper input format, mpileup, using the Mpileup tools of the SAMtools toolkit. First, we aligned sequenced data from CUC1 and C6 to the reference sequence. Only positions covered by at least 10 reads were analyzed and we selected homozygous SNP (parameters “min-coverage-normal 10 --min-coverage-tumor 10 --min-freq-for-hom 0.9” in “Varscan v2.4.1 somatic”). The vcf output file generated, compile all SNPs homozygous between clones CUC1 and C6.
Several filter steps were done to choose the best amplicons for the NGS sequencing by Illumina: a maximum length of 150 base pairs, comprising a minimum of 3 SNPs, with at least 50 bp from the first SNPs on both sides. We visualized the sequence reads alignment and SNPs between CUC1 and C6 sequences comparing them with the reference sequence by using the software Integrative Genomics Viewer (IGV) (Thorvaldsdóttir et al., 2013). Thus, we scored and selected amplicon candidates with no variability near to the SNPs, and the highest reads coverage (Figure 3).
2.1.3 DNA Genomic primers design
Two primers sets were designed by using Primer3 (v. 0.4.0). Oligonucleotide sequences were supplied by Eurofins Genomics.
First, given the absence of A. gossypii sequenced genome, candidates were blasted by Ensemble Metazoa (https://metazoa.ensembl.org/Multi/Tools/Blast ) against the genome of Acyrthosiphon
14 pisum, mainly to discard amplicons with introns. A total of 18 candidates were considered suitable. Moreover, because we planned to extract DNA from aphids without removing them from leaves, BLASTN analysis was conducted against the melon genome assembly by using (http://www.melonomics.net/tools/blast/run/). No match was found between the sequences and melon genome.
Figure 3. Amplicon candidates SNPs verification. Integrative Genomics Viewer (IGV) was used to visualize presence of homozygous SNPs. Transcriptome sequences from A. gossypii clones C6 (Upper) and CUC1 (Bottom) were compared against reference transcriptome. In the shown area, three homozygous SNPs (colour band) were found in CUC1 and no SNP(grey) was found in C6.
The first set of primers targeted Sanger sequencing programs to verify SNPs position. Parameters were a length of 15-25 bases, a melting temperature of between 55-65°C a GC content from 50-80% and a product size between 500-600pb. Candidate primers were excluded if there were more than 5 consecutive Thymine in a row in the amplified product or if the length between any primers was shorter than 30 pb.
DNA samples from five clones CUC1, C6, C4, C9 and NM1 (to prepare further experiments) were subject to primary PCR reaction performed by Mastercycler® Gradient. The reaction mixture (25 μL) contained 5 μL 5× PCR buffer, 5 μL H2O, 1 μL dNTPs mixture (4 mM), 1,5 µl MgCl2 (25M), 0,2 μL LA Taq Promega polymerase, 0,5µl of each primer(μM), and 1 µl ADN. No temperature gradient protocol was tested. A unique thermal cycler program was done : 94 °C/4 min, 35 cycles of 94 °C/30 s, 56 °C/45s s and 72 °C/60 s, following a final extension at 72 °C/8 min. Next, PCR products were charged and electrophoresed on 1% agarose gels, then visualized on a normal UV-transilluminator. PCR products that showed high quality, quantity and the expected sizes were sequenced by Sanger protocol performed by Genoscreen. Presence and homozygous SNPs in amplified locus was confirmed by ChromaSeq v1.31(Maddison, 2007).
For the seven amplicons that fitted the criteria, a second set of primers was designed for the NGS sequencing programs. This time, product size maximum 150 pb was set to produce an overlap in the amplified sequenced, increasing the estimation accuracy of the technique. The rest of parameters remained the same. An annealing temperature gradient test was performed at 54°C, 55°C, 56°C and 57°C using DNA samples from the final clones CUC1 and C6. After, PCR products were charged and electrophoresed on 2% agarose gels, revealed and visualized as in the previous primer set. The best
15 two pairs of primers, Z5477 (Forward 5’->3’ ACCTCCACCACAAATGGAAT, Reverse 5’->3’ TGGTTCAGTATTAGGT GATTTAACAGA) and Z5478 (Forward 5’->3’ GCCTAACTTGCTGGGTCAAC, Reverse 5’->3’ TTATAGTGCACACGGGAACA) were selected for NGS sequencing step.
2.1.4 Abacus construction
To verify that the amplicons accomplished the expected criterion, samples of CUC1 and C6 aphid clones with 30 different frequencies were prepared and subjected to the NGS step. Then, we built a proportion estimation curve between aphids clones, called “Abacus”. To that end, we compared the frequencies values obtained from NGS sequencing, called measured frequencies, and against the frequencies computed from the numbers of aphid clones present in each sample, called expected frequencies. This curve will allow us to estimate, calibrate and contrast the efficiency of our technique. Adults aphids reared in Vedrantais melo plants from CUC1 and C6 were collected and put in 1,5 ml Eppendorf following in the proportion 1-29, 2-28… n1-n2….29-1. Only a symbolic amount vegetal
material was introduce in the tubes. Two repetitions were done. Then, 60 Eppendorf tube were dived into liquid nitrogen and stored at -82°C and samples were sequenced by NGS (Figure 4).
Figure 4. Schematic construction of abacus. Four steps were done to develop the abacus: (1) Adults aphids A.
gossypii clones, CUC1(green) and C6(black), reared at 24°C: 18°C under a 16h:8h day/night photoperiod in
susceptible genotypes of Charentais were placed into (2)tubes at different proportions following 1-29, 2-28… n1-n2….29-1 with a symbolic amount of vegetal material. (3) DNA was extracted and sequenced by NGS methods. (4) Linear regression was done between NGS measured clone frequencies and expected clone frequencies of each tube to estimate accuracy of the technique.
2.2 Experimental design
16 Two clones of A. gossypii were used, CUC1 and C6. The C6 clone can feed, survive and reproduce successfully on melon lines even those containing the Vat resistance gene. The resistance to CMV was not triggered by C6 in Vat-resistant lines (Thomas et al., 2012) . C6 was collected on melon plants in the West Indies in 2011. The CUC1 clone can feed, survive and reproduce successfully on melon lines even those containing the Vat resistance gene (Thomas et al., 2012). The resistance to CMV was triggered by CUC1 in Vat-resistant lines. It was collected on melon crops in South Eastern France in 2012.
Both clones were reared and maintained on susceptible melon Védrantais plants in controlled growth chamber at 24°C: 18°C under a 16h:8h day/night photoperiod. Apterous aphid adults, synchronized to 1 day lifespan, with a lifetime of 6-7 days were used in the essays.
2.2.2 Plant lines
Two genotypes of Cucumis melo, one containing the Vat gene were used. Both genotypes are Charentais lines (Cantalupensis group). The Vat genotype, Charentais Vat R, shows aphid resistance originating from PI 161375. The cluster Vat was introgressed from this line into the Charentais T line. To that end, firstly, the Charentais T line was crossed with PI161375 and after, backcrosses were done multiple times between a resistant progeny and the Charentais T line. Seven generations backcrosses were done in order to obtain the resistant line, Charentais Vat R quasi-isogenic to Charentais T (Boissot et al., 2016).
Plants were grown in the INRA greenhouse facilities until they reached one or two leaves stages. Sphagnum peat moss was used as substrate and Liquioplant Rose solution was furnished daily. No chemical products were used in the greenhouse during plants growth.
2.2.3 Biological test
We hypothesized that genetic drift and natural selection evolution forces between two clone’s populations can be modulated under departure conditions. Three biological essays were performed to study the effect of departure frequencies, density and positioning. Departure conditions tested are in Table 1.
In each trial, 12 plants of each Charentais lines, with and without the Vat cluster, were infested. All tests were performed in the same climatic chamber at 24°C: 18°C under a 16h:8h photoperiod. Aphids were placed on the upper leaf side surface (adaxial). To prevent aphids leaving a plant from reaching another one, plants were isolated by putting each of them on a petri dish placed in a water-filled tray (Figure 5). Aphid populations were collected at 4 days and 8 days after infestation. Leaves, included cotyledon, stem and tendrils colonized by aphids were collected by using scissors and pliers. Attempts were made to collect the minimum amount of plant material. Finally, aphids and plant material were stocked in falcon’s tubes of 15ml or 50ml depending on the collected amount, and preserved in liquid nitrogen and stored at -80°C.
17 Table 1. Departure conditions for three biological essays. Number of adult aphids
were placed in the upper side of the melon leaves. In proportion and density, essay aphids were placed on the same leaf. In positioning essay aphid clones were placed on the same (T) or in different leaves (S).
Figure 5. Plants ready to be infested by aphids under control conditions. All tests were performed in the same climatic chamber at 24°C: 18°C under a 16h:8h photoperiod.
Number of CUC1: C6 aphids
Proportion 1:3 2:2 3:1 Density 1:1 2:2 3:3 4:4 5:5 6:6 Positioning 1:1 T 1:1 S
18
2.2.4 DNA extraction
The samples containing a pool of CUC1 and C6 aphids and plant material were subjected to an Isopropanol-Ethanol DNA extraction (Annex 1).The protocol involves three main steps like lysis, salt and protein precipitation (isopropanol) and DNA precipitation (ethanol) .
No purification protocol was done. DNA concentration and quality were assessed by using NanoDrop® ND-1000. 260-280 ratio may indicate the presence of protein, phenol or other contaminants, while 260-230 indicate the presence of co-purified contaminants. Only samples with higher values of 1.5 for both ratios were kept.
2.2.5 NGS sequencing
Samples were sequenced using Next Generation Sequencing (NGS) Illumina. The principle behind Illumina NGS is similar to that of Sanger sequencing. DNA polymerase catalyzes the incorporation of deoxyribonucleotide triphosphates (dNTPs) into a DNA Template strand during sequential cycles of DNA synthesis. Then, nucleotides are identified by fluorophore excitation in every single new cycle. The main difference is that, instead of sequencing a single DNA fragment, NGS sequences millions of fragments in a massively parallel fashion (Illumina, Fluidigm).
Illumina DNA sequencing has three general steps: Library preparation, sequencing and data pre-processing. They were done at EPGV research unit (Etude du Polymorphisme des Génomes Végétaux). To build libraries and clusters, we follow the 4-primer amplicon tagging strategy (Figure 6). First, primers Z5477 and Z5478 were redesigned to harbor and target-specific (TS). These new primers were combined in PCR amplification using 384 different sample-specific primer pairs that contain a barcoding sequence and the adaptor sequences enabling identify the samples in Illumina sequencing systems. 768 libraries, (384*2 amplicons) were constructed. Four pools, two pools per amplicon were constructed.
The raw data were filtered to remove sequences that have "too much" intensity corresponding to bases other than the called base. By default, the purity of the signal from each cluster is examined over the first 25 cycles and calculated as Chastity = Highest_Intensity / (Highest_Intensity + Next_Highest_Intensity) for each cycle. The default filtering implemented at the base calling stage allows at most one cycle that is less than the Chastity threshold (0,6) (Whiteford et al., 2009). After removing adapters and primers on the whole read data, EGVG team processed data to get high quality data (without contamination) following several and subsequent step: i) removing reads with a quality nucleotides lower than 20 from both ends, ii) discarding reads shorter than 30 nucleotides and iii) removing read pairs that come from the low-concentration spike-in library of Illumina PhiX Control. Next, reads data were mapped against the two reference locus using Burrows-Wheeler Aligner (BWA), software package for reads longer than 70pb. SNP calling by using SAMtools mpileup and Varscan germline generate a matrix output for each SNPS in locus 1 and locus 2. We obtained NGS SNPs data (i.e. for each samples the number of read for each SNP).
19 Figure 6. Amplicon tagging process (Illumina, Fluidigm). Tagged target-specific (TS) primer pairs
are combined with sample-specific primer pairs that contain a barcoding sequence and the adaptor sequences. CS1 = tag 1; CS2 = tag 2; TS = Target-specific primer sequence; PE1 = Paired end sequence 1; PE2 = Paired end sequence 2; BC = Barcode sequence.
2.2.5 Data analyses
From NGS SNPs data, we calculated for each SNPs the frequency of reads of C6 clone. Analyses were performed by the software Rstudio v1.1.456.
We analyzed the dynamics of evolution forces competition and genetic drift using parametric statistics (Student’s T Test and regression lines). Competition forces were studied by comparing the measured frequencies and the expected frequencies between clones in each modality and looking at the direction of this competition. Genetic drift presence was study in the remaining cases where competition forces were missing. To that end, we looked at the distribution of clone frequency values per modality, searching whose were more extreme.
3. Results
We designed 2 amplicons containing six and four SNPs for A. gossypii clones CUC1 and C6. We evaluated NGS for amplicons sequencing as tool to estimate frequencies of each clone in a population. Then, we investigated competition and drift in the experience we set up on two melon genotypes with these two clones.
3.1 Amplicons design
To distinguish between clones in a pool of the same species, it was necessary to develop a reliable amplicon. First, we did a variant calling comparing transcriptome sequences of CUC1 and C6, obtaining 2616 SNPs homozygous for each clone. Next, we filtered them subjected under the terms of a maximum length of 150 base pairs, comprising a minimum of 3 SNPs, with at least 50 bp from the first SNPs on both sides. We obtained 169 candidate sequences reduced to 36 after visualizing by IGV.
20 Then, a first set of 18 pair primers were designed to verify that SNPs were present in the 36 candidate sequences and homozygous in amplified locus of DNA samples (Table 2). Seven amplicons contain homozygous SNPs for CUC1 and C6 were confirmed by Sanger sequencing. Amplicons were also amplified for the three other clones C4, C9 and NM1, confirming that primers were designed in highly conserved sequences and amplicons are highly variable. A second set of 10 pair primers was designed to produce amplicons with 3 SNPs, and maximum length of 150bp. Z5477 and Z5478 were selected for NGS sequencing step (see Figure 7).
Both amplicons were different to expected from transcriptome data. In the amplicon 1, one intron or artefact sequence of 75 bp was found in the middle. This sequence contained 3 new SNPs homozygous for CUC1 and C6, increasing amplicon reliability. Accuracy of the 3 expected SNPs was reduce due to the offset of the overlap principle of NGS sequencing libraries construction (see Figure 7). Pair primer sequences of amplicon 2 included by mistake one of the three SNPS. It suggested that amplification of locus 2 was not specific for both clones.
Table 2. Amplification of first primer set for A.gossypii clones. Primer temperature gradient test reported successful (green) or unsuccessful (red) amplification per pairs of primers. Primer CUC1 C9 C4 C6 NM1 Z5444 Z5445 Z5446 Z5447 Z5448 Z5449 Z5450 Z5451 Z5452 Z5453 Z5454 Z5455 Z5456 Z5457 Z5458 Z5459 Z5460 Z5461
21 Figure 7. Amplicon characteristics. a) Homozygous SNPs (yellow), amplicon sequence (blue), primer (red arrow), primer sequence (striped red) and intron (green). b) Primer sequences
3.2 Frequency of specific amplicons as a predictor of frequency of clones
3.2.1 Coverage estimation
To estimate a clone frequency in a sample, it is necessary that all aphid individuals were represented with a minimum error rate. As recently studied, an average of 10 or more reads per diploid individual is necessary to get a relatively robust estimation (Gautier et al., 2013). So, we aimed at estimating the coverage, equal to number of reads/number of individuals, in the populations we collected.
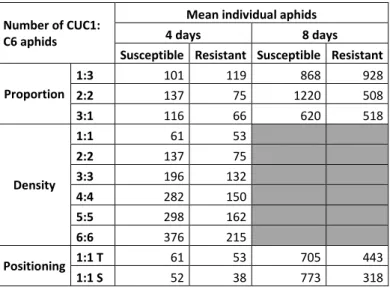
Number of reads per population was available for NGS SNP data. Because it was not possible to count all aphids in all population, we set up a specific infestation with all departure modalities on both resistant and susceptible lines (4 plants per line). Aphid numbers (Table 3) were considered as a proxy of initial aphid number in each population with the same departure condition.
22 Table 3. Aphid number estimation for the three biological essays.
Aphid were placed in the upper side of the melon leaves, population developed and were counted in four repetitions at 4 and 8 days.
Number of CUC1: C6 aphids
Mean individual aphids
4 days 8 days
Susceptible Resistant Susceptible Resistant Proportion 1:3 101 119 868 928 2:2 137 75 1220 508 3:1 116 66 620 518 Density 1:1 61 53 2:2 137 75 3:3 196 132 4:4 282 150 5:5 298 162 6:6 376 215 Positioning 1:1 T 61 53 705 443 1:1 S 52 38 773 318
We obtained a mean coverage of 33 (Table 4) reads. As shown in Figure 8, the mean coverage values were almost equal among the modalities. It also showed that read number variances were higher when the initial aphid numbers were lower, suggesting that an increase of initial aphid number reduces the number of read variance.
Table 4. Coverage estimations for amplicon 1. Mean coverage was estimated from number of reads and aphids number estimation per modality.
Number of CUC1: C6 aphids
Estimation coverages
4 days 8 days
Susceptible Resistant Susceptible Resistant Proportion 1:3 34.10 22.27 10.30 8.13 2:2 24.88 33.86 9.96 10.95 3:1 27.55 38.54 11.40 12.79 Density 1:1 95.83 118.76 2:2 53.28 43.04 3:3 14.87 23.52 4:4 21.50 29.54 5:5 22.53 28.13 6:6 16.20 15.37 Positioning 1:1 T 67.50 80.28 9.67 1:1 S 49.71 61.27 11.83 23.71
23 Figure 8. Number of reads sample per modality The line represents the mean reads per initial aphid number.
3.2.2 Relationship SNP frequencies and clones frequencies
SNP data give, for each sample, the number of reads for each SNP. To test if the frequency of C6/CUC1 clones in a sample is accurately represented by SNP C6/CUC1 frequencies in SNP data we built an ‘abacus’ with samples containing a mix of aphids with known frequencies.
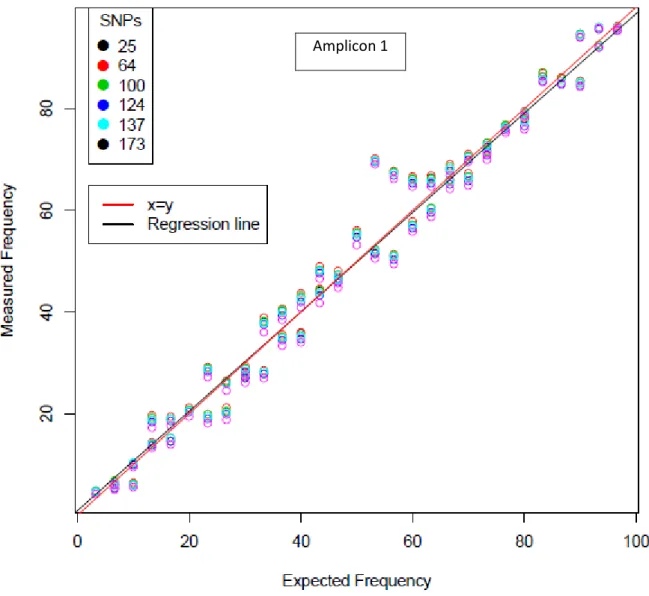
First we checked the consistency of the SNP data obtain for abacus samples. For amplicon 1, one factor Anova showed that 99,9% of the variation between SNPs frequencies was explained by sample number. For amplicon 2, only 64,0% of the variation between SNPs frequencies was explained by sample number.
Then, we investigated the relationship between measured and expected frequencies. The C6 SNPs frequencies of amplicon 1 and 2 were plot for each sample against the expected frequencies. The Figure 9 suggested that SNP frequency in amplicon 1 estimates accurately C6 frequency but not C6 SNP frequencies in amplicon 2. For amplicon 2, frequencies values appear rather disperse and not aligned among them, making them not an appropriate data (Figure 10). Thus, only the means SNPs frequencies
24 of amplicon 1 were used to estimate the frequency of C6/CUC1 clones (called measured frequency in the following).
Figure 9. Relationship between expected and measured frequencies of C6 clone in C6/CUC1 pool samples. Known C6 aphid frequencies (expected frequencies) were compared to measured frequencies obtained after NGS in each pool of amplicon 1.
Then, accuracy on C6 SNP frequency given by amplicon 1 was studied analyzing the linear relation between measured frequencies and expected frequencies (Figure 11). Firstly, regression line (black) was highly superposed with the diagonal y=x (green). This signifies that the measured frequencies were nearly equal to expected frequencies. Secondly, the confidence band at 95% of the regression line (red) was very thin, pointing out a strong correlation between measured and expected values. Then, we plotted the confidence interval (IC) band of predicted point (black) at 95% for the measured frequencies. Not surprisingly, only two values, 3% out of the total, were outside of the confidence interval. These two values exhibited, alongside two others, a singular alignment.
25 Figure 10. Relationship between expected and measured frequencies of C6 clone in C6/CUC1 pool samples. Known C6 aphid frequencies (expected frequencies) were compared to measured frequencies obtained after NGS in each pool of amplicon 2.
Finally, we checked if the fluctuations around the line may be due to an error during the sample preparation. We simulate expected frequencies if, during samples preparation, we did an error of one individual, one aphid CUC1 or C6, plus or minus. We plotted the simulated data. Measured values are partially superposed with the simulated values for the expected frequencies suggesting it could be one of the sources of error that lead to fluctuations with the expected frequencies. Values disposed outside of the confidence interval were not explained by these points, suggesting an unidentified source of error. Nevertheless amplicon 1 appeared suitable to study frequency of C6/CUC1 in a population. It was used in the following part of the study.
26 Figure 11. Accuracy of amplicon 1 to estimate C6 frequency. Four simulated values (color circles) for sampling error inplus or minus one aphid CUC1 (n1+1, n1-1; black and red) or C6 (n2+1, n2-1; green and blue) were plotted with measured values (black).
3.3 Evolution forces: competition vs drift
To study the competition and drift forces between CUC1 and C6 clones, we set up experiments with different departure frequencies, density and positioning of the two clones. Departure conditions tested are in Table 1. Then we estimated the C6 frequencies in populations that developed after 4 and 8 days.
3.3.1 Competitions forces
To study the presence or absence of competition forces between CUC1 and C6 clones in the population, we compared the initial frequencies with measured mean frequencies (Table 5). Globally, the results showed that competition was favorable to CUC1 (green) on susceptible plants and to C6 (red) on resistant plants.
We assume that the residual variance among plants of a given modality were equal, assuming either in aphid and plant growth as in experiment, conditions were strictly reproduced for each biological
27 essay. We used Student’s T Test to compared expected and measured means frequencies per
modality. Significant differences were found in 18 out of 31 modalities, meaning the presence of competition between clones.
Table 5. Competition between CUC1 and C6 clones. Absence or presence of competition was calculated by comparing initial frequencies with measured mean frequencies by Student’s T-Test at 95 confidence interval. Direction of competition was calculated by difference between measured mean and initial frequencies. Competition favored significantly (shiny green) or no significantly (subdued green) to CUC1. Competition favored significantly (shiny red) or no significantly (subdued red) to C6.
Number of CUC1: C6 aphids Competition
4 days 8 days
CUC1/C6 Susceptible Resistant Susceptible Resistant Proportion
1:3 7.50E+00 9.04E-02 1.55E-02 3.17E-01
2:2 5.97E-03 2.30E-03 1.87E-02 2.38E-01
3:1 1.02E-01 1.97E-02 1.97E-02 4.76E-02
Density 1:1 3.23E-01 8.51E-01 2:2 6.97E-02 1.66E-04 3:3 1.06E-01 3.45E-02 4:4 1.38E-02 4.59E-02 5:5 1.79E-03 4.12E-07 6:6 3.76E-03 8.55E-02
Positioning 1:1 T 9.43E-01 9.67E-04 2.09E-03 1:1 S 1.84E-01 2.18E-03 4.00E-01 6.96E-04
In the proportion essay, we tested three departures conditions 1:3, 2:2, 3:1. In susceptible plant, competition was visible as soon as 4 days at 2:2 departure conditions and for the all departure conditions at 8 days. Competition was visible as soon as 4 days in resistant plants at 2:2 and 3:1 departure conditions but only confirmed at 8 days for 3:1 departure conditions. For departure conditions 1:3 and 2:2 no significant competition might be related to fewer repetitions obtained for these modalities.
In density essay, we tested six departures conditions from 1:1 to 6:6, and we collected the populations only after 4 days. Competition was visible as soon as 4 days in susceptible plants at density over 3:3. Competition was visible in resistant plants at density from 2:2 to 5:5. For departure conditions 6:6 and no significant competition might be related to fewer repetitions obtained for this modality.
In positioning essays, we test either the two clones on the same leaf (Together) or on separate leaves (Separate), with departure conditions 1:1. No significant competition was found on susceptible plants; on resistant plants we observed competition after 4 days, and this competition still occurred after at 8 days.
3.3.2 Genetic drifts forces
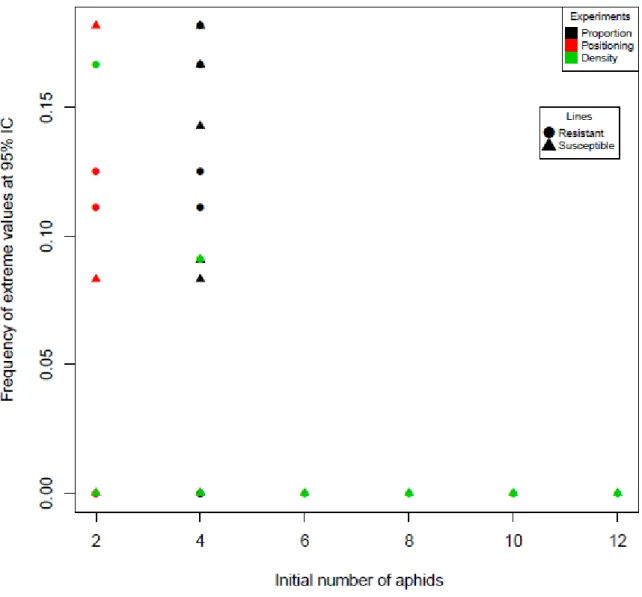
To study the presence or absence of genetic drift, we looked at the measured frequencies out of the IC at 95% (Figure 12). No extreme measured frequencies were found for any biological essay at initial number of aphid over 4. When initial number of aphid was 2, our results suggested that drift appeared in 5/9 modalities, and when initial aphid number was 4, in 8/14 modalities.
28 In Table 6, we calculated the Standard Deviation (SD). High values of SD were found at 1:1 for susceptible and resistant at 4 and 8 days. It indicated that there is a significant fluctuation in the measured frequencies when values of initial aphid number are small. In accordance, these results suggested that drift could be present when the initial aphid number is less than 4.
Figure 12. Distribution of frequencies fluctuations of C6 clone in C6/CUC1 pool samples. Points represent the mean measured frequencies outside of a confidence interval of 95% per modality.
29 Table 6. Drift in a population of CUC1 and C6 clones. Standard deviation(SD) of measured frequencies was used to investigate putative drift when no competition occurred (yellow). Repetions(n) are shown on the right side of SD vales. Extreme SD are in red.
Number of CUC1: C6 aphids Drift
4 days 8 days
CUC1/C6 Susceptible(n) Resistant(n) Susceptible(n) Resistant(n) Proportion 1:3 73.46 12 81.45 12 51.12 11 80.36 9 2:2 41.79 12 62.48 12 34.56 11 62.86 8 3:1 18.86 12 38.28 11 16.19 7 44.01 11 Density 1:1 54.58 11 48.42 12 2:2 45.42 12 70.63 11 3:3 41.93 11 60.67 11 4:4 41.87 8 58.15 12 5:5 37.69 9 71.04 11 6:6 40.45 10 58.00 9 Positioning 1:1 T 50.40 12 69.62 10 74.12 8 1:1 S 50.40 11 69.62 12 45.83 6 75.33 9
4. Discussion
4.1 Amplicon as a tool to study diversity
Target-gene amplicon sequencing is one of most exploited high-throughput sequencing application to study diversity in ecology. An increasing number of community studies are addressed by this new method. Recently, the use of amplicons to study the frequencies of different species in nature has been probed(Lindeque et al., 2013; Nunzio D’Agostino et al., 2017). In this study, we proposed to use this methodology to study the frequencies of different clones of the same species.
On the basis of a reference transcriptome of A. gossypii (Dutartre-Fricaux L et .al, 2014), two amplicons were successfully designed to differentiate CUC1 and C6 aphid clones. Despite the lack of a reference genome, designed amplicons were capable of differentiate CUC1 and C6 clones belonging to a same genetic cluster(Thomas et al., 2016). However, one genetic artefact in the middle of our amplicon 1 was founded, which displaced the reading frame and made not possible the overlapping of the target SNPs. This resulted in loss of reliability for the amplicon 1.
We could probe that the amplicons are able to distinguish aphid clones in a species if the SNPs contained in the amplicon are homozygous for both clones. Also, primers regions must be strongly conserved to avoid different specificity to one of the clones to study. This heterospecificity can mislead to real frequency of the clone in an individual pool.
In this study we affirmed that amplicon 1 estimated frequencies with a high performance. The construction of the “abacus” allowed to calculate the accuracy and power of technique and to assure above all if the measured frequencies were right. Although, note that this affirmation is only guaranteed for pools where aphids were reared in susceptible plants. Indeed, it was reported that
30 aphids that feed on resistant plant, may experience a size reduction and fewer progeny (Sattar, 2011). To check a putative bias on resistant plants it would be necessary to build another “abacus” rearing aphids in resistant plant.
We used quantified clone frequencies in biological essays under control conditions, but owing to its success, we figure that this technique can also estimate the evolution of aphid population in nature. For instance, the identification of one specific clone resistant to one group of pesticides may give farmers clues to face more efficiently to pest colonization, reducing cost management and ecological impact.
4.2 Evolution forces: Relation between competition and drift
It is a faith that evolution forces lead to changes in performance and adaptation capacities of species, such as resistant aphid clones of the melon-cotton aphid A. gossypii. Although, for a durable adaptation, these resistance genes may not impose a high penalty to the pathogen known as “ fitness penalty”(Leach et al., 2001). We posed the question of what would happen if two aphid clones adapted to host resistance appear at the same time and region. Would be both of them able to overcome the resistance?
The study methods for put in evidence the effect of competition were not either complex or expensive. Overall, the results showed that competition was favorable to CUC1 on susceptible plants and to C6 on resistant plants. Being more competitive means that one clone is able to reproduce more efficiently than another when both are present on a plant. This can be the results of better adaptations to the plant line (fitness) or to the interactions between clones. Then, we proposed to determine the nature of the competition by quantifying the reproduction rate of each clone, called intrinsic rate of increase, of both CUC1 and C6 separately in susceptible and resistant plants.
Two possible cases explanation are behind the nature of the competition for CUC1 in susceptible plants. i) CUC1 intrinsic rate of increase is higher in susceptible plants and lower in resistant plant than C6. It means that CUC1 reproduces better in susceptible but the fitness penalty due to adaptation to host resistance is higher for CUC1. ii) CUC1 intrinsic rate of increase is equal or lower in susceptible plants and lower in resistant than C6. This mean CUC 1 interferes somehow in interrupting the normal development of C6 on susceptible, suggesting that nature of competition is due to interactive behavior between clones.
The nature of the competition of C6 in resistant plant could be explained exclusively by the lack or small fitness penalty due to adaptation to host resistance of that clone. It was probed that CUC1 triggered the immunity plants defense, while C6 do not activate effector-triggered immunity. During this study, immunity plant defense was activated via effector-triggered immunity by CUC 1. Then, this highly suggested that CUC 1 has a higher fitness penalty than C6 to their adapation to the Vat resistance
No basic methods are available to expose the effect of drift. As a preliminary study to evaluate the effect of drift in a mix of CUC1 and C6 clones, we observed that drift can be present when the initial aphid numbers is less than 5 per plant. These results are be consistent with drift because frequencies varies randomly over time usually and it occurs in small populations. Also, competition effects and drift were found together when number of populations was weak, suggesting that drift and competition are not exclusionary.