Consequences of a dietary phosphorus and calcium
depletion and repletion strategy in
growing-finishing pigs
Thèse
Enrique Gonzalo Martinez
Doctorat en sciences animales
Philosophiae doctor (Ph. D.)
Québec, Canada
Consequences of a dietary phosphorus and calcium
depletion and repletion strategy in
growing-finishing pigs
Thèse
Enrique Gonzalo Martinez
Sous la direction de :
Marie-Pierre Létourneau-Montminy, directrice de recherche
Candido Pomar, codirecteur de recherche
iii
Résumé
Le phosphore (P) des aliments pour les porcs est partiellement retenu (30-35%) en raison de l’absence de phytase endogène dans leur tube digestif ; le restant étant excrété et potentiellement à risque pour l’environnement par des phénomènes d’eutrophication. Il est ainsi courant d’ajouter des phosphates dans les aliments pour combler les besoins en P, lesquels constituent une ressource naturelle limitée et parfois coûteuse. Ainsi, la réduction du P alimentaire est prioritaire pour la production porcine depuis plusieurs années. Une des voies pour y arriver est l’augmentation de son efficacité d’utilisation par l’animal. Cette augmentation peut être liée aux modifications nutritionnelles (ex. : phytases exogènes) ou aux adaptations digestives et métaboliques de l’animal en réponse à une carence soit par exemple en utilisant des stratégies de déplétion-réplétion. Ceci consiste à alimenter un animal au-dessous de ses besoins en P durant une certaine période (déplétion) et avec un aliment non carencé (réplétion) par la suite. L'impact d’une telle stratégie sur les performances de croissance, la minéralisation osseuse, les propriétés mécaniques des os, la concentration plasmatique de P et Ca et des transporteurs intestinaux et rénaux liées au métabolisme phosphocalcique ont été étudiés dans la présente thèse. Deux essais ont été effectués avec des porcs en croissance recevant un régime témoin (C) avec des apports adéquats de P et Ca ou un régime faible (L) apportant 60% des besoins. Dans le premier essai, 60 mâles castrés [poids vif (PV) initial 14 ± 1,6 kg] ont été alimentés pendant quatre phases de 28 jours avec différentes séquences d’alimentation [CCCC, CLCC, CCLC, CCCL, LCLC ou LLLL]. Dans le deuxième essai, 80 mâles castrés [PV initial 24 ± 3,0 kg] ont été alimentés pendant trois phases de 28 jours avec les séquences suivantes : CCC, CLC, LCC, LLC ou LLL. Dans les deux essais, la consommation journalière individuelle moyenne d’aliment et le poids vif ont été enregistrés et le corps entier et vertèbres lombaires (L2-L4) scannées au début et à la fin de chaque phase de croissance par absorptiométrie aux rayons X (DXA) afin de mesurer leur teneur corporelle en protéines, lipides, P et Ca ainsi que leur contenu minéral osseux (CMO) et densité minérale osseuse (DMO). Des échantillons de sang ont été prélevés pour déterminer les concentrations plasmatiques de P, Ca et vitamine D3 ainsi que des échantillons post-mortem de jéjunum et de rein afin d'étudier l'expression génique et protéique des transporteurs de P, Ca et vitamine D3. Le fémur et le métacarpe ont été aussi collectés pour étudier leurs propriétés mécaniques par des tests de flexion. Le P digestible et le Ca total ont été déplétés respectivement de 36% et 22% dans le premier essai. Dans cet essai, la déplétion a réduit la minéralisation osseuse et les performances de croissance des animaux
iv
CCCL et LLLL et les porcs réplétés CCLC ont présenté des performances similaires aux CCCC. Les porcs CCLC et CLCC ont récupéré leur contenu minéral osseux (CMO) à la fin de l'essai grâce à une utilisation plus efficace de P et Ca alimentaires. Dans le deuxième essai, la réduction du P digestible et Ca total alimentaire a été de 35% et 42%, respectivement. La déplétion dans cet essai a réduit les performances de croissance, le CMO et les propriétés mécaniques des os. Dans la dernière période, l’efficacité d’utilisation du Ca alimentaire a été supérieur chez les porcs LLL mais inférieur chez les animaux réplétés (CLC, LCC et LLC) par rapport aux CCC, et donc n’ont pas pu rattraper la minéralisation à la fin de l’expérience. Comparativement aux porcs témoins, les transporteurs intestinaux et rénaux de Ca des porcs déplétés ont été surexprimés dans la deuxième phase, tandis que ceux du P ont été sous-exprimés chez les réplétés, soit une réponse de type parathormone. Les différents os du squelette répondent différemment aux modifications alimentaires de P et Ca, avec notamment les vertèbres qui sont plus sensibles à la déplétion-réplétion en P comparativement au squelette entier. Les performances de croissance, les propriétés mécaniques des os et la concentration plasmatique de P et Ca ne sont pas de bons indicateurs de la minéralisation corporelle. En somme, une déplétion en P alimentaire améliore son utilisation digestive et métabolique, laquelle peut être maintenue même pendant la réplétion. Cependant, une carence similaire ou plus importante en P qu’en Ca semble nécessaire pour engendrer des adaptations menant à une meilleure efficacité d’utilisation de P. En conclusion, la déplétion-réplétion en P est une stratégie prometteuse pour réduire le P alimentaire mais demande d’être encore affinée, notamment par une meilleure compréhension des régulations.
v
Abstract
Phosphorus (P) in pig feed is partially retained (30-35%) due to the absence of endogenous phytase in its digestive tract; the remainder being excreted and potentially at risk for the environment by eutrophication phenomena.It is thus common to add phosphates in feed to fulfill P requirements, which constitutes a limited and sometimes costly natural resource.
Thus, the reduction of dietary P supply has been a priority for the pig production industry for several years now. One way to achieve this objective is to increase its utilization efficiency by the animal. This increase may be related to nutritional changes (e.g., exogenous phytases) or to digestive and metabolic adaptations of the animal in response to dietary deficiencies such as the depletion-replication strategy. This involves feeding an animal below its P requirements for a certain period (depletion) followed by a non-deficient diet (repletion) thereafter. The impact of this strategy on growth performance, bone mineralization and mechanical properties, plasmatic P and Ca concentration and intestinal and renal transporters related to phosphocalcic metabolism have been studied in this thesis. Two trials were performed with growing pigs receiving a control (C) or a low (L) diet, which supplied 100% and 60% of the P-Ca requirements, respectively. In the first trial, sixty castrated male pigs (initial body weight (BW) 14 ± 1.6 kg) were fed during four 28-days feeding phases with different feeding sequences [CCCC, CLCC, CCLC, CCCL, LCLC or LLLL]. In the second trial, 80 castrated male pigs [initial BW 24 ± 3.0 kg] were fed during three 28-days phases with the following sequences: CCC, CLC, LCC, LLC or LLL. In both trials, individual average daily feed intake and weekly BW were recorded, and whole-body and lumbar vertebrae (L2-L4) were scanned at the beginning and at the end of each growing phase with dual-energy X-ray absorptiometry (DXA) to measure whole-body mineral, protein, lipid, P and Ca contents and bone mineral content and density (BMC, BMD; respectively). Blood samples were collected to determine P, Ca and vitamin D3 plasmatic concentrations, and samples of mid-jejunum and kidney were collected post-mortem to study the gen and protein expression of P, Ca and vitamin D3 transporters. Moreover, femur and metacarpal were also collected to study their mechanical properties by the bending test. In the first trial digestible P and Ca depletion was 36% and 22%, respectively. Depletion of this trial reduced bone mineralization and growth performances of CCCL and LLLL pigs, and CCLC pigs had similar performances than CCCC pigs. Both CCLC and CLCC pigs recovered BMC at the end of the trial as a result of a higher dietary P and Ca utilization efficiency. In the second trial, dietary digestible P and Ca reduction was 35% and 42%,
vi
respectively. Depletion in this trial reduced growth performance, BMC and bone mechanical properties. In the last phase and compared to control pigs, the utilization efficiency of dietary Ca was higher in LLL and lower in repleted pigs (CLC, LCC, LLC) which were not able to recover bone mineralization at the end of the trial. Compared to control pigs, the intestinal and renal Ca transporters of depleted pigs were overexpressed in the second phase, whereas those of P were under-expressed in the repleted pigs, probably due to the synthesis of parathormone. The different bones of the skeleton respond differently to dietary P and Ca modifications, where vertebrae are more susceptible to P depletion-repletion compared to the whole skeleton. Growth performance, bone mechanical properties and plasma concentration of P and Ca are not good indicators of body mineralization. In summary, a depletion in dietary P improves its digestive and metabolic utilization, which can be maintained even during repletion. However, a similar or greater deficiency in P than in Ca seems necessary to develop adaptations leading to a better P utilization efficiency. In conclusion, a dietary P depletion-replication is a promising strategy for reducing P supply but further refinement is needed, in particular through a better understanding of the regulations involved.
vii
Table of contents
Résumé ... iii
Abstract ... v
Table of contents ... vii
List of tables ... xii
List of figures ... xiii
Shortcut list ... xv Acknowledgements ... xviii Avant-Propos ... xx CHAPTER I ... 1 1. Introduction ... 1 CHAPTER II ... 7 2. Literature Review ... 7
2.1 Minerals in the body ... 8
2.1.1 General description ... 8
2.1.1.1 Calcium ... 8
2.1.1.2 Phosphorus ... 9
2.2 Calcium and phosphorus metabolism ... 10
2.2.1 Fluxes of calcium and phosphorus ... 10
2.2.1.1 Intestinal metabolism ... 10 a) Calcium ... 10 b) Phosphorus ... 12 2.2.1.2 Renal metabolism ... 13 a) Calcium ... 13 b) Phosphorus ... 14 2.2.1.3 Bone metabolism ... 15
a) Bone composition and structure ... 15
b) Bone modelling and remodelling ... 16
2.2.2 Calcium and phosphorus homeostasis ... 17
2.2.2.1 Parathyroid hormone ... 17
2.2.2.2 Calcitriol ... 18
viii
2.3 Dietary phosphorus utilization by pigs ... 20
2.3.1 Current situation in swine production ... 20
2.3.2 Feed formulation systems ... 21
2.3.2.1 Total P ... 21
2.3.2.2 Digestible P ... 21
2.3.2.3 Available P ... 22
2.3.3 Dietary phosphorus ... 23
2.3.3.1 Forms of P content in diets ... 23
2.3.3.2 Phytic acid & Phytates ... 24
2.3.4 Estimation of P excretion by pig farms ... 25
2.3.4.1 Manure P quantification ... 25
2.3.4.2 Feed balance ... 26
2.3.5 Phosphorus requirements in growing pigs ... 27
2.3.5.1 Criteria of response ... 27
a) Growth performance ... 27
b) Bone ... 27
b1. Bone ash content ... 27
b2. Bone biomechanics ... 28
b3. Scanning ... 30
2.3.5.2 Method of determination ... 31
2.3.6 Factors modulating dietary P utilization ... 32
2.3.6.1 Modulating P use by feed-related factors ... 32
a) Endogenous and exogenous phytases ... 32
b) Other alternatives ... 35
2.3.6.2 Modulating P use by animal-related factors ... 35
a) Impact of reducing dietary calcium ... 36
b) Impact of reducing dietary P ... 38
Research objective and hypothesis ... 41
CHAPTER III ... 43
3. Consequences of dietary calcium and phosphorus depletion and repletion feeding sequences on growth performance and body composition of growing pigs ... 43
3.1 Résumé ... 44
ix
Implications ... 46
3.3 Introduction ... 46
3.4 Material and methods ... 47
3.4.1 Animals and feeding ... 47
3.4.2 Measurements ... 48
3.4.3 Calculations ... 49
3.4.4 Chemical analysis ... 49
3.4.5 Statistical analysis ... 50
3.5 Results ... 50
3.5.1 First growing phase ... 50
3.5.2 Second growing phase ... 51
3.5.3 Third growing phase ... 51
3.5.4 Fourth growing phase ... 52
3.6 Discussion ... 53
3.6.1 Impact of calcium and phosphorus depletion ... 53
3.6.2 Impact of calcium and phosphorus repletion ... 55
3.7 Acknowledgements ... 57
3.8 References ... 57
CHAPTER IV ... 65
4. The effects of a calcium and phosphorus depletion-repletion strategy on growth performance, body composition and related genes and proteins expression in growing pigs ... 65
4.1 Résumé ... 66
4.2 Abstract ... 67
Implications ... 68
4.3 Introduction ... 69
4.4 Material and Methods ... 70
4.4.1 Animals and feeding strategy ... 70
4.4.2 Measurements and calculations ... 71
4.4.2.1 Growth performance and body composition ... 71
4.4.2.2 Expression of genes associated with the phosphocalcic metabolism in the jejunum and kidney ... 72
4.4.2.3 Expression of proteins associated with the phosphocalcic metabolism in the jejunum and kidney ... 74
x
4.4.2.5 Statistical analyses ... 75
4.5 Results ... 76
4.5.1 First feeding phase ... 76
4.5.2 Second feeding phase ... 77
4.5.3 Third feeding phase ... 79
4.6 Discussion ... 81
4.6.1 Effect of calcium and phosphorous depletion ... 81
4.6.2 Effect of calcium and phosphorus repletion ... 84
4.7 Acknowledgements ... 87
4.8 References ... 88
CHAPTER V ... 105
5. Effect of dietary calcium and phosphorus deficiency on bone mineralization and mechanical properties in growing pigs ... 105
5.1 Résumé ... 106
5.2 Abstract ... 107
Implications ... 108
5.3 Introduction ... 109
5.4 Materials and methods ... 109
5.4.1 Animals and feeding strategy ... 109
5.4.2 Growth performance measurements ... 110
5.4.3 Measurement of bone mineral content and density of total body, L2-L4 vertebrae, femur and hoof ... 110
5.4.4 Mechanical properties of femur and metacarpal bone ... 111
5.4.4.1 Femoral analysis ... 111
5.4.4.2 Metacarpal analyses ... 112
5.4.5 Chemical analyses ... 113
5.4.6 Statistical Analyses ... 113
5.5 Results ... 114
5.5.1 Growth performance and bone mineral content and density ... 114
5.5.2 Mechanical properties of femur and metacarpal ... 115
5.5.3 Principal component analysis (PCA) ... 116
5.6 Discussion ... 117
5.6.1 Mechanical bone properties ... 118
xi
5.7 Acknowledgements ... 122
5.8 References ... 123
CHAPTER VI ... 131
Discussion ... 131
6.1 Adaptation of growing pigs to dietary P and Ca depletion and repletion as a way of increasing P and Ca utilization efficiency ... 132
6.1.1 Differences found between our trials ... 132
6.1.2 Depletion-repletion strategy vs phytase addition ... 137
6.2 Relation between whole-body mineralization and several criteria studied in the present study... 137
6.2.1 Growth performance ... 138
6.2.2 Bone mineralization criteria ... 143
6.2.3 Mechanical bone properties ... 144
6.2.4 Intestinal and renal P, Ca and vitamin D transporters ... 147
6.2.5 Plasmatic P, Ca and vitamin D3 concentration ... 148
6.3 Impact of the thesis on the understanding of Ca and P metabolism modulation versus dietary P and Ca depletion and repletion in growing pigs ... 152
Conclusions and perspectives ... 157
xii
List of tables
Table 2.1 Phosphorus nature of dietary ingredients (Rebollar and Mateos, 1999) ... 23 Table 2.2 Calculation of several bone mechanical parameters1 ... 29
Table 3.1 Ingredients and chemical composition of experimental pig diets (as-fed basis)1 ... 60
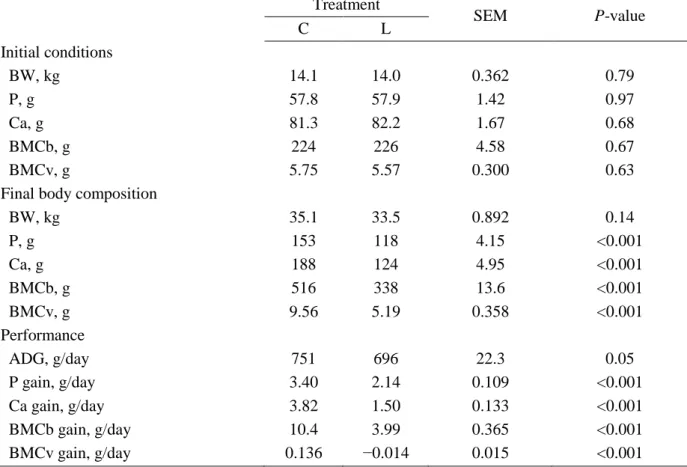
Table 3.2 Growth performance and bone mineralization in pigs from 15 to 35 kg body weight1 ... 61
Table 3.3 Growth performance and bone mineralization in pigs from 35 to 70 kg body weight1
... 62
Table 3.4 Growth performance and bone mineralization in pigs from 70 to 100 kg body weight1
... 63
Table 3.5 Growth performance and bone mineralization in pigs from 100 to 130 kg body
weight1 ... 64
Table 4.1 Ingredients and chemical composition of experimental diets (as-fed basis)1 ... 93
Table 4.2 Impact of phosphorus and calcium supply on body composition and growth
performance of pigs during growing phase 1 (25-50 kg)1 ... 94
Table 4.3 Impact of phosphorus and calcium supply on body composition and growth
performance of pigs during growing phase 2 (50-75 kg)1 ... 95
Table 4.4 Mid-jejunum genes and proteins expression related to phosphorus, calcium and
vitamin D metabolisms in pigs at the end of the second growing phase1 ... 97
Table 4.5 Kidney genes and proteins expression related to phosphorus, calcium and vitamin D
metabolisms in pigs at the end of the second growing phase1 ... 98
Table 4.6 Impact of phosphorus and calcium supply on body composition and growth
performance of pigs during growing phase 3 (75-100 kg)1 ... 99
Table 4.7 Mid-jejunun genes and proteins expression related to phosphorus, calcium and
vitamin D metabolisms in pigs at the end of the third growing phase1 ... 101
Table 4.8 Kidney genes and proteins expression related to phosphorus, calcium and vitamin D
metabolisms in pigs at the end of the third phase1 ... 102
Table 4.9 Polymerase chain reaction primer sequences, GenBank accession numbers, and
amplicon size for studied and reference genes1 ... 103
Table 5.1 Ingredients and chemical composition of experimental pig diets (as-fed basis)1 . 129
Table 5.2 Growth performance, bone mineralization and bone mechanical properties of pigs
xiii
List of figures
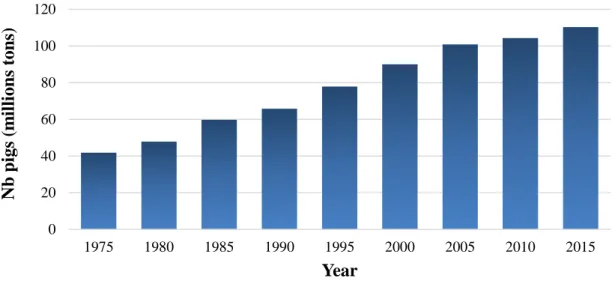
Figure 1.1 Time-line evolution of pig production worldwide, in millions of tones (source:
USDA, 2015; FAO, 2015) ... 2
Figure 1.2 Time-line evolution of pig production in Canada, in thousands of heads (source: USDA, 2015; Brisson, 2000) ... 3
Figure 1.3 Estimation of the global phosphorus production (adapted from Cordell et al., 2009) ... 4
Figure 1.4 Time-line evolution of rock phosphate price worldwide (source: indexmundi.com) ... 5
Figure 2.1 Model of mechanisms of calcium transport in intestinal epithelium (Adapted from Goltzman et al., 2015) ... 10
Figure 2.2 Metabolism of vitamin D (from Henry and Norman, 1984) ... 19
Figure 2.3 Phytic acid molecule (Sauveur, 1989) ... 24
Figure 2.4 Mechanical test made in bones (adapted from Bankoff, 2007) ... 28
Figure 2.5 Mechanical test made in bones (adapted from Nordin and Frankel, 2001) ... 28
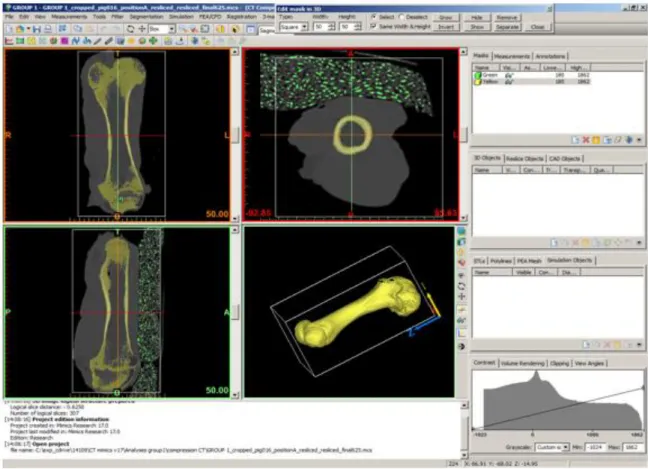
Figure 2.6 Whole-body scan of an individual pig by DXA and Lunar Prodify software ... 30
Figure 2.7 Scan of a pig femur by CT and Mimics software ... 31
Figure 2.8 Hormonal flux in hypocalcemia conditions ... 37
Figure 2.9 Hormonal flux in hypophosphatemia conditions ... 39
Figure 5.1 Principal component analysis of whole-body mineral density and different mineral densities of all growing pigs at 100 kg BW123 ... 126
Figure 5.2 Principal component analysis of whole-body mineral density and femoral mechanical properties of all growing pigs at 100 kg BW123 ... 127
Figure 5.3 Principal component analysis of whole-body mineral density and metacarpal mechanical properties of all growing pigs at 100 kg BW123 ... 128
Figure 6.1 Digestible phosphorus utilization efficiency of pigs of the 1st experience ... 133
Figure 6.2 Bone mineral content of pigs of the 1st experience ... 133
Figure 6.3 Digestible phosphorus utilization efficiency of pigs of the 2nd experience ... 134
Figure 6.4 Bone mineral content of pigs of the 2nd experience ... 134
Figure 6.5 Average daily feed intake between control pigs of both experiences ... 136
Figure 6.6 Average daily feed intake between control pigs of both experiences ... 136
xiv
Figure 6.8 Feed intake in control and low pigs of the 1st experience ... 139
Figure 6.9 Feed intake in control and low pigs of the 2nd experience ... 140
Figure 6.10 Average daily gain in control and low pigs of the 2nd experience ... 140
Figure 6.11 Relation between body protein and mineral content in control and low pigs of the
1st experience ... 141
Figure 6.12 Relation between body protein and mineral content in control and low pigs of the
2nd experience ... 142
Figure 6.13 Regression analysis between femur, L2-L4 vertebrae and feet mineral content with
whole-body mineral density of all pigs of the 2nd experience ... 144
Figure 6.14 Regression analysis between maximal force of femur and metacarpal with
whole-body mineral density of all pigs of the 2nd experience ... 146
Figure 6.15 Regression analysis between maximal bending moment of femur and metacarpal
with whole-body mineral density of all pigs of the 2nd experience ... 146
Figure 6.16 Plasmatic P concentration in control and low pigs in the 2nd experience ... 149
Figure 6.17 Plasmatic Ca concentration in control and low pigs in the 2nd experience ... 149
Figure 6.18 Plasmatic vitamin D3 concentration in control and low pigs in the 2nd experience ... 150
Figure 6.19 Principal component analysis with different criteria analyzed in CCC pigs of the
2nd experience12 ... 151
Figure 6.20 Digestive and metabolic adaptations versus Ca depletion ... 153 Figure 6.21 Digestible P utilization efficiency between control and low pigs in 1st experience ... 154
Figure 6.22 Ca utilization efficiency between control and low pigs in 1st experience ... 154
Figure 6.23 Digestible P utilization efficiency between control and low pigs in 2nd experience ... 155
xv
Shortcut list
ADFI Average daily feed intake
ADG Average daily gain
ADP Adenosine diphosphate
AMP Adenosine monophosphate
AP Alkaline phosphatase
ARC Agricultural research council
ATP Adenosine triphosphate
Bendmo Bending moment
BMC Bone mineral content
BMCb Bone mineral content in the whole-body
BMCf Bone mineral content in femur
BMCh Bone mineral content in hoof
BMCv Bone mineral content in lumbar L2-L4 vertebrae
BMD Bone mineral density
BMDb Bone mineral density in the whole-body
BMDf Bone mineral density in femur
BMDh Bone mineral density in hoof
BMDv Bone mineral density in lumbar L2-L4 vertebrae
BW Body weight
C Control diet
Ca Calcium
CMO Contenu minéral osseux
CP Crude protein
CT Computed tomography
d Day
Def Deformation
DXA Dual X-ray absorptiometry
DDGS Dry distillers grains with solubles
DM Dry matter
G:F Gain to feed
GLM General linear model
GMQ Gain moyen quotidien
fBMC Final bone mineral content
fBMD Final bone mineral density
iBMC Initial bone mineral content
iBMD Initial bone mineral density
L Low diet
Lin Linear effect
mBend. Moment Bending moment at the maximal point
Mcal Mega calories
MCP Monocalcium phosphate
mDef Deformation at the maximal point
mForce Breaking strength at the maximal point
Min Mineral
mMod. elasticity Modulus of elasticity at the maximal point
xvi
Mod Modulus
Modelas Modulus of elasticity
mRNA Messenger ribonucleic acid
mStress Stress at the maximal point
mStrain Strain at the maximal point
NE Net Energy
NRC National Research Council
P Phosphorus
PCA Principal component analysis
PTH Parathormone
PV Poids vif
Qua Quadratic effect
Vit Vitamin
yBend. Moment Bending moment at the yield point
yDeformation Deformation at the yield point
yForce Breaking strength at the yield point
yMod. Elasticity Modulus of elasticity at the yield point
yStrain Strain at the yield point
xvii
To the “Gonzalo Martinez team”, for helping me to arrive until here
xviii
Acknowledgements
À Marie-Pierre et Candido, les piliers de ma thèse ... que puis-je vous dire après tant de moments de contact au cours de ces dernières années? Je n'ai pas assez de mots pour vous remercier de m’avoir donné l'occasion de réaliser une des meilleures expériences de ma vie. Merci pour votre temps, votre patience et dévouement. Toujours de bonne humeur, positifs et professionnels. J'ai beaucoup appris avec vous et toujours de la façon la plus proche et facile possible. Cela a été un vrai plaisir personnel et professionnel de travailler avec vous.
Et merci au reste de l'équipe: à Normande (la “mère de l’équipe”), Marcel (“the artist”), Sophie (la “nouvelle mère”)…pour tant d’heures de travail tout en conservant la joie, la bonne humeur et le savoir-faire ... vous êtes la meilleure équipe que j’aurais pu avoir trouvée!
To Thomas, to give me the opportunity to make a part of my thesis with you…what a wonderful experience! It was a great pleasure to work with you, your explanations, your points of view…always available for such rich conversations! Thanks a lot for sharing your knowledge in a so kindly way.
And thanks as well to the rest of the team (Laura, Mariola, Debby, Ben…) for the good atmosphere, for your support and the healthy lunch breaks.
À la famille québécoise et internationale du centre de recherche de Lennoxville et Sherbrooke, pour avoir contribué à rendre mon stage inoubliable parmi vous. Qui pouvait imaginer que j’allais rencontrer des gens aussi charmants dans un petit centre de recherche? Merci de tant de discussions à la cafétéria, de tant de bons moments, de votre contact si humain et proche, d’être, les uns et les autres, une «famille» si spéciale et unique.
To the bresilian-portuguese family first and the chilene-argentinan-colombian family thereafter, because you treated me like a « brother » since the first moment I met you. Great souvenirs that I still remember. Madison was even better that I could expected thanks to you all.
À la famille québécoise et internationale de l’Université de Laval pour m’avoir fait sentir que j’étais un des vôtres dès le début. Pour tant de repas, de conversations, de rires, et de soutien dans la deuxième étape de mon doctorat…vous êtes une super équipe ! Courage, il vous reste très peu…qui est le suivant?
xix
À la famille espagnole du Québec, pour m’avoir accueilli depuis le début et pour avoir approché l'Espagne, son soleil et sa joie à travers l'océan. Des moments vraiment sympas à travers des discussions, des repas, les ferias de Jerez, les bières…
À la "princesse des neiges", pour m’avoir suivi pendant une grande partie de cette belle et passionnante aventure ... ce fut une folie géniale! Toujours à la recherche d'une aventure plus risquée à chaque fois. Merci pour tant de choses ! Ton soutien, ta joie, ton affection…
A Zaragoza y mi gente (alparceros, rojeras, comunio, scouts, Vlissingen, cofradía...), porque siempre me tratasteis como si nunca me hubiera ido (y han pasado unos cuantos años y varios paises desde la primera vez que me fui…) y porque siempre estuvisteis y seguis estando ahi, sois muy grandes. Estar con vosotros en Navidad, aunque solo fueran unos diitas, me daba mucha mas vida y apoyo del que os podais imaginar. Nos quedan aun muchas « ambar » que tomar juntos para celebrar todas las buenas noticias que nos depare el futuro.
À ma famille, les anciens et les nouveaux membres, pour un amour constant et infini qui ne connaît pas les distances, pour m’avoir soutenu dans chacun des projets que j'ai entrepris, pour me donner des ailes afin de réaliser mes rêves à chaque fois plus ambitieux ; pour être la "meilleure équipe" que j’aurais pu avoir. Merci pour tout, merci pour tant de choses. Et pour que cela soit une merveilleuse expérience parmi beaucoup d'autres qui sont à venir.
Pour les amis les plus proches que j'ai rencontrés à Shebrooke, Madison, Québec ... cela ne finit pas ici. Malgré les distances, venez chez moi quand vous voudrez (où que je soie), ma porte sera toujours ouverte pour vous, et il nous reste encore de nouvelles aventures à jouir ensemble. Je pourrai ainsi vous rendre les joies et les bons moments dont vous m’avez fait cadeau pendant toutes ces années et qui m’ont fait tant de bien. Je vais déjà commencer à garder des câlins en attendant.
See you some day somewhere.
“It is the same with people as it is with riding a bike. Only when moving can one comfortably maintain one’s balance” (Albert Einstein)
xx
Avant-Propos
The present thesis is composed by an introduction and context (Chapter 1), a literature review of precedent articles ending with the research objectives and hypothesis of the thesis (Chapter 2), three scientific articles (Chapter 3 to 5), and by a discussion, conclusions and perspectives of the study (Chapter 6). The author of the thesis is the principal author of the articles of chapters 3-5, and he was implicated in all the steps necessary for the preparation of each article: data collection, laboratory and statistical analysis and writing in collaboration between Agriculture and Agri-Food Canada (Sherbrooke, Qc, Canada), Wisconsin University (Madison, WI, USA) and Laval University (Quebec, Qc, Canada). First article is already submitted, and the other two articles will be sent to scientific journals for publication.
Article 1: Consequences of dietary calcium and phosphorus depletion and repletion feeding
sequences on growth performance and body composition of growing pigs
Enrique Gonzalo, Marie-Pierre Létourneau-Montminy, Agnès Narcy, Jean Bernier and C. Pomar.
Article submitted and accepted in Animal Journal.
Article 2: The effects of a calcium and phosphorus depletion-repletion strategy on growth
performance, body composition and related genes and proteins expression in growing pigs Enrique Gonzalo, Marie-Pierre Létourneau-Montminy, Marie-France Palin, Agnès Narcy and Candido Pomar
Article will be submitted in Journal of Nutrition.
Article 3: Effect of dietary calcium and phosphorus deficiency on bone mineralization and
mechanical properties in growing pigs
Enrique Gonzalo, Marie-Pierre Létourneau-Montminy, Thomas D. Crenshaw and Candido Pomar.
1
CHAPTER I
1. Introduction
2
Just a few decades ago, pork production was principally extensive and pigs were reared in small and familial facilities, however, the increase in global demand for pig meat and the posterior technological advances, modified this system towards an intensive production with a higher animal density in small areas (Fredeen and Harmon, 1983). In fact, pig production has progressively increased worldwide by 4 times in the last 60 years, from 25 million tons in 1960 until 110 million tons (Figure 1.1), representing the most produced and consumed meat nowadays (Galloway et al., 2007; FAO, 2015).
Figure 1.1 Time-line evolution of pig production worldwide, in millions of tones (source:
USDA, 2015; FAO, 2015)
Regarding the actual area of pig production, more than 50% is reared in China (57 million tons), followed by the European Union (22% of the total, ~25 million tons), and USA (~10% of the total, 11 million tons; USDA, 2015). In Canada, pig production has increased from 650 thousand tons in the seventies until 1.9 million tons in 2015, which supposes around 13 million pigs produced per year (Figure 1.2). In Quebec around 6.2 million growing pigs and 295.000 sows are produced every year (11% of the total animal production in Quebec) which constitutes the second most important agricultural production in terms of economy with a revenue of 1.3 milliard dollars in 2015 (MAPAQ, 2014).
0 20 40 60 80 100 120 1975 1980 1985 1990 1995 2000 2005 2010 2015 Nb p igs (m il li on s tons ) Year
3
Figure 1.2 Time-line evolution of pig production in Canada, in thousands of heads (source:
USDA, 2015; Brisson, 2000)
Production intensification has however resulted in a negative impact on the environment. Indeed, monogastric diets based on plant ingredients present 65% of P as phytic acid which is poorly available for pigs because of the lacking of phytase enzyme. Then, to meet the P requirement of monogastric animals, inorganic P is added to feeds in the form of phosphates (principally mono- or dicalcium phosphate) or from animal sources (e.g. meat and bone meal, fish meal). However the non-retained fraction of P is excreted which may entail eutrophication in areas of intensive animal production (Correll, 1998; Sims et al., 2000).
It should be noted that rock phosphate is a non-renewable resource for which there is no substitute, it could run out in the next 50-100 years (Figure 1.3) and most of the world’s supply comes from Morocco, China and USA (Gunther, 2005).
0 4000 8000 12000 16000 1975 1980 1985 1990 1995 2000 2005 2010 2015 N b p igs (t hou sand heads) Year
4
Figure 1.3 Estimation of the global phosphorus production (adapted from Cordell et al.,
2009)
Current phosphate world demand is about 164 million tonnes, where 90% is destined for the food industry, from which 82% is used as agricultural fertilizer, 7-11% as additives in animal feeds, and 2-3% as additives for human food (Rosmarin, 2004). The remaining demand is used to make detergents, metal treatment or other industrial application such as bio-fuels and bioenergy (Johnston and Steen, 2000; Prud’Homme, 2010; SCU, 2013). The insufficient phosphate production capacity of mines has involved an increase of its price (>700%) especially in 2008 (Figure 1.4; EFMA, 2000; von Horn and Sartorius, 2009), becoming the third most expensive feedstuff ingredient after protein and energy (DeLuca and Baker, 1999; Augspurger et al., 2007). 0 5 10 15 20 25 30 1900 1920 1940 1960 1980 2000 2020 2040 2060 2080 2100 P prod uc ti on (MT ons P / y ea r) Year
5
Figure 1.4 Time-line evolution of rock phosphate price worldwide (source: indexmundi.com)
Moreover, the quality of phosphate reserves is declining and the cost of extraction, processing and shipping is increasing (Cordell et al., 2009). Given the expected rarity of phosphate and the strong P utilization principally by the agri-food industry , the present demand is expected to increase by 50% to 100% between now and 2050 (Smil, 2000).
For these reasons, several legislations that limit manure land application have been introduced to protect the environment. Therefore, reducing dietary P supply and therefore P excretion, is one of the goals to achieve in pig production. This reduction without impacting pig performance implies accurate estimation of the content values (total and digestible) of feedstuffs and the correct establishment of pig P requirements (Pomar et al., 2009). A large research effort (e.g. NRC, 2012) has been made to precisely determine the nutrient composition of the ingredients, as well as the digestive and metabolic fate of these nutrients (Noblet and Perez, 1993).
In practical conditions, to supply exogenous phytase enzyme in pigs’ diet has become the most common solution to increase dietary P utilization (Selle and Ravindran, 2008). The addition of ingredients with low phytic P content (such genetic modified cereals) or ingredients with high digestible P (such as DDGS) are other possible solutions to reduce P excretion (Hill et al., 2009; Rojas et al., 2013). The metabolic conditioning of pigs to improve their P utilization can be a complementary strategy. Animals can improve the digestive and metabolic utilization of some nutrients after feed shortages, which deprivation is a physiological regulator of the
0 50 100 150 200 250 300 350 1986 1990 1994 1998 2002 2006 2010 2014 US dol lar s/t on Year
6
intestinal uptake in several species. Indeed, the effect of dietary Ca restriction (i.e. depletion) followed by a non-deficient diet (i.e., repletion) on bone metabolism were previously investigated in weaning rats and humans where dietary Ca depletion led to hypocalcemia resulting in the activation of regulatory mechanisms that increased Ca utilization efficiency (Tanimoto et al., 1991; Åkesson et al., 1998). A dietary P depletion also led to hypophosphatemia that improved dietary P utilization efficiency in ruminants and non-ruminants animals by intrinsic adaptations that improved digestive and metabolic P utilization (Breves and Schröder, 1991). Similar results were found when concomitant deficiencies in both dietary Ca and P were given to growing pigs which might be maintained when a repletion diet is given thereafter (Ryan et al., 2011; Varley et al., 2011; Létourneau-Montminy et al., 2014).
However, the consequences of the depletion-repletion strategy in P and Ca in terms of animal performance and bone mineralization need to be better defined because depends on several factors such as the timing, degree and length of deficiency, the bone studied, or the age and genetic of pigs. This elucidation would maximize dietary P utilization efficiency and then reduce dietary P supply and excretion with no concerns in pig growth performance and mineralization.
7
CHAPTER II
2. Literature Review
8
2.1 Minerals in the body
2.1.1 General description
Minerals are chemical elements that are essential to life and play an important role in regulating various metabolic functions. These inorganic nutrients cannot be synthesized by chemical reactions in the body and must be added to livestock feed. Minerals are classified as major elements (macrominerals) or trace elements (microminerals) based on the amount that is needed in the body or in feed. Macrominerals must be added to feed in amounts greater than 100 ppm and include the following: calcium (Ca), chlorine (Cl), magnesium (Mg), phosphorus (P), potassium (K), sodium (Na) and sulphur (S). Microminerals or trace elements include chrome (Cr), cobalt (Co), copper (Cu), iron (Fe), iodine (I), manganese (Mn), selenium (Se) and zinc (Zn). Other minerals such as arsenic (As), boron (B), pewter (Sn), fluorine (F), lithium (Li), molybdenum (Mo), nickel, (Ni), lead (Pb), silicon (Si) and vanadium (V) are also considered microminerals. The body requires trace elements in very small amounts, which have not yet been determined precisely, and can even be dangerous and occasionally lethal for animals if present in excessive amounts (Nielsen, 1984; Underwood and Mertz, 1987).
Minerals play a variety of roles, with the main ones being structural (bones, muscles, cell membranes), physiological (acid-base equilibrium, osmotic pressure, membrane permeability, transmission of nerve impulses), catalytic (energy production), protective (oxidant or antioxidant) and regulatory (cell division and differentiation) (Suttle, 2010).
2.1.1.1 Calcium
Calcium (Ca) is the most abundant mineral in the body, with 96–99% of it being stored in bone tissue. The rest is found in intracellular compartments (1-4%) and extracellular fluids or plasma (~0.1%; Crenshaw, 2001; Suttle, 2010). The intracellular Ca concentration is around 10-7 M and is found mainly (90–99%) in the mitochondria and the endoplasmic reticulum in ionized free form (Ca2+), which is the biologically active form (Breves et al., 2010). The extracellular Ca concentration is considered to be fixed (2.1–2.5 mmol/L) and about 50% is in the form Ca2+, 45% is bound to proteins such as albumin and globulins, and the rest is complexed with inorganic anions such as phosphates, citrates and bicarbonates (Favus and Goltzman, 2008; Houillier, 2011; Blaine et al., 2015).
Calcium’s main function in the body is related with bone formation and resorption. However, free Ca is also involved in the permeability of cell membranes, muscle contraction,
9
nerve conduction, cellular signalling, blood coagulation, blood pressure maintenance, enzyme activation, and it can also bind to certain proteins to trigger an immune response (Kumar, 1995; Schröder and Breves, 2006).
2.1.1.2 Phosphorus
Phosphorus (P), the second most abundant mineral in the body, is found primarily (60– 85%) in bone tissue, the rest being divided between the intracellular (14–24%) and extracellular (1%) fluids. Intracellular P is mainly stored in soft tissues principally in organic form (~70%), that is, as phosphoproteins, phospholipids and nucleic acids, which play vital roles in biological processes such as energy production and serve as molecular buffers in body fluids (Nielsen, 1984; Schröder et al., 1996a). Additionally, the amount of P in soft tissues is fixed and has priority over P deposition in bones (Bansal, 1990; Moe, 2008). On the other side, the P present in the extracellular space is mainly in in the inorganic form (concentration of 3–4.5 mg/dL), as dihydrogen phosphate (HPO4-2) and monohydrogen phosphate (H2PO4-) in a 4:1 ratio, or as phosphate (PO4-3). About 60% of the absorbed P is free ionized ; the remaining 40% is bound to plasma cations, particularly Ca2+, Mg2+ and Na+, forming more complex structures (Fuchs and Peterlik, 1980; Blaine et al., 2015).
Similar to Ca, P plays a primary role in bone formation and resorption. It is also involved in cell differentiation and growth as a component of ribonucleic and deoxyribonucleic acid (RNA and DNA, respectively), cell membrane fluidity and integrity (lipid bilayer), myelinization (in the form of phospholipids), osmotic equilibrium and acid-base equilibrium (Prasad and Bhadauria, 2013). It also serves as an intracellular and urine buffer in energy metabolism (e.g. AMP, ADP, ATP) to promote gluconeogenesis, fatty acid transport, synthesis of amino acids and proteins as well as the activity of the sodium–potassium pump, which transport sodium and potassium ions across the cell membrane (Suttle, 2010).
10
2.2 Calcium and phosphorus metabolism
2.2.1 Fluxes of calcium and phosphorus
The extracellular concentration of Ca and P depends on the balance between intestinal absorption, renal reabsorption and bone formation, modelling and remodelling (Nordin, 1990; Marks et al., 2010; Bushinsky, 2010).
2.2.1.1 Intestinal metabolism a) Calcium
The principal site of Ca2+ absorption (> 90%) takes place in the small intestine, particularly in jejunum and ileum compared to the large intestine where absorption is much less pronounced or even null (Partridge, 1978; Schröder et al., 1996a; González-Vega et al., 2014). This intestinal Ca absorption involves two different pathways: the paracellular (between the cells) which occurs mainly in the distal portion (ileum) and the transcellular (through the cells) which principally occurs in the proximal portion (duodenum and jejunum; Pansu et al., 1983; Bronner, 1998). Paracellular absorption is a passive nonsaturable process by which Ca moves from the intestinal lumen into the blood through the tight junctions of the enterocytes, where the Ca concentration is lower than in the intestinal lumen (Figure 2.1; Blaine et al., 2015).
Figure 2.1 Model of mechanisms of calcium transport in intestinal epithelium (Adapted from
11
The rate of paracellular absorption is thought to be constant and independent of dietary Ca intake (Kopic and Geibel, 2013). Transcellular absorption is an active and saturable process which begins with the Ca2+ transport across the microvilli of the apical membrane of the enterocyte by a passive diffusion, and involves two Ca absorption channels: transient receptor potential-vanilloid channel 5 and 6 (TRPV5 and TRPV6, respectively; van Abel et al., 2003; Breves et al., 2010; Diaz de Barboza et al., 2015). In swine, TRPV5 appears to play a less important role than TRPV6 in transcellular absorption (Hinterding et al., 2002; Brandenburger, 2004).Inside the enterocytes, the Ca2+ binds to the calmodulin-actin-myosin I protein complex and is transported through the cytosol. As the calmodulin complex becomes saturated with Ca cations, the concentration gradient decreases, slowing down the rate of Ca absorption (Blaine et al., 2015). That is why the epithelial cells synthesize calbindin-D9k (encoded by S100G), a calcium-binding protein with a molecular weight of 9 kDa that facilitates the active transport of Ca from the apical to the basolateral membrane of the enterocyte (Schröder et al., 1996b; Kopic and Geibel, 2013).
In the basolateral membrane, the Ca-calbindin complex dissociates and the free Ca2+ is actively extruded into the blood by plasma membrane Ca ATPase (PMCA) proteins and the Na+-Ca2+ exchanger (NCX; Schröder and Breves, 2006; Cui et al., 2012; Hong and Jeung, 2013). PMCA is a ubiquitous protein responsible for the energy-dependent Ca pump; it has phosphatase activity and maintains Ca homeostasis by regulating the transport of Ca between the cytosol and the blood (Mazzitelli et al., 2010). From its four isoforms (1-4), PMCA1b is the principal one in Ca absorption, which is predominant in the duodenum and is regulated by calmodulin, a protein that can increase the affinity of the pump for Ca transport and its turnover rate (Mazzitelli and Adamo, 2007; Di Leva et al., 2008; Kopic and Geibel, 2013). The other protein responsible for Ca transport (NCX) has three isoforms (1-3), with NCX1 (encoded by SLC8A1) being predominant in the small intestine. Because of the strong electrochemical gradient between the enterocyte and the blood, NCX1 needs the energy stored in the Na+ exchanger to transport Ca2+ across the basolateral membrane and follows the extrusion stoichiometry of 3:1 Na+-Ca2+ (i.e. three sodium ions enter into the cytosol for each ion Ca that is removed). In swine, NCX plays a lesser role than PMCA in intestinal absorption and a more important role in the kidneys (Kaune, 1996; Hoenderop et al., 2000; Suzuki et al., 2008).
12
Under normal blood Ca concentration, about 43% of ingested Ca is absorbed, from which more than 75% follows the paracellular route (Besançon and Guéguen, 1969). When a deficiency exists, percent absorption of Ca by the transcellular pathway increases in proportion to the intensity of the deficiency, whereas if the Ca concentration is too high, transport by both routes is reduced in order to decrease Ca absorption (Christakos et al., 2011).
b) Phosphorus
The main site of P absorption is the jejunum, followed by the duodenum, the ileum and the large intestine, where absorption is much lower or almost negligible (Partridge, 1978; Marks et al., 2010; Prasad and Bhadauria, 2013). Phosphorus is absorbed in free monovalent or divalent organic form (H2PO4- or HPO42-, respectively) from dietary sources or from organic components (phospholipids, phosphoproteins, nucleic acids) that have been hydrolyzed by phytases or intestinal alkaline phosphatases. As in the case of Ca, absorption occurs by the paracellular pathway, which is passive and dependent on a favourable concentration gradient, or by the transcellular active route. Paracellular diffusion is a less important mode of transport than the transcellular one because of the negative charge of the phosphate anions which reduces the permeability of the intestinal membrane (Breves and Schröder, 1991; Barlet et al., 1995). The transcellular transport of P anions involves translocation through the interior of the enterocyte. Entry begins when P binds to the Na+ in the intestinal lumen resulting in facilitated transport, since the cytosol has a concentration gradient ten times lower than that of the intestinal lumen (Cross et al., 1990; Schröder et al., 1996a). This entry is regulated by the activity of the protein sodium-dependent phosphate (Na-Pi) cotransporter type II (SLC34) and type III (SLC20) (Saddoris et al., 2010; Sabbagh et al., 2011; Zhifeng et al., 2012). In the type II transporter family, Npt2b (encoded by SLC34a2) is the main cotransporter of phosphate anions, which are transported in divalent form. Transport is electrogenic (depends on the Na+ potential of the membrane) and has a stoichiometry of 3:1 Na+:HPO4-2 (Forster et al., 2006b; Marks et al., 2010; Blaine et al., 2015). The main type-III Na-Pi transporters (SLC20) are Pit1 and Pit2 (encoded by SLC20a1 and SLC20a2, respectively). They play a less important role in intestinal absorption of P (~5%) and transport P in monovalent form. This transport is likewise electrogenic and has a stoichiometry of 2:1 Na+:HPO42- (Villa-Bellosta et al., 2009; Forster et al., 2013). Within the enterocyte, the gradient is regulated by the ATP-dependent sodium-potassium pump (Na+-K+-ATPase) present in the basolateral membrane. The extrusion of P
13
from the enterocyte into the blood appears to occur by both passive and active diffusion, but is regulated by an as-yet undiscovered transporter (Schröder et al., 1996a; Breves et al., 2007).
Under normal serum P levels, about 45% of the ingested P is absorbed, but the partitioning between the paracellular and transcellular routes has not been fully determined (Dilger and Adeola, 2006). When the P level is too low, absorption appears to occur mainly by the transcellular pathway, and when it is high, transport by both routes decreases, which reduces its absorption (Breves and Schröder, 1991; Saddoris et al., 2010). In addition, intestinal absorption of P does not depend on absorption intensity or on the affinity of cotransporters for P, but rather on the abundance of transporters (Crenshaw, 2001; Blaine et al., 2015).
2.2.1.2 Renal metabolism a) Calcium
Renal filtered Ca2+ is excreted in the urine or reabsorbed by the enterocytes and extruded back into the blood by the paracellular (passive) or transcellular (active) pathway. In the kidney, the absorption occurs in the nephron, which is composed by four different segments: the proximal convoluted tubule, the loop of Henle, the distal convoluted tubule and the collecting duct (Mensenkamp et al., 2006; Blaine et al., 2015). The majority of Ca reabsorption in the kidneys (60–70%) takes place in the proximal convoluted tubule, primarily by passive diffusion (80–90%; Moe, 2008). The second most important site of Ca reabsorption is the loop of Henle, which has a thin limb with no activity and two thick limbs, one ascending and one descending. The thick ascending limb plays an appreciable role in absorption, in which 20% of the filtered Ca is reabsorbed, mainly by the paracellular route. The third most important segment is the distal convoluted tubule, where 5–10% of Ca reabsorption takes place. In this tubule, reabsorption is exclusively transcellular and it is regulated by the TRPV5 protein of the apical membrane (Hoenderop et al., 2000; van Abel et al., 2005; Diaz de Barboza et al., 2015). The fourth and final site of Ca reabsorption is the connecting duct, where 3–10% of the filtered Ca is reabsorbed through the transcellular mechanism, and is the main regulator of Ca excretion (Blaine et al., 2015). After it enters the enterocyte, the free Ca2+ binds to the calbindin-D28k transporter (encoded by CALB1) and diffuses through the cytosol (Hoenderop et al., 2001; Kopic and Geibel, 2013). Calbindin-D9k (S100G) may also be present in the cytosol as a Ca transporter. As in the intestine, the Ca dissociates from the CALB1 in the enterocyte basolateral membrane and is evacuated into the blood by the NCX1 exchanger (encoded by SLC8A1) and Ca2+–ATPase PMCA1b (Schröder and Breves, 2006; Vesey, 2010).
14
As in the intestine, the percent reabsorption of Ca depends on the region of the kidney where reabsorption occurs (proximal or distal) as well as on the extracellular Ca concentration. Under normal blood Ca conditions, about 97–99% of the filtered Ca2+ is reabsorbed and the rest is excreted in the urine. When the Ca concentration is low, the filtered load decreases to reduce Ca excretion and reabsorption in the distal convoluted tubule increases; however, a high concentration will inhibit reabsorption in the distal convoluted tubule, and increase Ca excretion (Mensenkamp et al., 2006; Blaine et al., 2015).
b) Phosphorus
The kidneys are the principal regulators of P homeostasis, where, and similar to Ca, regulates its excretion or reabsorption depending on the animal’s blood P levels (Favus et al., 2006; Nadkarni and Uribarri, 2014). This reabsorption takes place through the simultaneous passive paracellular and the active transcellular pathway in the proximal convoluted tubule (80-85%), the loop of Henle (10%), the distal convoluted tubule (3-5%), and the collecting duct (>2%) of the nephron (Marks et al., 2010; Blaine et al., 2015). Most of the absorption regulators of the proximal segment of the nephron have been identified, however, those involved in the absorption of the distal segment, as well as the paracellular absorption pathway, are not well known (Blaine et al., 2011; Prasad and Bhadauria, 2013). The main regulators of transcellular P reabsorption in the proximal part are the type II Na-Pi cotransporters, Npt2a and Npt2c (encoded by SLC34A1 and SLC34A3, respectively), which transport P primarily in the divalent form HPO4-2 (Kido et al., 2013). These cotransporters use the energy derived from the transport of Na+ to move P from the lumen into the cell by the active mechanism (Tenenhouse, 2005; Segawa et al., 2007a). Npt2a is electrogenic and has a stoichiometry of 3:1 Na+:HPO4-2 (Sabbagh et al., 2011; Forster et al., 2013). Npt2c is electroneutral and has a stoichiometric ratio of 2:1. Additionally, Npt2c has one hundredth the capacity of Npt2a to transport P into enterocytes, and it needs one tenth the energy, which explains its different stoichiometric ratio (Wagner et al., 2014). Another type III cotransporter involved in renal reabsorption of P is PiT-2 (encoded by SLCPiT-20APiT-2), which is electrogenic, generally transports P in monovalent form and its stoichiometric ratio is 2:1 (Virkki et al., 2007; Collins et al., 2004). Other renal cotransporters include type II Npt2b, encoded by SLC34A2, and type I Npt1, encoded by SLC17A1, but their functional characteristics show an almost negligible action in renal P transport (Prie et al., 2009; Zhifeng et al., 2012). Inside the enterocytes, the difference in charge is compensated by the Na+-K+-ATPase pump, and the ions migrate to the basolateral
15
membrane to be extruded from the cytosol to the blood by an unknown transporter (Forster et al., 2006a; Prasad and Bhadauria, 2013).
When the blood phosphate level is normal, 75–85% of filtered P is reabsorbed and, as in the intestine, this percent reabsorption depends on the abundance of Na-Pi cotransporters and not on their efficiency. Since reabsorption varies with the dietary intake of P or the animal’s needs, a reduction in the P concentration leads to an increase in transporter abundance, thereby increasing P reabsorption and, conversely, an increase in the P concentration reduces the abundance of transporters and increases phosphaturia (Favus et al., 2006; Marks et al., 2010).
2.2.1.3 Bone metabolism
a) Bone composition and structure
The human skeleton consists of about 200 bones which are dynamic, resistant and elastic tissues that provide structural support and protection of organs, and assist in maintaining P and Ca homeostasis and the acid-base balance in keeping with the body’s physiological needs. Bone is composed of an inorganic matrix (50–70%), an organic matrix (20–40%), water (5–10%) and fat (3%) (Bonucci, 1999; Clarke, 2008). The inorganic matrix of bone consists mainly of P and Ca in the form of calcium-deficient crystals of hydroxyapatite [Ca10(PO4)6], along with calcium carbonate, calcium phosphate and small amounts of Na, Mg, Cl and F. The P and Ca are deposited in bone in an interdependent manner whereby neither mineral can accumulate without the other mineral being present. The hydroxyapatite crystals serve mechanical functions in bones and store P and Ca homeostasis for different metabolic functions (Moe, 2008; Favus and Goltzman, 2008). The organic matrix consists mainly (90%) of protein collagen fibres type I organized in a helix, non-collagen proteins (< 3%), such as osteocalcin, osteonectin, thrombospondin, fibronectin, vitronectin and osteopontin, as well as proteoglycans (5%), lipids (2%), growth factors and cytokines (< 1%; Young, 2003; Boskey, 2013). The inner bone marrow is composed of conjunctive tissue, constitutes the principal site for hematopoiesis (the formation and distribution of blood cells) and it produces lymphocytes which support the immune system. Both the matrix and the marrow contain mesenchymal stem cells,which can differentiate into osteoblasts and osteoclasts, responsibles of the bone formation and resorption, respectively (Bruder et al., 1994; Long et al., 1995; Noda, 2014).
All the bones in the skeleton have a similar chemical composition, but they differ in their density, which allows bones to be divided into two morphological types: compact (cortical) and spongy (trabecular) (Tassani et al., 2011). Cortical tissue is solid and dense, plays
16
the main supporting role in bone, and it forms a layer that encases the trabecular tissue. This second tissue is spongy and less solid than cortical, and is mainly present at the ends of bones and in contact with the marrow (Gurevitch et al., 2007; Sims and Martin, 2014). Additionally, the trabecular tissue has four times higher surface area to volume ratio (Oftadeh et al., 2015), giving it a metabolic rate ten times greater than that of the cortical tissue. Overall, the skeleton is composed of ~80% cortical bone and ~20% trabecular bone, but these percentages may vary with the type of bone considered. For example, the ratio is 50:50 for the femur and 25:75 for the vertebrae (Clarke, 2008; Kini and Nandeesh, 2012).
From a histological perspective, bone consists of two main types of tissue. Primary bone tissue, also known as woven (non-lamellar) or immature bone, is characterized by coarse collagen fibres which make it mechanically weak. This bone tissue is present from the fetal period to puberty. Secondary bone tissue (lamellar bone) is known as mature bone, and it is characterized by the presence of collagen fibers arranged in parallel layers or sheets (lamellae), making it more resistant than primary bone (Nather, 2005).
The skeleton has five types of bone which are classified according to their size and shape as long, short, flat, irregular and sesamoid. Long bones are longer than they are wide (e.g. femur, tibia, metacarpals); short bones have a similar length and width (e.g. carpal and tarsal bones); flat bones include, for example, the scapulae and the sternum. The skull, the pelvis and the ribs are other examples of flat bones which function is to protect vital organs. The vertebrae, mandible and sacrum are some examples of irregular bones. Sesamoid bones are short or irregular bones that are protected by a tendon (e.g. kneecap , pisiform; Hall, 2005; Clarke, 2008).
b) Bone modelling and remodelling
Bone is constantly being adapted through modelling and remodelling processes. Modelling, the first stage in bone formation, determines the size and shape of the bone and the marrow (Sims and Martin, 2014). Remodelling (bone renewal) is the process by which old bone tissue is destroyed and replaced with new tissue. It involves a simultaneous process of bone formation and resorption, in which hydroxyapatite crystals are deposited and reabsorbed through the joint action of two types of cells: osteoblasts and osetoclasts (Raggatt and Partridge, 2010). Osteoblasts are the cells that build bone tissue, which includes synthesis and mineralization of the matrix and marrow (Kini and Nandeesh, 2012). Mature osteoblasts become osteocytes, the most common cell type in bone; their function is to maintain both the
17
matrix and marrow, as well as participate in the exchange of nutrients between the blood and the bone (Bandyopadhyay-Ghosh, 2008). Osteoclasts are the cells that resorb bone tissue through the process of osteolysis, which breaks down the matrix and the marrow. Blood inorganic P and Ca ions are bound forming mainly hydroxyapatite crystals and deposited in the bone by the osteoblasts or are broken down into their inorganic form and returned to the extracellular fluid by the osteoclasts (Favus et al., 2006). The body uses the P and Ca that is present in blood (1% of total) to respond to minor, short-term changes in serum Ca and P levels. However, when major changes requiring long-term adjustment occur, P and Ca stored in bones are used to restore P and Ca homeostasis.
2.2.2 Calcium and phosphorus homeostasis
The extracellular homeostasis of P and Ca is regulated by the concerted action of the intestine, the kidneys and the bones in conjunction with certain calciotropic hormones, such as the parathyroid hormone (PTH), calcitriol and calcitonin (Bronner, 1998; Suzuki et al., 2008; Cui et al., 2012). Moreover, Binkley and Suttie (1995) showed possible regulation of bone mineralization by the action of vitamin K, which prevents mineral deposition in soft tissues and modulates bone mineralization through post-translational carboxylation of specific bone proteins (Crenshaw, 2001).
2.2.2.1 Parathyroid hormone
Parathyroid hormone or parathormone (PTH) is synthesized in the parathyroid glands; it lasts 20 to 30 minutes on average and is the main regulator of Ca homeostasis (Moe, 2008; Blaine et al., 2015). PTH synthesis is regulated primarily by the plasma concentration of Ca2+ through a negative feedback loop, that is, the secretion of PTH is inversely proportional to the serum Ca level. The Ca concentration is detected by the calcium-sensing receptor (CaSR) present in the parathyroid glands and the kidneys (Houillier, 2013). Thus, a decrease in the serum Ca level (hypocalcemia) leads to an increase in the synthesis and secretion of PTH, whereas an increase in the serum Ca level (hypercalcemia) leads to a decrease in PTH secretion. The body’s self-regulating mechanism ensures that once the calcemia is restored to the normal range, PTH synthesis is reduced to avoid an excess. Even if normo-calcemia is achieved, it will not completely inhibit synthesis of PTH (Gamba and Friedman, 2009). Following synthesis, the hormone binds to the PTH receptors and is transported within the body or stored in the secretory granules of the Golgi apparatus.
18
The main action of PTH consists in increasing the plasma concentration of Ca (hypercalcemic effect) and decreasing the plasma concentration of P (hypophosphatemic effect) by a direct route (i.e. kidneys, bones) or an indirect (i.e. intestine) route. In the kidneys, PTH increases the reabsorption of Ca and decreases therefore the excretion of Ca in urine (calciuria). It has the opposite effect on P: it increases urinary P (phosphaturia) through the reduction of P reabsorption by decreasing the expression of the Na-Pi transporters (Breves et al., 2010). Its effect on bone consists in increasing the activity and number of osteoclasts, thereby increasing bone resorption. PTH regulates as well certain osteoblast genes that are responsible for the production of proteins forming the bone matrix, such as osteocalcin or osteopontin. PTH also participates indirectly in intestinal P and Ca absorption by the renal synthesis of calcitriol, which increases intestinal absorption of P and Ca (Schröder and Breves, 2006). Nemere and Szego (1981) proposed that PTH plays a direct role in intestinal regulation, through an increase in intestinal absorption of Ca in the presence of PTH. In fact, Picotto, 2001 concluded that PTH may compensate intestinal Ca absorption when an impaired regulation occurs, but this possible process remains to be elucidated.
2.2.2.2 Calcitriol
This hormone, also known as 1,25(OH)2D3, is the active form of vitamin D and plays an important role in P and Ca homeostasis (Hoenderop et al., 2001; Diaz de Barboza et al., 2015). Calcitriol and its metabolites are considered to be hormones and hormonal precursors, because, under the right biological conditions, they can be synthesized endogenously. This hormone is synthesized from vitamin D3 (cholecalciferol) obtained from foods of animal origin or synthesized through two pathways: from vitamin D2 (ergocalciferol) obtained from plant-based foods or by conversion of the precursor 7-deshydrocholesterol in the skin during exposure to UV radiation. Synthesized cholecalciferol is transported by alpha globulin proteins synthesized in the liver where it undergoes an initial hydroxylation by the enzyme 25-hydroxylase to become 25(OH)D3, or calcidiol (Moe, 2008; Vieth and Sidhom, 2010). About 88% of this metabolite circulates bound to transporter proteins, 11% bound to albumin, and the remaining (< 1%) occurs in free form (Speeckaert et al., 2006). Calcidiolundergoes another hydroxylation in the kidney by 25-hydroxyvitamine D3 1α hydroxylase (25(OH)D-1α encoded by CYP27B1, which yields two mature metabolites: 24,25(OH)2D3 and 1,25(OH)2D3 (Sooy et al., 2000). This conversion of calcidiol into calcitriol is regulated by PTH. After it is synthesized, calcitriol binds to the transporter proteins and enters cells, where the vitamin D
19
receptor (VDR) regulates the biological activity of the active hormone. When the serum Ca or P level is within the normal range, most of the calcitriol is converted into inactive components in the kidneys such as derivatives of 24,25(OH)2 or 1,24,25(OH)3, otherwise it will accumulate in the adipose tissue and the liver before it is used by the body (Figure 2.2).
Figure 2.2 Metabolism of vitamin D (from Henry and Norman, 1984)
Calcitriol is synthesized in response to a decrease of calcemia or phosphatemia, in order to increase the plasma concentrations of Ca and P (hypercalcemic effect and hyperphosphatemic effect, respectively). A lower calcemia increases PTH concentration which induces the synthesis of calcitriol thereafter, however a lower posphatemia synthetizes calcitriol independently from PTH (Sommerville et al., 1985; Eklou-Kalonji et al., 1999). In the intestine, calcitriol increases the active transcellular absorption of Ca2+ by stimulating TRPV6, CALB1 and PMCA and, to a lesser extent, the absorption of P. A similar effect occurs in the kidneys, through an increase in active reabsorption of Ca due to overexpression of the proteins TRPV5, S100G and SLC8A1 (Schröder et al., 1998; Hadjidakis and Androulakis, 2006; Kopic and Geibel, 2013). Calcitriol also has antiproliferative effects in the parathyroid cells and inhibits PTH synthesis through a feedback loop with the endocrine system, which reduces phosphaturia (Kato, 2000; Moe, 2008). In the bones, calcitriol has the same function as PTH: it increases the activity of the osteoclasts and then bone resorption, which increases the extracellular concentration of P and Ca.