SCOPING EXERCISE AND LITTERATURE SEARCH ON
THE RELEVANCE AND PRACTICALITY OF USING
ORGANIC FARMING PRACTICES AS
AN ALTERNATIVE LAND MANAGEMENT PRACTICE ON
AGRICULTURAL LANDS TO
GUIDE FUTURE WORK ON
ACHIEVABLE PERFORMANCE STANDARDS (APSs)
Rapport de recherche pour Environnement Canada
Équipe de réalisation: Alain N. Rousseau, Ph.D., ing.
Martin-Pierre Lavigne, M.Sc. Pierre Lafrance, D. d’État ès Sci. Phys.
Centre Eau Terre Environnement
Institut national de la recherche scientifique (INRS-ETE) 490, rue de la Couronne, Québec (QC), G1K 9A9
Rapport N° R-1014
© Alain N. Rousseau, 2009
Dépôt légal Bibliothèque nationale du Québec Dépôt légal Bibliothèque nationale du Canada
TABLE OF CONTENT
LIST OF FIGURES ... v
LIST OF TABLES ... vii
1 INTRODUCTION ... 1
2 HISTORICAL REVIEW, DEFINITION, AND STANDARDS OF ORGANIC FARMING... 5
2.1 HISTORICAL REVIEW ... 5
2.2 DEFINITION ... 6
2.3 STANDARDS ... 9
2.3.1 Organic Standards around the world... 9
2.3.2 Organic Standards in Canada ... 11
3. MAJOR CROPS IN CANADA GROWN WITHIN AN ORGANIC FARMING SYSTEM ... 15
3.1 STATISTICS ... 15
3.2 DESCRIPTION OF THE MAJOR ORGANIC FARMING SYSTEMS (FIELD CROPS) ... 18
4 APS MODEL REQUIREMENTS ... 21
4.1 Hydrological model ... 22
4.2 Erosion model ... 23
4.3 Land pesticide transport model ... 24
4.4 Land nutrient transport model ... 25
4.5 Water quality model ... 26
5 ENVIRONMENTAL IMPACT OF ORGANIC FARMING ... 29
5.1 Reduction of erosion ... 29
5.2 Reduced use of synthetic chemicals ... 30
5.3 Soil physical, biological and chemical properties ... 30
5.4 Nutrient leaching ... 33
5.5 Summary ... 35
6 LITTERATURE SEARCH ON ORGANIC FARMING MODELLING WITH REGARDS TO APS ... 37
6.1 USLE (Auerswald et al., 2003) ... 39
6.2 MANMOD and MANNER models ... 42
6.3 ROTOR model (Bachinger and Zander, 2007) ... 43
6.4 HANSEN et al. (2000) equation ... 44
6.5 DAISY model (Hansen et al., 1991) ... 45
6.7 FASSET model (Berntsen et al., 2006)... 50
6.8 FARMFLOW model (Modin-Edman et al., 2007) ... 51
6.9 Summary ... 51
7 MODELLING THE ORGANIC FARMING SYSTEM WITH GIBSI ... 53
7.1 Modelling soil erosion ... 53
7.2 Modelling pesticide use ... 54
7.3 Modelling nutrient balance and transport ... 54
7.3.1 Nutrient import by organic or green manure ... 55
7.3.2 Crop rotation, green manure and catch crop ... 57
7.3.3 Crop and nutrient yields ... 57
8 CONCLUSION ... 59
REFERENCES ... 61
APPENDIX A Example of organic farms crop rotations from the Organic Field Crop Handbook (Wallace, 2001) and the Fédération d’Agriculture Biologique du Québec (2006) ... 71
APPENDIX B Equations and parameters from Chambers et al. (1999) ... 75
APPENDIX C Equation of the ROTOR model from Bachinger and Zander (2007) .... 81
APPENDIX D Crop yield values, N balance and modelled N leaching for organic and conventional farms in Denmark from Hansen et al. (2000) ... 89
APPENDIX E Illustration of the soil organic matter submodel and functions for the adjustment of parameters of DAISY from Hansen et al. (1991) ... 91
APPENDIX F Parameters and results from Knudsen et al. (2006)... 93
APPENDIX G Description of FARMFLOW, parameters, and results from Modin-Edman et al. (2007) ... 97
APPENDIX H Nutrient value of some permitted fertility and soil amendments from the Organic Field Crop Handbook (Wallace, 2001) ... 101
APPENDIX I Nutrient content and C: N ratio of compost and fresh manure from the Organic Field Crop Handbook (Wallace, 2001) ... 103
APPENDIX J Characteristics of different cover crops and nitrogen content of some green manure from the Organic Field Crop Handbook (Wallace, 2001) ... 105
LIST OF FIGURES
Figure 3-1 Certified, transitional, and uncertified organic farms in Canada, 2006 (Statistic Canada, 2009 - Census of Agriculture, 2006) ... 16 Figure 3-2 Certified, transitional, and uncertified organic farms by provinces in
Canada, 2006 (Statistic Canada 2009 - Census of Agriculture, 2006) ... 17 Figure 4-1 Illustration of data needed by the models in GIBSI, and the level at
which those are influenced by organic farming practices for APS
determination ... 22 Figure 4-2 GIBSI soil phosphorus pools and processes that move P in and out of
pools ... 25 Figure 4-3 GIBSI soil nitrogen pools and processes that move N in and out of
pools ... 26 Figure 5-1 Representation of nurient flows that may occur on an organic farm
LIST OF TABLES
Table 3-1 Farms producing organic products, by certification status, Canada, 2006 (source: Statistics Canada, 2009 - Census of Agriculture 2006) ... 15 Table 6-1 Input data for the NDICEA model ... 50
1 INTRODUCTION
At the end of 2007, 32.2 millions hectares of land, representing about 0.73% of the agricultural land of the surveyed countries, were managed according to organic standards around the world (IFOAM, 2009). The global market for organic products then reached a value of over 46 billion US Dollars, with the vast majority of produce being consumed in North America and Europe (IFOAM, 2009).
Although many cultures traditionally practiced a form of agriculture that can be considered organic with regards to actual standards, the organic movement, as it is known today, began with the 20th century as a reaction toward new technologies and new farming practices that led to the Green Revolution. The widespread use of gasoline-powered tractors, of synthetic fertilizers, of hybrid seeds issued from development in plant breading, of chemical pesticides following World War II, of large scale irrigation, and, more recently, of Genetically Modified Organisms (GMOs), all contributed to transform traditional farming practices in order to feed an ever increasing population. To optimise the use of machinery, cropland expanded and crops became more specialized in order to use machinery more efficiently. Traditional seedlings were replaced by more productive hybrid varieties, and ancient practices to maintain soil health were replaced by massive use of artificial fertilizers. As a consequence, total field yield increased, but crops became more vulnerable to pest and disease. Pesticides and genetic engineering became the solution to maintain high productivity. As population became more and more concern with the environmental impact of such practices, organic farming associations and institutions formed all around the world, and along came the certification process.
The International Federation of Organic Agriculture Movement (IFOAM) was founded in France, in 1972. Today the IFOAM unites 750 member organizations in 108 countries, and produces standards which have provided a model for numerous major laws and voluntary standards (IFOAM, 2009).
The increasing demand for organic products recently led to the development of legislation and standards by governments. Canada’s Organic Products Regulations (OPR) will be effective on June 30, 2009. The question has been raised on the relevance and practicability of using organic farming practices as an alternative land management practice on agricultural land to guide future work on achievable performance standards (APSs). In other words, how can organic farming affect water quality, and how that effect could be taken into account by the hydrological modelling framework developed by Rousseau et al. (2008) and used for APS determination.
This report is organized in eight chapters. Chapter 7 provides an answer to the aforemetioned question. A first look at data requirements to introduce organic farming practices as an alternative land management scenario within a hydrological modelling framework is introduced in Chapter 4, followed by a brief synthesis of the environmental impact associated with organic farming in Chapter 5. Chapter 6 presents a literature review to provide an overlook of at what has been done so far to model the impact of organic farming practices on surface water quality. But first, Chapter 2 introduces a brief historical review of the organic farming paradigm along with basic definitions and standards of organic farming from USA, Europe, Japan and Canada. This is followed by
an overview of the major crops grown in Canada within an organic farming system (Chapter 3).
2
HISTORICAL REVIEW, DEFINITION, AND
STANDARDS OF ORGANIC FARMING
2.1
HISTORICAL REVIEW
Sir Albert Howard (1873-1947) is considered by many to be the founder of the organic agriculture movement (Heckman, 2006). After a career spent in India in several agricultural research centres, he published books where he exposed his concept of soil fertility centered on building soil humus with an emphasis on a “living bridge” between soil life, such as mycorrhizae and bacteria, and how this chain of life from the soil supported the health of crops, livestock and mankind (Howard, 1972 in Heckman, 2006). Rudolf Steiner (1861-1929), an Austrian thinker, founded in 1924 biodynamic agriculture, a branch of organic farming. A central aspect of biodynamics is that the farm as a whole is seen as an organism, and therefore should be a closed, self-nourishing system. Disease of organisms is not to be tackled in isolation but is a symptom of problems in the whole organism. The term “organic farming” was first introduced in 1940 with the publication of Look to the Land by Lord Northbourne (1896-1982), from the conception of the farm as an organism. The book described a holistic, ecologically-balanced approach to farming.
The first, long-term scientific experiment to compare organic and non-organic farms was conducted in England from 1939 to 1969 by Lady Eve Balfour (1899-1990). Her observations were published in The Living Soil and the Haughley Experiment (1943, 1974). In 1946, she co-founded and became the first president of the Soil Association, an
international organization claiming to promote sustainable agriculture (and the main organic farming association in the UK today).
In 1942, Jerome Irving Rodale (1898-1971) contributed to spread the organic movement ideas in America with the publication of the magazine Organic Farming and Gardening (later Organic Gardening).
Thirty years later, in 1972, the IFOAM was founded in France. First active there, along with the German-speaking countries and an early participation in Canada, IFOAM activities soon widened, by the 80s, to encompass the US, African agents of organic agriculture, and a relationship was established with the Food and Agriculture Organization of the United Nations (FAO). The organisation is now active in 108 countries (IFOAM, 2009).
Certification by private associations began during the 1970s, and governments started to write organic production guidelines during the 1980s. Legislation of standards began in the 1990s. In 2007, more than 60 countries had legal framework for organic production (IFOAM, 2009).
2.2 DEFINITION
IFOAM has defined the four basic principles of the Organic Movement from which organic agriculture grows and develops. These principles express the contribution that
organic agriculture can make to the world and a vision to improve all agriculture in a global context. They guide IFOAM’s development of positions, programs and standards.
1. Principle of health
Organic Agriculture should sustain and enhance the health of soil, plant, animal, human and planet as one and indivisible.
2. Principle of ecology
Organic Agriculture should be based on living ecological systems and cycles, work with them, emulate them and help sustain them.
3. Principle of fairness
Organic Agriculture should build on relationships that ensure fairness with regard to the common environment and life opportunities
4. Principle of care
Organic Agriculture should be managed in a precautionary and responsible manner to protect the health and well-being of current and future generations and the environment.
Using these principles, IFOAM proposed a short definition of organic agriculture:
“Organic agriculture is a food production system that sustains the health of soils, ecosystems and people. It relies on ecological processes, biodiversity and cycles adapted
to local conditions, rather than the use of inputs with adverse effects. Organic agriculture combines tradition, innovation and science to benefit the shared environment and promote fair relationships and a good quality of life for all involved.”
(IFOAM, 2009)
The above definition, presented in December 2007, was meant to be short, to cover full diversity of organic agriculture in the world, and to be formulated in a positive way. It can be further refined by listing some agricultural practices that distinguish organic farming from conventional farming, including (Forges, 2004):
o a prohibition on chemical fertilizers and pesticides, plant and animal growth regulators, hormones, antibiotics, preservatives, etc.;
o a prohibition on GMOs;
o a prohibition on soil-less culture (which does not preclude greenhouse growing); o the requirement, in the case of animal production, to allow free-range practices, to
use organically produced feed, to limit animal density in building, etc.; and
o the requirement to observe conversion periods in crop production before any produce can be marketed as “organic”, etc.
In order to maintain soil productivity, and to control pest and disease without using chemicals, organic agriculture relies on crop rotation, green manure, compost, biological pest control and mechanical cultivation.
2.3 STANDARDS
To insure that a certain product is produced according to organic agriculture principles, it must be certified by a proper regulatory body. The certification is the guarantee that the product was obtained according to standards that insure the respect of the organic principles. However, the increasing number of certification bodies (395 organizations worldwide in 2007; IFOAM, 2009) and the proliferation of standards bring some confusion to consumers, and raise the issue of equivalences among the different certifications. In order to preserve the integrity of the “organic” label, and to facilitate organic product marketing between states, provinces, or countries, many governments (more than 60 countries in 2007; IFOAM, 2009) have adopted legislations that guarantee a “uniform minimum set of standards”. Base on these legislations, governments can give accreditations to the certification bodies whose standards meet, or are more restrictive, than government’s standards. A special seal, or logo, is used to insure that an organic product meets a government and/or certification body standards.
2.3.1 Organic Standards around the world
2.3.1.1 United States legislation
The Federal Organic Foods Production Act of 1990 establishes the national standards governing the marketing of organically produced products in the US. Initially, the proposed standards did not prohibit the use of sewage sludge, food irradiation and GMOs. That changed in October 2001 with the adoption of the National Organic Program (NOP) of the US Department of Agriculture (USDA). It is now under NOP that the USDA develops, implements, and administers national production, handling, and
labelling standards for organic agricultural products. Also, NOP accredits the certifying agents (foreign and domestic) who inspect organic production and handling operations to ensure that they meet USDA standards (USDA, 2009).
2.3.1.2 European Union legislation
The European Council of Agricultural Ministers adopted Regulation No. 2092/91 on organic farming and the corresponding labelling of agricultural products and foods in 1991. The introduction of this Regulation was part of the reform of the EU Common Agricultural Policy and represented the conclusion of a process through which organic agriculture received the official recognition of the 15 states which were EU members at the time. That regulation created common minimum standards for the entire EU, letting the member states and private organisations to enact their own additional stricter standards. Since then, a new Council Regulation (No. 834/2007) was adopted in 2007, replacing No. 2092/91. Two new Commission Regulations were also adopted in 2008 regulating organic production, import and distribution of organic products as well as their labelling. These new regulations went into effect on January 1, 2009, for the production, control and labelling of organic products. However, some of the new provisions on labelling will only take effect on July 1, 2010 (European Commission, 2009).
2.3.1.3 Japanese legislation
The Japanese Agricultural Standard (JAS) for organic plants and organic processed foods of plant origin was established in 2000 and based on the Guidelines for the Production, Processing, Labelling and Marketing of Organically Produced Foods which were adopted
by the Codex Alimentarius Commission. It was updated in November 2005 with the addition of standards for organic livestock products, organic processed foods of animal origin and organic feeds (Japan Ministry of Agriculture, Forestry and Fisheries, 2009).
2.3.2 Organic Standards in Canada
Prior to a Canadian legislation on organic agriculture, the provinces of Quebec and British Columbia had already established their own minimum provincial standards, as well as a procedure for accrediting organic farming certification bodies.
In Quebec, the Conseil des Appellations Réservées et des Termes Valorisants (CARTV; formerly the CAAQ), is the control authority appointed by the Quebec Ministry of Agriculture, Fisheries and Food to accredit bodies that comply with the applicable accreditation manual as certification bodies, to advise the Minister on the recognition of reserved designations, and to monitor the use of recognized reserved designations. The Quebec Organic Reference Standards define the standards of organic agriculture in Quebec (CARTV, 2009).
In British Columbia, the Organic Agricultural Products Certification Regulation under the Food Choice and Disclosure Act designated the Certified Organic Associations of British Columbia (COABC) as the administrator of the regulation to implement a government audited accreditation and standard setting program for organic certification. The standard for production and the system of farm inspection and certification spelled out in the British Columbia Certified Organic Program (BCCOP) were developed by COABC in collaboration with the British Columbia Ministry of Agriculture and Lands
(formerly the British Columbia Ministry of Agriculture, Food and Fisheries). The Food
Choice and Disclosure Act was replaced by the Agri-Food Choice and Quality Act in
2000, and allowed for the certification of non-food products and clarified some aspects of certification for handlers and retailers (British Columbia Ministry of Agriculture and Lands, 2007).
On June 1999, the Standard Council of Canada approved a national standard for organic farming, developed jointly by the Canadian General Standards Board (CGSB) and the Canadian Organic Advisory Board (COAB). The standard was voluntary based and did not constitute a minimum for organic production in Canada. It was in December 2006 that Canada’s Organic Products Regulations (OPRs) was first published in the Canada Gazette. The new Canadian Organic Regime (COR) is the mandatory system to federally regulate the organic integrity of products in Canada. It is based on four main documents:
1. The OPRs – new regulations under the authority of the Canadian Agricultural Products Act;
2. The Organic Production Systems General Principles and Management Standards, CAN/CGSB-32.310 – developed by the organic industry and the Canadian General Standards Board;
3. The Organic Production Systems Permitted Substances List, CAN/CGSB-32.311 - developed by the organic industry and the Canadian General Standards Board; 4. The COR Quality Management System (QMS) Manual.
The OPRs were under the authority of the Canadian Agricultural Product Act, and are administered by the Canadian Food Inspection Agency (CFIA). The CFIA works via
third-party “Accreditation Advisory Bodies” that accredit the “Certification Bodies” which are responsible for organic farm certification.
OPRs were meant to regulate all Canadian businesses engaged in international or interprovincial trade, and all businesses that import to Canada or buy Canadian organic products. The regulations make the Canadian organic standards and permitted substances list mandatory for all organic food and livestock feed products sold in Canada, regardless of organic status under other regulatory programs. These products will be able to opt in to displaying the “Biologique Canada Organic” seal. It was first stated that OPRs would be implemented on December 14, 2008. But on September 2008, an official amendment to the OPRs was published in the Canada Gazette, delaying implementation of the new regulations and standards until June 30, 2009.
The Organic Production Systems General Principles and Management Standards (CAN/CGSB-32.310) define the new Canadian standards for organic production. It sets general rules, as well as specific rules applying to crop production, livestock production, and specific production (apiculture, maple products, mushroom production, sprout production, greenhouse crops production, and wild crops).
The Organic Production Systems Permitted Substances List (CAN/CGSB-32.311) defines the substances allowed for organic production. Thus, any substance not on that list is prohibited by the OPRs.
3.
MAJOR CROPS IN CANADA GROWN WITHIN AN
ORGANIC FARMING SYSTEM
3.1 STATISTICS
Sustainability of agriculture, environmental concerns and food safety issues have all contributed to the growth of organic farming in Canada. The 2006 Census of Agriculture results show that 15 511 (6.8%) of all Canadian farms reported growing organic products for sale in 2006. Farms producing organic, but not certified commodities outnumber both certified organic farms and farms that are in transition to becoming certified (Table 1). These farms differ in the type of commodities produced. Farms that are reporting organic but not certified products are more likely to report animal production (Statistics Canada, 2009).
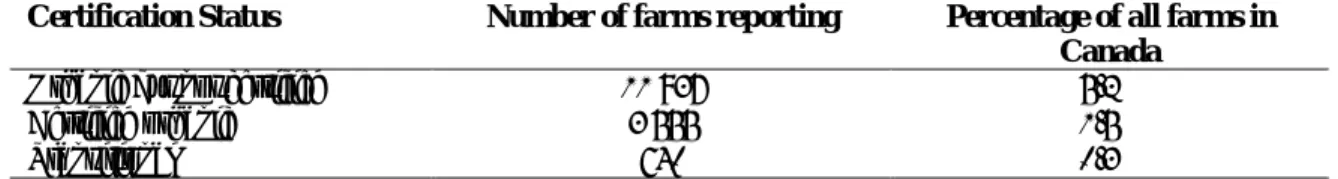
Table 3-1 Farms producing organic products, by certification status, Canada, 2006 (source: Statistics Canada, 2009 - Census of Agriculture 2006)
Certification Status Number of farms reporting Percentage of all farms in Canada
Organic but not certified 11 937 5.2%
Certified organic 3 555 1.5%
Transitional 640 0.3%
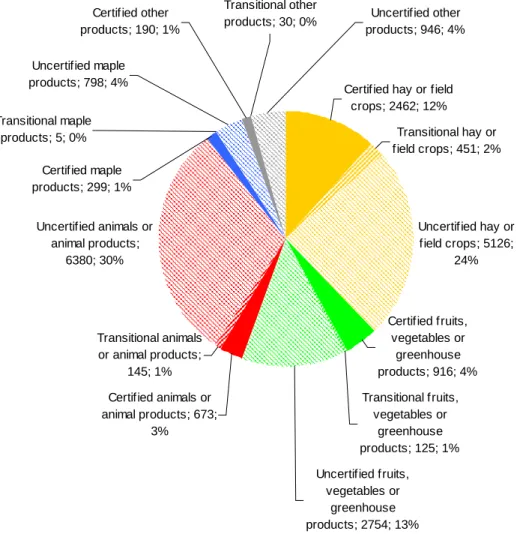
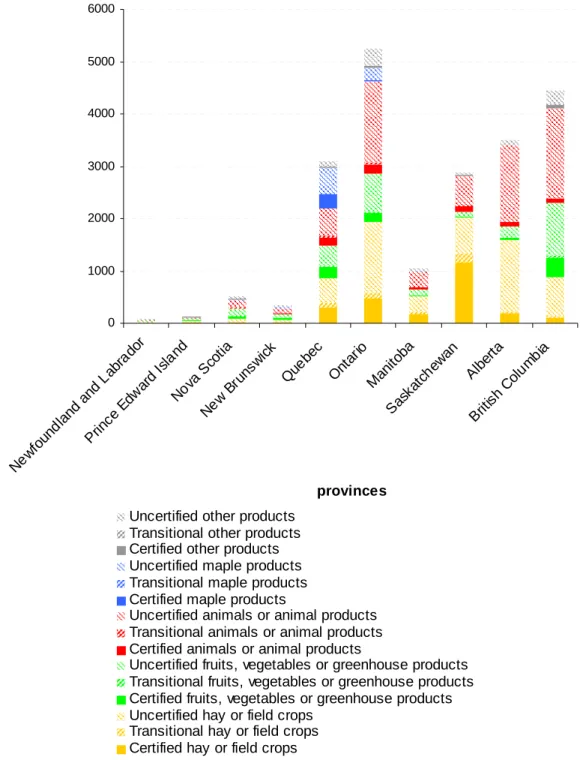
When only the organic certified farms are considered, hay or field crops is the dominant production (Figure 3.1). If the uncertified organic farms are considered, animals or animal products become the dominant production. Farms producing hay or field crops, certified or not, account for 38% of the total reported organic farms. The proportion for animals or animal products is 34%, and it is 18% for fruits, vegetables or greenhouse products. Maple products and other organic products both account for 5%. Saskatchewan is the province with the most certified farms, and Ontario is the province
with the most organic farms, certified or not, followed by British Columbia, Alberta, Quebec and Saskatchewan (Figure 3.2).
Certified hay or field crops; 2462; 12% Transitional hay or field crops; 451; 2% Uncertified hay or field crops; 5126; 24% Certified fruits, vegetables or greenhouse products; 916; 4% Transitional fruits, vegetables or greenhouse products; 125; 1% Uncertified fruits, vegetables or greenhouse products; 2754; 13% Certified animals or animal products; 673; 3% Transitional animals or animal products; 145; 1% Uncertified animals or animal products; 6380; 30% Transitional maple products; 5; 0% Certified maple products; 299; 1% Uncertified maple products; 798; 4% Uncertified other products; 946; 4% Transitional other products; 30; 0% Certified other products; 190; 1%
Figure 3-1 Certified, transitional, and uncertified organic farms in Canada, 2006 (Statistic Canada, 2009 - Census of Agriculture, 2006)
0 1000 2000 3000 4000 5000 6000 New found land and Labr ador Prin ce E dwar d Isl and Nova Sco tia New Brun swick Que bec Ont ario Mani toba Sask atch ewa n Albe rta Briti sh C olum bia provinces num be r of f a rm s
Uncertified other products Transitional other products Certified other products Uncertified maple products Transitional maple products Certified maple products
Uncertified animals or animal products Transitional animals or animal products Certified animals or animal products
Uncertified fruits, vegetables or greenhouse products Transitional fruits, vegetables or greenhouse products Certified fruits, vegetables or greenhouse products Uncertified hay or field crops
Transitional hay or field crops Certified hay or field crops
Figure 3-2 Certified, transitional, and uncertified organic farms by provinces in Canada, 2006 (Statistic Canada 2009 - Census of Agriculture, 2006)
3.2 DESCRIPTION
OF
THE
MAJOR ORGANIC FARMING
SYSTEMS (FIELD CROPS)
Organic farming systems are characterized by a prohibition to use pesticides and synthetic fertilizers. Weed, pest and disease control must be achieved through an integrated and preventive approach combined with the use of mechanical interventions. Nutrients are imported through organic manure application and the use of green manure. The use of catch crops and cover crops are also used to limit erosion and leaching of nutrients. Crop rotation is the core of organic agriculture since it allows to maintain a balanced ecosystem for weed, pest and disease control, and to maintain a sufficient nutrient pool in the soil. Many factors, such as value as cash crop or livestock feed, soil-building, nutrient conservation, weed and pest control, and demands on labour, equipment and knowledge must be considered when selecting crops in a crop rotation (Wallace, 2001). Canadian Organic Growers Inc. has produced an organic field crop handbook (Wallace, 2002) to help farmers in designing an organic crop rotation. Some tools, such as ROTOR (Bachinger and Zander, 2007) are also available to help farm managers to evaluate crop rotations that fit best according to the economical, physical, and environmental conditions. Since organic crop rotation is based on specific conditions that can differ from one region to another; and even from one farm to another, there is no “typical” organic crop rotation. Some examples of rotations used in Canada are given in the organic field crop handbook (Wallace, 2001) and in a transition kit toward organic agriculture (Fédération d’Agriculture Biologique du Québec, 2006) (see Appendix A).
When modelling organic crop rotations at a regional or national level, different approaches can be used according to study objectives. Pelletier et al. (2008), simply added a single sweet clover intercrop or cover crop to the conventional corn-soy and canola-wheat rotations when evaluating potential eco-efficiency of transition to organic agriculture in Canada. Another approach was used by Knudsen et al. (2006), who made a 10-year “regional” rotation by using field crop area statistics of a single year (appendix F, table 2).
4 APS
MODEL
REQUIREMENTS
Achievable Performance Standard or APS refers to a maximum concentration of a water contaminant (pesticide, nutrients, microbiological contaminants), allowed in surface waters at a given location on a river. For example, Rousseau et al. (2008, 2007a,b; 2006) used GIBSI (Rousseau et al., 2000, 2005; Quilbé and Rousseau, 2007) to develop a hydrological modelling framework for defining watershed-scale achievable performance standards of pesticides beneficial management practices. Within this modelling framework the fate of pesticides and nutrients and their concentration in surface waters of a river network is calculated by a series of models that are runned in a sequence. This chapter provides an overview of the data requirements to introduce organic farming practices as an alternative land management scenario within a hydrological modelling framework such as that provided by GIBSI.
GIBSI is a software integrating hydrological, erosion, pesticides and pollutant transport, and water quality models, along with a GIS and a relational data base management system (Rousseau et al., 2000, 2005; Quilbé and Rousseau, 2007). It was developed as a management tool to assess, a priori, the impact of different water and land management scenarios on water quality at the watershed scale. Input data necessary to run the different models include raster maps of elevation, soil, and land cover of the watershed, meteorological data (daily precipitations, minimum and maximum temperatures), a description of farming practices for the different crops on the watershed (crop rotations, agricultural practices, pesticides used, fertilization scenario, rate and time frame of pesticide and fertilizer applications). The output of each model is simulated on a daily time step. Computation for all models is made on sub-watersheds, called Spatial
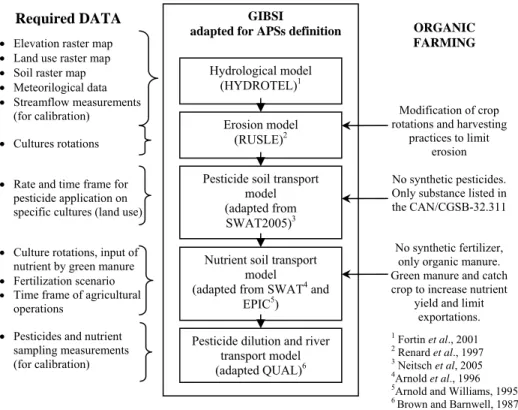
Simulation Units, or SSUs, and on the river segment draining each SSU. The size of the SSUs can vary according to the modelling objectives. Calibration of the hydrological model and water quality model with observed stream flows, pesticide and nutrient concentrations is necessary for each watershed. Figure 4.1 illustrates in a simplified way the information required by each model in GIBSI adapted for APS determination, and the level at which the simulated organic agriculture can affect the chain of models. The models are briefly described thereafter.
Figure 4-1 Illustration of data needed by the models in GIBSI, and the level at which those are influenced by organic farming practices for APS determination
4.1 Hydrological
model
The core of GIBSI is the hydrological model HYDROTEL (Fortin et al., 2001). The model computes six hydrological processes: meteorological data interpolation on each
ORGANIC FARMING
Modification of crop rotations and harvesting
practices to limit erosion No synthetic pesticides. Only substance listed in the CAN/CGSB-32.311
No synthetic fertilizer, only organic manure. Green manure and catch crop to increase nutrient
yield and limit exportations. Hydrological model
(HYDROTEL)1
Erosion model (RUSLE)2 Pesticide soil transport
model (adapted from SWAT2005)3
Pesticide dilution and river transport model (adapted QUAL)6
GIBSI
adapted for APSs definition
Nutrient soil transport model
(adapted from SWAT4 and EPIC5)
Elevation raster map Land use raster map Soil raster map Meteorilogical data Streamflow measurements
(for calibration) Cultures rotations
Rate and time frame for pesticide application on specific cultures (land use)
Culture rotations, input of nutrient by green manure Fertilization scenario Time frame of agricultural
operations
Pesticides and nutrient sampling measurements (for calibration) 1 Fortin et al., 2001 2 Renard et al., 1997 3 Neitsch et al, 2005 4Arnold et al., 1996 5Arnold and Williams, 1995 6 Brown and Barnwell, 1987
SSU (using either the Thiessen approach or an inverse distance approach based on the three closest stations), snow accumulation and melt (using a mixed degree-day and energy balance method), potential evapotranspiration (using a choice of algorithms depending on available meteorological data), soil vertical water balance (using a three-layer conceptual soil model), overland flow on each SSU (using reference geomorphologic hydrographs computed using the kinematic wave equation), and water routing in the river network (using the kinematic wave equation). Organic farming practices do not influence this model.
4.2 Erosion
model
The erosion model is an adaptation of the Revised Universal Soil Loss Equation (RUSLE; Renard et al., 1997), and computes, using outputs from the hydrological model, edge-of-the-field daily sediment loads to the river system according to the different agricultural land covers in a given SSU. The equation is based on an erosivity factor (R factor, related to precipitation and surface runoff), an erodability factor (K factor related to soil texture, structure, and permeability), length and slope characteristics (LS factor) a vegetation factor (C factor, related to land cover, growth period, and crop rotations), and an erosion control factor (P factor, related to soil conservation practices). Organic farming practices will influence that model by modifying the C factor, related to vegetation cover and crop rotation, in RUSLE. A proper C value must be determined for each crop rotation of the organic farming scenarios.
4.3
Land pesticide transport model
The land pesticide transport model is an adapted version of SWAT (Arnold and Fohrer, 2005) and computes the total load of pesticide exported from agricultural fields to the river segment of each SSU. It uses outputs from the hydrological and erosion models as inputs, as well as pesticide application rates for a time frame for each crop type according to the land cover map. The model accounts for: (i) volatilisation during application, (ii) interception by crop foliage, and (iii) the remaining fraction reaching the ground surface. That last fraction is further divided into two parts: a dissolved part in the soil solution, and an adsorbed part to soil particles. The partitioning depends on the distribution coefficient (Koc) particular to the sorption of each pesticide to the soil organic matter
(OC). The pesticides intercepted by the foliage will degrade and dissipate by different processes: photolysis, oxidation, hydrolysis, volatilisation, and biodegradation. All those dissipation and degradation processes are simulated by a first-order decay equation using a half-life value, also specific to a given pesticide. Pesticides dissolved in the soil solution can reach the river through surface runoff or infiltration, while pesticides attached to soil particles are transported via erosion. Both hydrological and erosion models outputs are used as inputs to simulate transport of pesticides from cropland. Note that the model neither simulates the fate of pesticides lost to the atmosphere or absorbed by plants and the complex evolution of metabolites. The adsorption, soil half-life time, and solubility values used for the modeled pesticides were taken, in previous studies, from the database provided by Hornsby et al. (1996). Since all pesticides, except pyrethrum for mushroom production and some domestic formulations of rotenone, are
prohibited by Canadian organic agriculture standards, no pesticide inputs should be modelled on organic farms for APS determination.
4.4
Land nutrient transport model
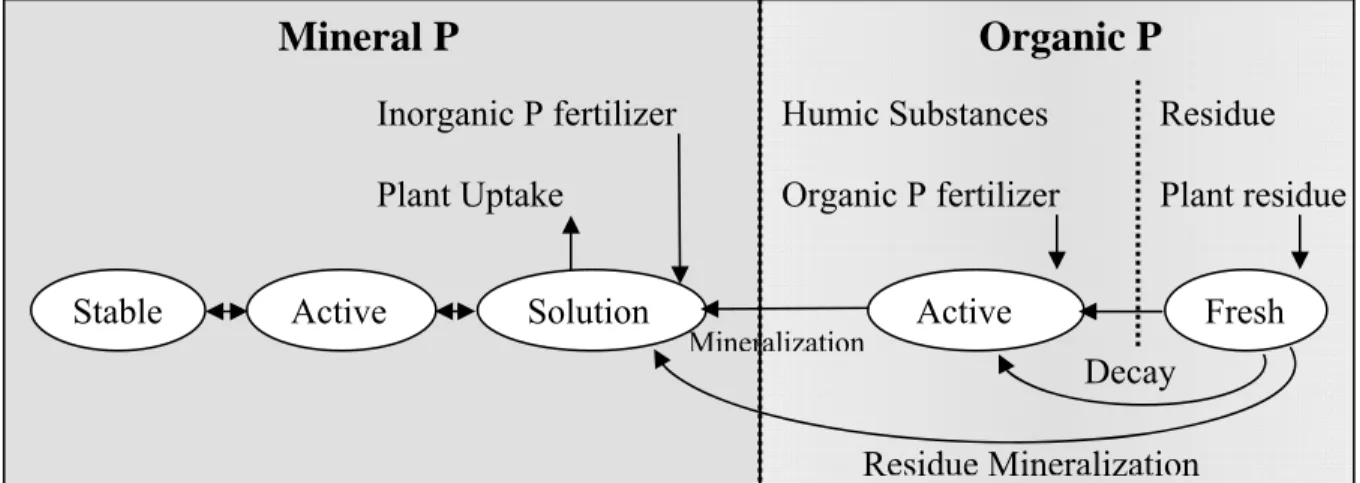
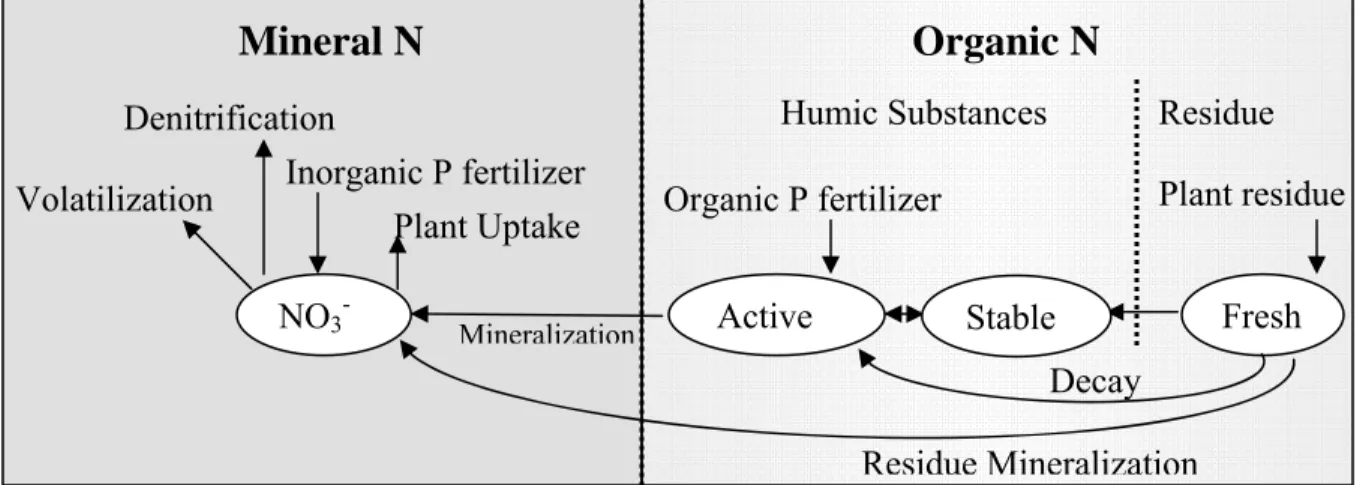
The land nutrient transport model is adapted from both SWAT (Arnold et al., 1996) and EPIC (Arnold and Williams, 1995). It simulates the nitrogen and phosphorus cycles, from their inputs as crop residues, fertilizer, nitrogen fixation, or precipitation to their washing by surface runoff and underflow, by taking into account the main chemical transformations and transfer that occur in the soil; and the uptake by growing crops. Figures 4.2 and 4.3 show the modelled phosphorus and nitrogen cycles in GIBSI. The use of crop rotations and green manure in organic farming influence the nutrient cycles in the soil, and their vulnerability to leaching. The equations used to model the different nutrient cycles processes are described in Lasbleis et al. (2008). A close examination of how the simulated processes are affected by the organic farming practices, namely here the use of green manure and catch crop, is required in order to assess how organic farming can be taken into account by GIBSI.
Figure 4-2 GIBSI soil phosphorus pools and processes that move P in and out of pools
Organic P
Humic Substances Residue Organic P fertilizer Plant residue
Fresh Active Solution Active Stable
Mineral P
Inorganic P fertilizer Plant Uptake Decay Residue Mineralization MineralizationFigure 4-3 GIBSI soil nitrogen pools and processes that move N in and out of pools
4.5
Water quality model
The basic equation solved by the adapted QUAL2E model (Brown and Barnwell, 1987) in GIBSI is the one dimensional advection dispersion mass transport equation, which is numerically integrated over space and time for each water quality constituent (river segment). This equation includes the effects of advection, dispersion, dilution, constituent reactions and interactions, sources and sinks. For any constituent, C, this equation can be written as:
1 1 x L x x x x x C A D A uC A C x C dC S t A x A x A t dt Where :C: Concentration of the constituent C (M L-3) x: Position (L)
t: Time (T)
2
Organic N
Humic Substances Residue Organic P fertilizer Plant residue
Fresh Active NO3
-Mineral N
Inorganic P fertilizer Plant Uptake Decay Residue Mineralization Mineralization Stable Denitrification VolatilizationDL: Dispersion coefficient (L2 T-1)
u: Mean velocity of the flow (L T-1) S: External sources or sink (M T-1)
The model also simulates the following processes: algal growth, phosphorus and nitrogen cycles, coliforms evolution, atmospheric reaeration and pesticide fate. The relevant simulated variables for APS determination are: organic nitrogen (N-org), ammonia (NH3), nitrites (NO2), nitrates (NO3), organic phosphorus (P-org), dissolved
phosphorus (P-dis), and up to three pesticides simultaneously. Transformations of those variables are modeled by first order kinetics described in Brown and Barnwell (1987). Organic farming practices influence inputs of nutrients and pesticides into the water bodies, as simulated by the land and pesticide transport models, but they have no further influence on the processes simulated by the water quality model. The water quality model is therefore not influenced by organic farming, except for the potential modification of inputs simulated by the preceding models.
5
ENVIRONMENTAL IMPACT OF ORGANIC
FARMING
Conacher and Conacher (1998) made a review of the environmental effects associated with organic farming. Such effects comprise real, or potentially, beneficial effects to: the soil (including changes to soil physical, biological and chemical properties, soil nutrient, soil acidity), pest and diseases incidence, plant and animal quality, erosion and runoff, recycling of organic waste, reduced use of synthetic chemicals, the ecological systems. Some of those environmental effects will be briefly discussed, with emphasis on the aspects related to water quality that can influence APSs. Among the environmental effects presented, there is the increased risk of nutrient imbalance due to (i) reduced availability of organic manure, (ii) the precise timing of operation that is required in order to make the nutrient, tied up in organic or insoluble forms within the soil matrix, available for plant uptake. Increasing soil acidity by incorporating plant residues and animal manure can also be problematic in some regions.
5.1
Reduction of erosion
The build up of soil organic matter and maintenance of a protective surface cover under organic systems favour a reduction in soil loss (Crosson, 1981; Papendick and Elliot, 1984, in Conacher and Conacher, 1998). Auerswald et al. (2003) used the Universal Soil Loss Equation (USLE) to make a statistical evaluation of soil erosion for 2056 district in Bavaria, comparing the organic and conventional systems. They estimated that there was an average of about 15% less erosion on organic arable land than for conventional farming due to the larger area of grass under the organic system. Moreover, they pointed
out that organic farms are more often located in areas that are vulnerable to erosion than conventional farms.
5.2
Reduced use of synthetic chemicals
The approach to insects, weeds and diseases control under organic systems is an integrated and preventive one. The prohibition of pesticides and synthetic fertilizers causes less disruption of natural habitats, increases incidence of beneficial organisms, reduces toxic residues, and lower costs of chemical inputs and remediation (Conacher and Conacher, 1998). Organic farming practices have also been found to reduce the incidence of pests and diseases through changes to organism physiology, metabolism and habitat (Cook, 1986; Smal and McDonald, 1992; Sivapalan et al., 1993; Hedges, 1996; Tesoriero et al., 1996, in Conacher and Conacher, 1998).
5.3
Soil physical, biological and chemical properties
The addition of organic matter to the soil, with good management practices, can improve soil structure, stability and cohesion. It can result in a reduced bulk density and a better aeration. Cation exchange capacity and soil water balance are also improved. However, those improvements are conditional to soil type, climate, local conditions, past land use, types and rates of soil amendments and/or practices. The adverse effects on soil animal diversity and abundance associated with the use of chemical fertilizers and pesticides on conventional farms is reversed under the organic systems. This can result in an increased in soil biomass, biological abundance, diversity and activity (Conacher and Conacher, 1998).
There is a close relationship between the organic matter content and the nutrient status of soils. Long term experiments have shown that crop rotations, typically used in organic farming, are capable of increasing the soil organic carbon content by 13-28% compare to conventional arable farming (Smith et al., 1997). Arden-Clarke and Hodges (1988) stated that physical and biological changes in soil properties under organic farming systems improve the soil’s chemical status with regards to nutrients and their availability.
Atmospheric nitrogen (N2) fixation can be a very important nitrogen input in organic
farming systems. The N2 fixation is mainly influenced by the inorganic nitrogen content
in the soil, the soil water content, the soil temperature, and the legume species (Hansen et
al., 2000). The conversion from conventional to organic arable farming implies a shift
from mineral to organic fertilizers, in which high levels of mineral fertilizer inputs are replaced by manure amendments and the introduction of green manure in crop rotations. Furthermore, organic farms maintain a higher proportion of permanent grassland, incorporate more straw into soils and make more efficient use of catch crop than conventional farms (Knudsen et al., 2006).
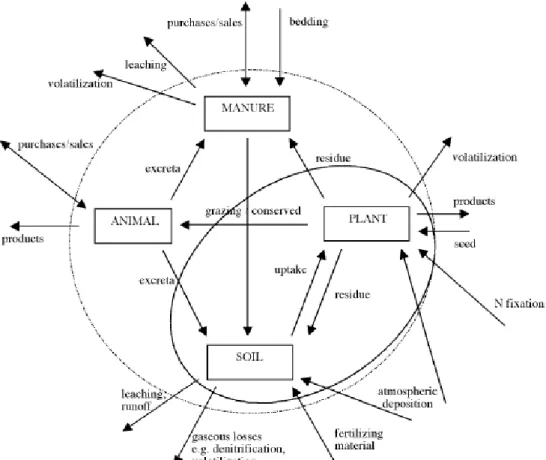
The nitrogen balance model used by Hansen et al. (2000) show an average total nitrogen input to the organic systems lower (104–216 kg N·ha-1·yr-1) than to the conventional farming systems (146–311 kg N·ha-1·year-1). The N-balances for both systems showed a surplus of nitrogen into the root zone (60 to 143 kg N·ha-1·yr-1 for the organic system, and
25 to 155 kg N·ha-1·yr-1 for the conventional system). Figure 5.1 illustrate the nutrient flows that may occur on an organic farm.
Figure 5-1 Representation of nurient flows that may occur on an organic farm (from Watson et al., 2002)
Watson et al. (2002) reviewed 88 nutrient budgets of organic farms in nine temperate countries. All the nitrogen budgets showed an N surplus (average 83.2 kg N·ha-1·yr-1). The efficiency of N use, defined as outputs/inputs, was largest (0.9) in arable farms, and lowest (0.2) in beef farm system. The P budget showed a surplus (average 3.6 kg P·ha
-1·yr-1). The estimation of N fixation and quantities of nutrients in manures may however
introduce significant errors in nutrient budgets (Watson et al., 2002).
Ryan et al. (1994, in Conacher and Conacher, 1998) report that levels of mycorrhizal colonization, which are important for the efficiency of phosphorus and other nutrients
uptake under low soil nutrient conditions (Wild, 1993; in Conacher and Conacher, 1998), were greater under organic treatment than under the conventional treatment.
5.4 Nutrient
leaching
A few studies compared nutrient leaching from organic and conventional farming systems. N leaching from organic farming systems is sometimes lower than from conventional systems, but the difference is not always significant (Korsaeth, 2008; Aronsson et al., 2007; Stark et al., 2006; Stopes et al., 2002). Knudsen et al. (2006) reported lower leaching from organic mixed dairy farms than for conventional systems, but it was comparable for both systems when considering arable farms. Hansen et al. (2000) also reported a lower N leaching potential for organic mixed dairy/beef farms, and organic arable crops on sandy soils than from the same conventional systems in Denmark. However, it was still uncertain whether the N leaching is smaller or larger from organic arable crop production systems on a loamy soil, and organic pig production on loamy and sandy soils, than from the same conventional systems. Modelled N leaching varied from 19 to 30 kg N·ha-1·yr-1 on loamy soils to 36–65 kg N·ha-1·yr-1 on sandy soils under organic farming. Comparable leaching from both systems, in a range between 66 and 87 kg N·ha-1 over the October-March period, was also reported by De Neve et al. (2003), except for conventional pasture system which had a smaller lost (35 kg N·ha-1) and the conventional cauliflower system which had very large losses (293 kg N·ha-1). N leaching potential risk from organic and low N-input systems was reported by Poudel et al. (2002), to be lower than for conventional systems in northern California due to lower mineralization rates, but it was found to be very similar on average by
Kristensen et al. (1994) for organic and conventional farms using manure. However, that last study also reported that conventional farms not using manure had a lower N leaching risk than the two aforementioned systems. Torstensson et al. (2006) also found that average N leaching loss was less important from a conventional system with a cover crop (25 kg N·ha-1·yr-1) compare to an organic system with (39 kg N·ha-1·yr-1) or without (34 kg N·ha-1·yr-1) animal manure, or a conventional system without cover crop (38 kg N·ha
-1·yr-1). Sylvasalo et al. (2006) could not confirm the environmental advantage of the
organic system over the conventional system with respect to N leaching in sandy soils.
The difference between the vulnerability to N-leaching of organic versus conventional systems was sometimes attributed to crop rotation and green manure (Stark et al., 2006), and to lower N input (Knudsen et al., 2006; Hansen et al., 2000). Cuttle and Jarvis (1995) also mentioned the potential impact of differences in the organic matter content and biological activity of organically and conventionally managed soils. Independently of the agricultural system, N leaching occurs when there is a large amount of soluble inorganic N in the soil at times of the year when low evapotranspiration and/or high precipitation leads to percolation through the root zone (Hansen et al., 2000). Vulnerability to leaching is affected by the choice of crop rotation (Thomsen et al., 1993), and more particularly by the use of catch crop (Hansen et al., 2000; Knudsen et
al., 2006), the soil type, and the level of soil organic matter (Knudsen et al., 2006). It is
larger in sandy soils with a high level of soil organic matter and no catch crops (Knudsen
et al., 2006). Evaluation of different management scenarios by Knudsen et al. (2006)
practice for reducing N leaching loss: by approximately 9 kg N·ha-1·yr-1 for organic farms and 7 kg N·ha-1·yr-1 for conventional farms. The amounts of fertilizer or manure applications, and the timing of applications, also have significant effects on the leaching of nitrate, particularly if the application raises the level of inorganic nitrogen in the soil when there is percolation from the root zone (Knudsen et al., 2006).
Aronson et al. (2007) reported an average annual P leaching that showed a greater variation than N leaching, and that was significantly greater in an organic system without animal manure (0.81 kg P·ha-1·yr-1), in which green manure crops were used for N supply, than in conventional cropping system with cereal and application of mineral fertilizer (0.36 kg P·ha-1·yr-1) or in organic system where cattle slurry was applied (0.41 kg P·ha-1·yr-1). Torstensson et al. (2006) reported P leaching loads that were small (<0.25 kg P·ha-1·yr-1) regardless of the agricultural system.
5.5 Summary
Following this review, it can be concluded that a conversion from a conventional farming system to an organic farming system can affect water quality by: (i) potentially reducing sediment loads due to soil erosion by an increased use of cover crops; (ii) reducing total pesticide load in watercourses since pesticides are prohibited by organic standards; (iii) affecting nutrient cycles and nutrient availability to leaching by using green manure and catch crops instead of synthetic fertilizers. It is however uncertain whether the changes occurring in the nutrient cycles are increasing or lowering nutrient exports by leaching and runoff to the surface water.
6
LITTERATURE SEARCH ON ORGANIC FARMING
MODELLING WITH REGARDS TO APS
A literature search was conducted in order to identify models that have been used so far to simulate the impact of organic farming practices on surface water quality, or on the processes that affect surface water quality. The search was performed with the Boolean expression:
organic* AND (farm* OR agri*) AND model*
to be found in the title of documents covered by the following databases and search engines:
1 Web of Science (1989 - today) 2 Scopus (1823 - today)
3 Agricola (15th century - today)
4 Water Resources Worldwide (1967 - today) 5 World Wide Science.org
6 Google Scholar
Complementary literature regarding environmental benefits of organic farming, and type of organic practices, was found by searching the following expressions in combination to the “organic* AND (farm* OR agri*)” condition:
conventional*, leach*, review*
An important fraction of the models dealing with organic agriculture are devoted to evaluate the feasibility or the economic impact, at scales ranging from the farm to the whole state, of converting from the conventional to the organic farming system.
Considerable modelling effort was also made in order to assess the impact of different policies regarding organic agriculture on economic and environmental aspects. Berentsen and Huirne (2005) reviewed several of those models. More recently, models have also been used to compare the energy efficiency and the impact of agricultural farming on global environmental issues like carbon sequestration and greenhouse gas emission (Pelletier et al., 2008; Kusterman et al., 2008; Olesen et al., 2006; Foereid and Hogh-Jensen, 2004; Dalggard et al., 2001).
More relevant to the present review, with regards to APSs, are the models that have been used for assessing impact, at the farm level, of organic farming on erosion, pesticide, and nutrient exportations to surface water. Of the reviewed studies, only Auerswald et al. (2003) modeled the effect of organic farming on erosion, at the regional scale, with the USLE equation. Since pesticides are prohibited in organic farming systems, pesticide exports from organic farms are not an issue that has been examined by the scientific community.
Most of the examined literature was related to nutrient fluxes modeling. Some of the examined models were intended to be management tools at the farm scale. Such are MANMOD (UK Department for Environmental, Food and Rural Affair, 2001) and MANNER (Chambers et al., 1999). Those modeling tools can compare different techniques of manure management in order to minimize nutrient leaching, ammonia volatilization and nitrous oxide emission. They require little information as input, relying on databases built with field measurement and scientific literature data. ROTOR
(Bachinger and Zander, 2006) is another management tool designed to optimize crop rotation with regard to nutrient balance, nitrate leaching, weed infestation risks, and economic performances. A simple empirical equation, depending on percolation, soil clay content, average nitrogen input and crop sequence, was used by Hansen et al. (2000) to model nitrogen leaching. Finally, four farm-scale nutrient dynamic simulation models were examined. DAISY (Hansen et al., 1991) was employed by Müller et al. (2006), to study how catch crops affected nitrogen dynamics in organic farming systems. It was also used by Jensen et al. (1999) to simulate plant production and N fluxes in organic farming systems. NDICEA (Koopmans and Bokhorst, 2002) was used to estimate how crop rotations and manure applications affect the amount of mineral nitrogen in different phases of a crop rotation. FASSET (Berntsen et al., 2003) was applied by Knudsen et al. (2006) to estimate N leaching losses on organic and conventional arable farms in Denmark. The FARMFLOW model was used by Modin-Edman et al. (2006) to compare the stocks, flows and resulting balances of P in organic and conventional dairy farms. The GLEAMS model has also been utilised by Pacini et al. (2003) to evaluate sustainability of organic, integrated, and conventional farming systems, but details on the modeling exercise have not yet been published. The next sections summarize the results obtained in the aforementioned studies.
6.1 USLE
(Auerswald
et al., 2003)
Only one reviewed article compared the erosion from organic and conventional farming systems. Auerswald et al. (2003) used the Universal Soil Loss Equation (USLE) to make a statistical evaluation of soil erosion for 2056 districts in Bavaria, comparing the two
systems. On average, about 15% less erosion on arable land was predicted for organic agriculture than for conventional farming due to the larger area of grass, although organic farms occupy areas that are more often prone to erosion than conventional farming. USLE predict long term average, annual soil loss from the multiplication of six complex terms:
A = R K L S C P (6.1)
Where;
A: Long-term average annual soil loss (t·ha-1·yr-1); R: Rainfall and runoff erosivity (N·h-1·yr-1); K: Soil erodibility (t·h·ha-1·N-1);
L,S: Dimensionless topography factors quantifying the influences of the watershed
area and watershed curvature;
C: Dimensionless factor quantifying the influence of the cropping system; P: Dimensionless factor quantifying the influence of permanent erosion control
measures like terracing and contouring.
The C factor quantifies the influence of cropping, and is thus the main factor that distinguishes organic from conventional systems. It is computed from the combination of a soil loss ratio (SLR) with an erosivity index (EI) (Wischmeier and Smith, 1978). The EI quantifies the seasonal distribution of rainfall erosivity. The SLR quantifies the susceptibility of the soil surface relative to the conditions that occur in a freshly prepared seedbed, which is thus considered a standard. The SLR mainly depends on tillage and soil cover.
The C factor must be computed as a long term average for complete rotations because there is often a period between two main crops, that may last for several months, where considerable erosion may occur but cannot be assigned either to the previous or to the following crop. Also, some carry-over effects may exist, by which the previous crop influences the extent of erosion during following years. This is especially true in grass-based rotations. Sod-forming crops like clover-grass are known to stabilize the soil. This decreases soil loss up to two years after the sod has been ploughed as compared to an otherwise identical system without sod (Wischmeier and Smith 1978).
The C factor was estimated by Auerswald et al. (2003) using simple parameters with the following equation, valid for both organic and conventional farming systems:
C = {[830-15.8(G+M+S) + 0.082 (G+M+S)2] (1-0.03S) + 0.1S – 0.5M + 27}/1000 (6.2)
Where:
G: Percentage of small grain (including oil seeds);
M: Percentage of row crops planted in mulch tillage (planting of row crops into a
mulch cover crated by the cultivation of cover crops, which are either frozen down during winter or chemically killed prior to row crop sowing or planting);
S: Percentage of sod-forming crops
When the calculated C factor is less than 0.01, its value is set to 0.01, and when it exceeds 0.45, it is set to 0.45.
6.2
MANMOD and MANNER models
MANMOD is an iconographic-based model representation of the pathway followed by manure in an individual organic farm. The different stages are taken into account by the model as a sequence of node-component (manure source, housing system, hard-standing area, storage system, applicator, soil-type, hydrologic environment, import and export) where the output, the losses, and the balance of nutrients (N, P and K) are computed on a monthly basis. MANMOD maintains a running balance of those nutrients through each component of the system for both “liquid” and “solid” fractions of the manure by updating volume or mass, percentage of dry matter, and nutrient concentration. Default values for the initial monthly volumes, nutrient concentrations and dry matter are extracted from a database containing records of urine and faeces for each livestock type (not published). Dynamics in the components are simulated by simple empirical equations. Lack of detailed measurements did not allow to thoroughly testing the validity of the model (UK Department for Environmental, Food and Rural Affair, 2001).
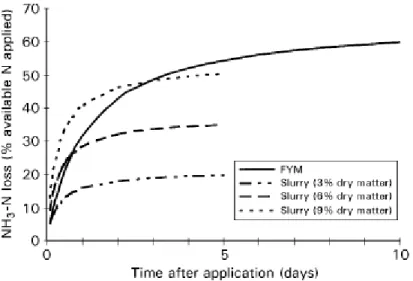
MANMOD was designed to be used in combination with the MANure Nitrogen Evaluation Routine (MANNER) to evaluate gaseous emission, nitrate leaching, and nitrate availability following spreading of organic manure in the field. Type and rate of application of manure are required as input. Default values for dry matter content, total N, and readily available N, also needed as input, are associated with 17 different types of manure (appendix B). Application date, delay before incorporation, soil texture, date of end of drainage and total rainfall are the other needed information. Volatilization is simulated as a function of t, the time between manure application and incorporation, of
Nmax, a maximum NH3 volatilization loss as t approaches infinity, and of a Km value
representing the time when the cumulative NH3 volatilization reached 0.5·Nmax. Nmax and
Km values were derived for different manure types. Denitrification and immobilisation
are not simulated. Mineralization is simply calculated by multiplying the amount of organic N in the manure by a factor depending on the type and time of application. Leaching is calculated by multiplying the readily available N by the effective rainfall divided by the topsoil volumetric moisture content minus a constant. Good agreement was found when comparing the model prediction to experimental data. A more detailed description of the model and the equations used are included in Appendix B.
6.3 ROTOR
model
(Bachinger and Zander, 2007)
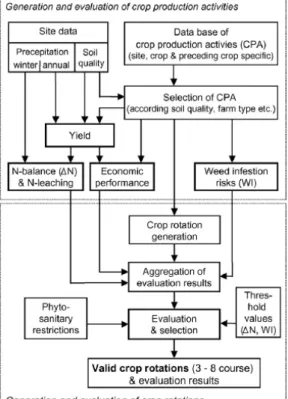
ROTOR is a tool designed to generate and evaluate site-specific crop rotations for organic farming systems in central Europe. A relational database is used to assemble a set of annual crop production activities (CPAs) from single site and crop specific field operations. More than one CPA is associated to each crop depending on the preceding crop, and the following field operations (ploughing or non-inverting tillage, undersowing crops, using catch crops, manuring, straw harvesting, and mechanical weed control). Ruled-based assessment modules are then used to evaluate yield, economic performance, N balance, nitrate leaching, and weed infestation risks. All possible sequences of CPAs are then linked to a 3-8 year preliminary crop rotations according to farm type (cash crop farm with legume grass used as set-aside, no manuring, no straw harvesting; mixed farm with legume grass forage production) and soil quality (CPAs are described for four different production levels depending on soil quality). N balance and N leaching risk are
quantified by using a set of algorithms derived from literature, experimental data, on-farm research and expert knowledge (Appendix C). This allows for the assessment of N removal, N2-fixation, and N losses through nitrate leaching and NH3-volatilization out of
mulched biomass, according to site characteristics and preceding crop category. The capability of different catch crops undersown in main crops or stubble seeded to reduce NO3- leaching is included. The sum of the atmospheric deposition and the non-symbiotic
N2-fixation is assumed to be equal to the denitrification losses and therefore these
processes are not calculated. A more detailed model description and its equations are included in Appendix C.
6.4 HANSEN
et al. (2000) equation
The empirical model used by Hansen et al. (2000) was adapted from Simmelsgaard (1998):
L = exp(1.136 - 0.0628clay + 0.00565N + crop)P0.416 (6.3)
Where:
L: N leaching;
clay: clay content (%) in the 0-25 cm depth;
N: average N input (N = Nmanure + Nfertilizer + Nfixation);
crop: parameter estimate related to the summer crop and the following winter crop; P: percolation in mm·yr-1
No value for the crop parameter are given in Hansen et al.(2000), however, different crop yields in Denmark on loamy and sandy soils, as well as N balance and modelled
N-leaching from organic and conventional arable crop farms, pig farms, dairy/beef farms are presented (Appendix D).
6.5 DAISY
model
(Hansen
et al., 1991)
DAISY is a deterministic model that simulates water, energy, C and N-fluxes in a one-dimensional soil-plant-atmosphere system. Jensen et al. (1999) presented preliminary modelling results on N fluxes in organic farming systems and outlined the need to develop a robust crop module for grass-clover mixtures used as green manure. According to Müller et al. (2006), DAISY was able to simulate soil mineral N and soil microbial biomass N after soil incorporation of catch crop plant residues to some extent only. Some processes needed further investigation: (1) soil-tillage induced mobilisation of organic material including considerable amounts of organic N; (2) winter killing of sensitive plant species and varieties; (3) decomposition of plant residues at the soil surface; (4) decomposition of easily decomposable plant residues at low temperatures, both with respect to a temperature modifier function and to the linkage of C an N turnover; (5) reliable criteria for the subdivision of green plant residues into an easily decomposable pool and a more recalcitrant pool.
The model includes a hydrological model (with a submodel for soil water dynamics), a soil temperature model, a soil nitrogen model (with a submodel for soil organic matter dynamics), a crop model (with a submodel for N uptake).
The soil part of the model has a one-dimensional vertical structure. The soil profile is divided into layers on the basis of physical and chemical soil characteristics. The soil N model takes into account net mineralization, nitrification, denitrification, uptake by plants and leaching from the root zone.
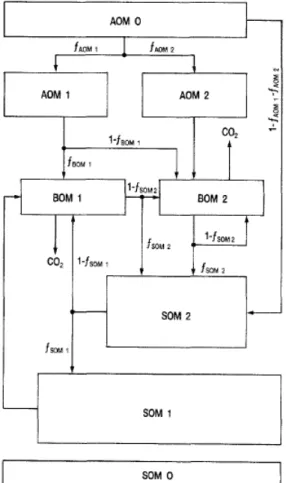
Degradation of soil organic matter is considered to be the determining step governing mineralization. Organic matter in the soil is conceptually divided into three main pools (Appendix E): dead native soil organic matter (SOM), microbial biomass (BOM) and added organic matter (AOM). Each main pool of organic matter is subdivided into two or three subpools characterized by a particular C to N ratio and by a particular turnover time. The rate of decomposition of SOM is simulated by first-order reaction kinetics. The BOM in the soil usually accounts for less than 3% of the total soil organic carbon. Simulation of microbial biomass turnover is based on growth efficiency, maintenance, respiration, and death rate coefficients. The added organic matter (AOM0) is organic
fertilizer such as farmyard manure, slurry, green crop manure, or crop residues left in the field after harvest. The added organic matter is allocated to subpools AOM1, AOM2 and
SOM2. Subpool AOM1 is a substrate for both BOM1 and BOM2, and decomposes slowly,
while AOM2 which is easily decomposable is a substrate for BOM2 only. The rates of
decomposition of AOM1 and AOM2 are simulated by first-order reaction kinetics.
The considered abiotic factors influencing the carbon turnover are soil temperature and soil water status, and in the case of subpools SOM1, SOM2, BOM1, also clay content.
The abiotic functions (Appendix E) adopted were derived from various sources in the literature.
Nitrification is influenced by soil temperature and soil water status. The abiotic functions adopted for nitrification were derived from various sources in the literature (Appendix E).
Denitrification is modelled by defining a potential denitrification rate (i.e., the denitrification rate under complete anaerobic conditions). The potential denitrification rate is assumed to be related to soil temperature (by the same function used for mineralization; Appendix E), CO2 evolution rate, and an empirical constant. Under
partly anaerobic conditions, the potential denitrification rate is adjusted according to the soil water saturation (Appendix E).
N uptake model, for ammonium and nitrate, is based on the concept of a potential N demand simulated by the crop model, and the availability of N for plant uptake. N uptake equals the N flux toward the root surface, which is calculate by mass flow and diffusion equations.
Vertical movement of nitrogen in the soil is modelled by solving the convection-dispersion equation.
6.6
NDICEA model (Koopmans and Bokhorst, 2002)
The Nitrogen Dynamics in Crop rotations in Ecological Agriculture (NDICEA) model was developed to estimate how crop rotations and manure applications affect the amount of mineral nitrogen in different phases of a crop rotation. It was tested on eight (8) organic farms and research sites and results fitted observed mineral N for the top 30 cm of the soil with a modeling efficiency (ME) of 0.4 and a coefficient of determination (r) of 0.5. The performance of the model was limited regarding the prediction of N level in the lower soil layer, and the authors have some reserves on its ability to adequately predict N leaching losses.
The model consists of four major modules: water balance, organic matter balance, crop growth, and N balance. It uses a weekly time step. The modeled soil profile in the root zone is divided in two layers. The top layer (0-30 cm) is the layer where mixing of the soil takes place through cultivation. Manure and fertiliser additions are applied and mixed to that layer. Storage of water and nutrient can also take place in the sub-layer (30-60 cm) if leaching occurs from the upper layer. Inorganic N is transported with the water down the soil profile, depending on a N leaching factor. Nitrogen that leaches below the rooting depth is considered lost.
The core of the model is the decomposition module in which the mineralization process is described. Mineralization is calculated for each successive application of organic matter, and according to the type and quantity of that organic matter. For each type of organic matter the C: N ratio and the apparent initial age (ranging from 1 for green matter to 24