Systematic review of the relationship between
childcare educators’ practices, and preschoolers’
physical activity and eating behaviours
Stéphanie Ward, RD, MSc (Corresponding author)
PhD graduate student, Faculty of medicine and health sciences, Université de Sherbrooke Centre de formation médicale du Nouveau-Brunswick
Pavillon J.-Raymond Frenette 18, rue des Aboiteaux
Moncton, NB Canada E1A 3E9 Phone: (506) 863-2273
Email: [email protected] Mathieu Bélanger, PhD.
Assistant Professor, Department of family medicine, Université de Sherbrooke Director of research, Centre de formation médicale du Nouveau-Brunswick Epidemiologist, Vitalité Health Network
Pavillon J.-Raymond Frenette 18, rue des Aboiteaux
Moncton, NB Canada E1A 3E9 Phone: (506) 863-2221
Email: [email protected] Denise Donovan, MD, MPH
Associate Professor, Department of Community Health Sciences, Université de Sherbrooke Centre de formation médicale du Nouveau-Brunswick
Pavillon J.-Raymond Frenette 18, rue des Aboiteaux
Moncton, NB Canada E1A 3E9 Phone: (506) 863-2269
Email: [email protected] Natalie Carrier, PhD.
Director and Associate Professor, École des sciences des aliments, de nutrition et d’études familiales, Université de Moncton
Pavillon Jacqueline-Bouchard 51 Antonine-Maillet Avenue Moncton, NB
Canada E1A 3E9
Phone: 1 (506) 858-4003 Fax : 1 (506) 858-4283
Keywords
childcare centre, childcare educator, physical activity, eating behaviour
Running title
Review of childcare educators’ practices
Acknowledgements
SW was supported by a Canadian Institutes of Health Research Charles Best Canada Graduate Scholarships Doctoral Award and by the Gérard-Eugène-Plante Doctoral Scholarship. The funders did not play a role in the design of the study, the writing of the manuscript or the decision to submit it for publication.
Conflict of interest statement
Abstract
The role of childcare educators is important given that 81% of preschoolers living in developed countries receive childcare outside their home. Since children learn by observing and imitating others, childcare educators may play a role in promoting healthy eating behaviours and physical activity in young children. Six databases were searched for quantitative peer-reviewed, English or French primary studies reporting the correlates, predictors or effectiveness of childcare educators’ practices and behaviours on preschoolers’ healthy eating and physical activity behaviours. Risk of bias was assessed using the Quality Assessment Tool for Quantitative Studies. Fifteen articles were included in this review: ten measured physical activity levels and five assessed eating behaviours. The quality score was rated as low for eight of these articles, and as moderate for the remaining seven. Two of four cross-sectional studies reported a positive relationship between educators and children’s behaviours. Eleven intervention studies reported significant favourable effects of interventions. Educators may play a positive role in promoting healthy behaviours in children, but this is mainly based on studies of low or moderate qualityfew intervention type studies of low or moderate quality. The influence of specific components of educators’ practices and behaviours on children’s healthy eating and physical activity behaviours remains inconclusive.
Introduction
Childhood obesity has become a worldwide public health challenge, affecting approximately 43 million children under the age of 5 in 2010 [1]. The prevalence of overweight and obese children worldwide has increased from 4.2% to 6.7% since 1990; an increase that is expected to continue over the next decade [1]. Beyond being linked to an increased risk of remaining obese throughout childhood [2] and into adulthood [3], childhood obesity has been associated with immediate and long-term physical and emotional health problems [4–8].
In young children, obesity is primarily caused by an energy imbalance [9] which can be largely influenced by adults given the control they exert over the quality of children’s diet and their exposure to opportunities to be physically active. Although parents tend to be the primary caregivers of children, approximately 81% of children between the ages of 3 and 5 living in developed countries receive childcare outside their home [10]. Although the average number of hours children spend in childcare varies considerably across countries [10], more than half of children in the United States and Canada spend an average of 30 hours a week in childcare [11,12]. Similarly, in a number of European countries, preschoolers are enrolled in formal childcare for an average of 30 hours or more per week [13]. Childcare centres could therefore be key settings for promoting healthy eating and physical activity behaviours in children, particularly in developed countries. The theory of observational learning suggests that children’s behaviour is partly shaped by observing and mimicking the behaviour of others [14]. Behaviours modelled by educators in childcare centres may therefore have an important influence on the behaviours adopted by children [15,16]. Although some childcare-based nutrition and physical activity interventions have demonstrated positive outcomes on children’s behaviours [17,18], little is known about how the social environment influences these behaviours.
Guidelines from the American Academy of Pediatrics, the American Public Health Association and the American Dietetic Association recommend that childcare educators provide opportunities for children to learn about food, practice and model healthy eating behaviours, have frequent conversations on trying and enjoying healthy foods, and to let children serve themselves during meals [19,20]. The American Dietetic Association also reinforces the importance of creating positive environments at mealtimes, which includes letting children decide what and how much to eat and not forcing children to finish their plate [19]. With regards to recommendations related to physical activity, the Centers for Disease Control and Prevention discourages withholding physical activities as means of punishment and encourages adults to actively participate in physical activities with children [21].
Some childcare educators’ practices are aligned with guidelines, such as eating their lunch with children at mealtime, presenting new food enthusiastically, and structuring game-like lessons around food [22–24]. However, negative feeding practices have also been reported, including one study where over half of the 72 educators who completed the study questionnaire encouraged or forced children to eat specific desirable food items, not letting children decide how much to eat, using desserts as a reward for eating, and offering only foods they believe children like [25]. Other frequent negative feeding practices observed included not allowing children to feed themselves [22,23,26], encouraging children to finish their plate and reprimanding children who did not eat all of their meal [25,27,28].
Educators may be unaware of the role they can play in helping children become more physically active, and may unknowingly contribute to sedentary behaviours [29]. Educators in 96 childcare centres were observed using few prompts for physical activity and frequently withholding physical activities as punishment for bad behaviour [30]. Another qualitative study among 87 educators of 4- to 6-year-old children found that educators perceived preschoolers as sufficiently active and reported that children need to learn to sit still in order to prepare them for primary school [31].
The present review aims to identify if childcare educators’ practices predict or are associated with preschoolers’ physical activity and eating behaviours in childcare centers and to assess the effectiveness of interventions that control educators’ practices or behaviours in order to improve preschoolers’ physical activity and eating behaviours.
Methods
Protocol and registration
The protocol for this review was published elsewhere [32] and describes the methodology used according to the Preferred Reporting Items for Systematic Reviews and Meta-Analyses (PRISMA) recommendations
[33]. This review was also registered with the International prospective register of systematic reviews (PROSPERO) record CRD42014012973.
Overview of methods
Six electronic databases were searched: PubMed, The Cochrane Library, Science Direct, SportDiscus, CINAHL, and Wiley. The search strategy, including keywords and choice of databases, was developed in collaboration with an experienced librarian. Keywords, including physical activity, eating behaviour, obesity, childcare educator, and childcare centre, as well as their MeSH (medical subject heading) equivalents were used in various combinations and adapted to each database searched. Reference lists of eligible studies or of systematic reviews and meta-analyses were reviewed to ensure that all potentially eligible studies were retrieved. Eligible studies were peer-reviewed and original studies, published in either English or French, whose participants were preschoolers who received formal childcare by a non-relative. All types of quantitative study designs were eligible for this review, as to include all possible studies relating to the research topic. Also, included studies had to assess the unique contribution of childcare educators’ practices or behaviours, on children’s physical activity or eating behaviours. Therefore, multicomponent interventions, such as those which involved parents, modifications to the built environment or to policies, etc., or for which the study results could not be explained solely by the educators’ practices or behaviours (e.g. the intervention was delivered in collaboration with nutrition or physical activity specialists, or no information was provided as to how physical activity sessions were delivered by educators), were excluded from this review. No publication date restrictions were used in any of the databases, and the search was completed in June 2015.
Once duplicates were removed, titles and abstracts were assessed independently by two authors (SW and MB), who then checked each other’s references. The full texts of potentially eligible studies were retrieved and assessed against inclusion criteria by the first author (SW). A second review of the potentially eligible studies was then conducted by one of the three other authors (MB, DD and NC), who each reviewed one
third of the articles. The first author extracted data from all articles, while the second, third and fourth authors each independently extracted data from one third of all included publications. Agreement between authors as to which study should be included in the review was high (95.2% agreement; kappa = 0.818; p<0.001) and disagreements were resolved through discussion among authors. The methodological quality of all the included studies was assessed by the first author using the Quality Assessment Tool for Quantitative Studies, developed by the Effective Public Health Practice Project (EPHPP) [34]. This tool was chosen because of its ability to assess the quality of various quantitative studyies designs relating to public health topics, and assesses the quality of the studies using six criteria: 1) selection bias, 2) study design, 3) confounders, 4) blinding, 5) data collection, and 6) withdrawals and dropouts [34]. Using the same method, the second, third and fourth authors each checked one third of the publications for completeness and accuracy of the quality assessment. Agreement between authors on the six items scored during the quality assessment was 100% (kappa= 1.0; p<0.001).
Because of the heterogeneity of the study designs, outcomes, methods and measurement tools, meta-analyses were not feasible. Therefore, a systematic descriptive narrative synthesis was carried out. When study results were not expressed numerically, values were extracted from available figures. In order to draw overall conclusions a rating system of levels of evidence was used [35,36]. Strength of evidence was based on the study design, methodology assessment and consistency of results, and were determined as follows [36]: 1) strong evidence: at least two RCTs of high quality showing consistent results; 2) moderate evidence: at least one RCT of high quality, and at least one RCT of moderate or low quality or one quasi-experimental trial of high quality with consistent results; 3) weak evidence: only one RCT of high quality or multiple moderate to low-quality RCT, and quasi-experimental trials of high, moderate or low quality, all showing consistent results; and 4) insufficient evidence: only one low- or moderate-quality RCT or one high, moderate or low-quality quasi-experimental trial, or negative or contradictory outcomes of the studies. Results were considered to be consistent if at least two-thirds of the studies reported significant results in the same direction [35].
Results
Overall, 1342 studies emerged from the six search engines (PubMed, n=592; Cochrane Library, n=101; Wiley, n=322; CINAHL, n=217; SportDiscus, n=85; Science Direct, n=25) and 48 additional studies were added after reviewing the lists of references (Figure 1). After removing duplicates, reviewing titles and abstracts and applying selection criteria, 15 articles were retained for this review.
Methodological quality assessment of studies
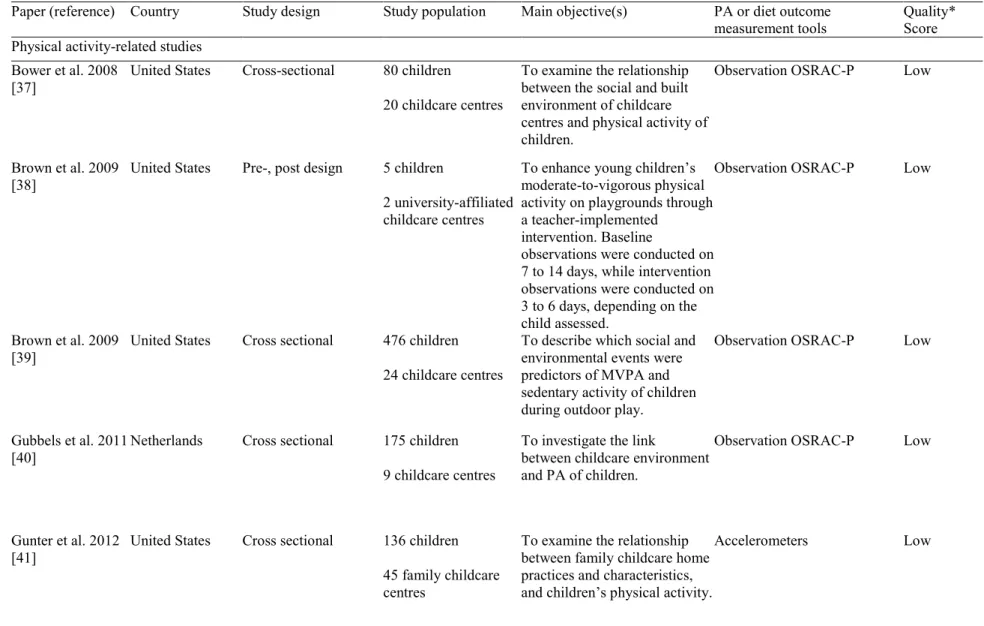
The quality score of each study assessed is presented in Table 1. Overall, eight studies (53%) were rated as being of low methodological quality. Of the 10 physical activity-related papers, five papers received low ratings [37–41], while the other five were assessed as moderate [42–46]. Among the five studies that focused on nutrition, three were scored as low [47–49], while two received moderate ratings [50,51]. The Regardless of study designs, the low scores were primarily caused by low ratings attributed to the potential for selection bias, due to a lack of representativeness of the target population or low response rates, and because the tools for primary outcome measures were not described as valid, or were not reported in the study or in a separate study.
Study characteristics
Of the 15 studies, 14 were conducted in the United States, and one was from the Netherlands [40]. Most were RCTs, clustered RCTs or quasi-experimental trials [42–46,48,50,51]; three were pre-post design studies [38,47,49]; and four were cross-sectional [37,39–41]. Eight of the fifteen studies had fewer than 100 participants [37,38,42,47–51], while six had between 101 and 500 participants [39–41,44–46], and only one had over 500 participants [43]. Participants were of low to middle socioeconomic status in four studies [42–44,47] and were primarily African American, Latino or Hispanic in six studies [42–46,48]. None of the remaining studies specified the ethnicity or socioeconomic status of the participating children. The number of childcare centres from which children were selected ranged from 1 to 45 centres.
Of the 15 studies included in this review, 10 focused solely on physical activity [37–46] and 5 focused uniquely on nutrition [47–51]. None evaluated the two. Publication dates of studies that focused solely on physical activity outcomes ranged from 2008 to 2013, while almost all of the nutrition-related papers (4/5) were published in 2000 or earlier.
Of the physical activity-related papers, six assessed the effectiveness of interventions that required educators to instruct lessons on gross motor skills, actively participate in children’s physical activities, and/or use various methods of encouraging children to be active (e.g. cueing children, giving performance feedback, giving pep talks) [38,42–46]. Four of these six papers [43–46] nevertheless assessed the same intervention amongst different populations and at different time points (8 weeks and 9 months), and amongst different sub-groups of the same target population, which was constituted of low to middle socioeconomic African American children. The remaining four physical activity-related papers assessed correlations between educators’ behaviours and children’s physical activity [37,39–41]. Educator behaviours included playing with children during play time, not restricting active play for children who misbehave, reading books or playing games with physical activity themes, initiating games and prompting children to be active.
The five nutrition-related papers assessed the effectiveness of educator practices during mealtime on children’s food intake [47–51]. Practices assessed included the use of non-food rewards, encouraging children to “try one bite”, choice offering (i.e. “Do you want any of this?”), silent and enthusiastic modelling, allowing children to self-select their food instead of serving pre-portioned foods, serving fruits and vegetables before other foods, and using positive verbal reinforcement.
All studies on physical activity assessed level of activity with objective measures, including accelerometers [41–46], and with direct observation by data collectors using the Observational System for Recording Physical Activity in Children - Preschoolers (OSRAC-P) [37–40]. In only one study were parents asked to complete a questionnaire related to their child’s sedentary behaviour [42]. Similarly to the physical activity
related studies, all studies on eating behaviours used objective methods to measure dietary intake - weighing or measuring plate waste [47–49] in three studies, and direct observation by data collectors [47,48,50,51] in four studies.
Relationship between educators’ practices and physical activity of children
Cross sectional studies:Of the four cross-sectional studies that assessed the relationship between educator behaviours and physical activity, two found that providing portable play equipment every day, playing with children, and positively prompting children to be active were associated with more involvement in physical activity [40,41]. Although p-values were not reported, another cross-sectional study found that educator behaviours that promote physical activity were positively correlated with children’s moderate-to-vigorous physical activity (MVPA) and total physical activity level, and inversely correlated with sedentary activity [37]. Other practices such as not restricting physical activity when children misbehave, and reading books or playing physical activity-themed games were not associated with children’s physical activity [41]. It was also found that during outdoor play, child initiated activities were associated with more MVPA intervals than educator initiated activities, and that children were less likely to be active when educators were around [39].
Experimental studies:
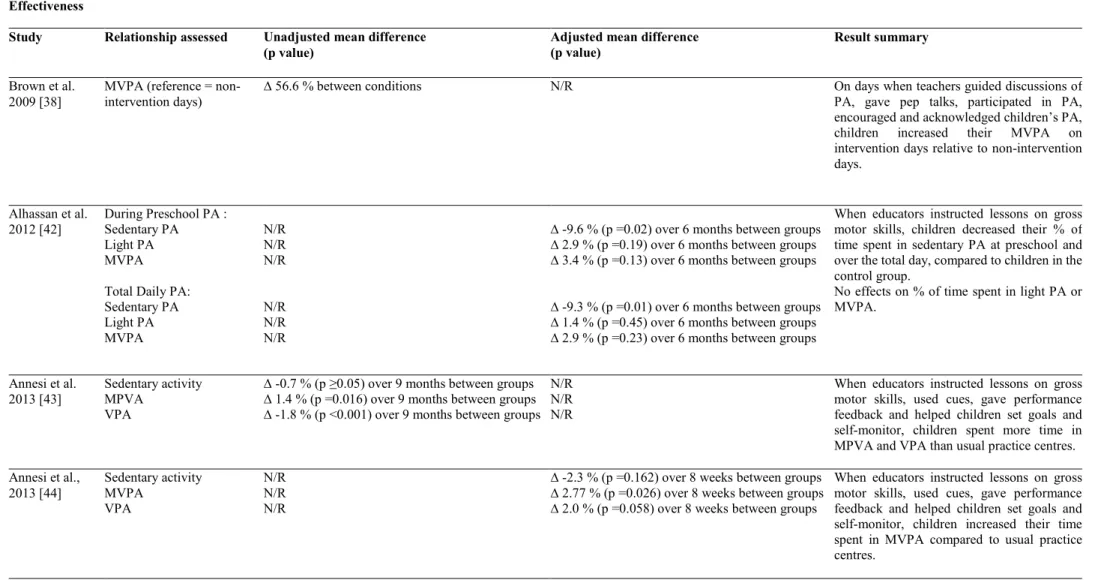
Of the six papers that assessed the effectiveness of educator-led interventions, five were of moderate quality, including one small clustered randomised controlled trial [42], as well as two large clustered randomised controlled trial [44,46] and three large quasi-experimental trials [43,45]. Four of these six studies assessed the effects of the same intervention in different samples. The sixth study was a small pre-post design study of low quality [38] (Table 2). Five of the six studies reported a positive effect on children’s MVPA [38,43–46]. The small study that did not find a positive effect on MVPA nevertheless reported a significant reduction in children’s sedentary time [42]. Three of four studies reported an increase
in vigorous physical activity (VPA) [43,45,46], and one of two reported a significant reduction in light physical activity (LPA) [45].
Strength of evidence was based on only three RCTs, and two quasi-experimental studies of moderate quality, one low quality pre-post study, and four low quality cross-sectional studies. Based on the strength of evidence evaluation, there is weak evidence that educators influence preschoolers’ physical activity and sedentary behaviours.
Relationship between educators’ practices and healthy eating behaviours of
children
All five of the included papers reported positive changes in children’s eating behaviours when educators used recommended meal-time practices. One small, moderate quality, quasi-experimental study found that children increased their intake of new foods (i.e. kiwi, sweet red pepper, chickpeas, and fresh coconut) when educators used non-food rewards [51], encouraged children to “try one bite” [51], and allowed children to self-select their food [51]. Although silent modelling was not shown to be effective in that study [51], another small, moderate quality, quasi-experimental study found that children’s intake and acceptance of food increased when educators modelled healthy eating enthusiastically [50]. However, this effect was no longer observed when peer modelling was taken into consideration [50]. Two small, low quality, pre-post design studies reported that children increased their intake of healthy snacks when educators allowed children to self-serve [47] and they increased their intake of vegetables when they gave immediate positive verbal reinforcement and giving a non-food reward [49]. Finally, one small, low quality, randomised crossover trial conducted primarily onamong African American children found that children they ate more fruits and vegetables when they were allowed to serve themselves (also referred to as a family-style meal service), rather than pre-portioned, or when fruits and vegetables were served in advance of other menu items during a family-style meal service [48].
Given that three of the five studies were RCTs or quasi-experimental trials of low (n=1) and moderate (n=2) quality, and that results were consistent among two of these and two low quality pre-post studies, there is weak evidence that educator practices positively influence preschoolers’ eating behaviours at this time.
Discussion
Our results suggest that educators may play a role in promoting healthy behaviours in children. However, the evidence for this is weak due to the dearth of high quality intervention studies. Given that specific practices or behaviours were heterogeneous, no single one was studied enough to draw conclusions. Further, more than half of the studies were of low quality and none was high. Also, Ssince most of the studies were conducted in the United States, the results may not be applicable in other high income countries, and probably not in low to middle income countries. Furthermore, the absence of cohort studies does not allow to draw conclusions on whether or not childcare educators’ practices predict preschoolers’ physical activity and eating behaviours in childcare centers. Nevertheless, almost all studies found that educators’ practices and behaviours are positively associated with children’s eating and physical activity behaviours. This is in line with the theory of observational learning, and highlights the potential for interventions to target childcare educators as role models for the promotion of healthy behaviours in preschoolers.
Physical activity
Of the six studies on physical activity interventions, five targeted primarily African Americans of low to middle socioeconomic status, and may therefore not be generalizable to other socioeconomic or ethnic groups. , and may therefore not be generalizable to other socioeconomic or ethnic groups. Firstly, disparities in childcare use between lower and higher socioeconomic groups, and minority ethnic groups have been documented. For example, studies have shown that children from low-income families tend to have low rates of childcare attendance [52,53], and that children of certain ethnic minority groups are less likely to use centre-based childcare [53–57]. Therefore, results from these studies may not accurately represent the lowest of low socioeconomic or ethnic minority children. Secondly, rResults from these studies may
overestimate the potential effect of the intervention in other populations because both of these demographic markers are associated with low levels of physical activity. It has been reported that Black children tend to be less active than Caucasian children [58–60], and that low socioeconomic status is associated with lower physical inactivitylevels [61,62]. Therefore these populations may have greater room for physical activity improvement. Nonetheless, it should be noted that, compared to children from high-income families, children from low-income families tend to have lower rates of childcare attendance [52,53], and that children of some ethnic minority groups are also less likely to attend childcare [53–57]. Therefore, results from the studies included in this review may not accurately represent children from the lowest of low socioeconomic groups. SimilarlyIn addition, although other research indicates that girls are generally less active than boys [63], but gender was not included in the analyses of these studies. , and may therefore not be generalizable to other socioeconomic or ethnic groups. Firstly, disparities in childcare use between lower and higher socioeconomic groups, and minority ethnic groups have been documented. For example, studies have shown that children from low-income families tend to have low rates of childcare attendance [52,53], and that children of certain ethnic minority groups are less likely to use centre-based childcare [53–57]. Therefore, results from these studies may not accurately represent the lowest of low socioeconomic or ethnic minority children. Secondly,
Four studies that assessed the effectiveness of the Start for Life obesity prevention trial reported no significant changes in sedentary time, despite observing increases in MVPA and VPA [43–46]. This may be related to the timing of the physical activity intervention. Childcare programs for preschoolers typically include scheduled physical (i.e. free play) and non-physical activities (i.e. reading circles, crafts, puzzles) [64]. It is possible that these interventions are implemented at times when physical activities are already scheduled, so that the allocation of sedentary time remains unchanged while the intensity of the physical activity increases. Nevertheless, an increase in physical activity intensity is associated with health benefits [65].
Three of the four cross-sectional studies found some positive associations between physical activity promoting practices and children’s physical activity levels [37,40,41]. Although active role modelling by adults is encouraged [66], the presence of educators may limit children’s physical activity [39]. As suggested previously, this may be especially true for girls, who particularly enjoy being close to their educators [67]. Since educators are often inactive when they supervise, this may lead children, and especially girls, to be inactive [67]. Findings from this review suggest that there may lay a thin line between educators being over-involved and under-involved in physical activity promotion. It is possible that children who are generally less interested in being active could benefit more from educator-arranged activities and adult participation in physical activities, than children who are naturally very active, and for whom the presence and interaction of educators may act as a constraint. This could explain why certain interventions that focus on educator-led activities do not have a positive effect on children’s percentage of time spent in physical activity [42]. Future studies should examine how specific educator practices impact active and less active children, as well as boys and girls differentially.
Healthy eating behaviours
Most nutrition-related studies, in addition to being small, were carried out more than 14 years ago. Since children’s diet and food environments have changed considerably in the last decades [68–74], the studies may not be applicable today. Furthermore, most studies measured children’s eating behaviours by direct observation which can be highly subjective and can . Also, this method lacks precision at the individual level [75]. New, more reliable methods of assessment of children’s food intake have since evolved been used [76]. It is also important to notenoteworthy that only one of these studies specified the socioeconomic status of the sample (middle SES) [47] and one , while another reported the ethnicity of the children (African American) [48]. This type of information is important to assess the generalisability of these interventionsfindings, as low socioeconomic status and certain minority ethnicities have been linked to poor diets of poorer quality [77,78].
In accordance with the theory of observational learning [14], significant relationships between educators’ positive meal-time practices and children’s eating behaviours were found in all five nutrition-related studies. Results from two quasi-experimental studies found that silent modelling from educators may not be enough to increase children’s intake or acceptance of foods [50,51]. A subsequent study found that when educators practiced enthusiastic modelling, children increased their acceptance of new foods but that this effect lost significance when peer modelling was taken into account [50]. Using rewards, encouraging children to “try one bite” or offering children the choice of tasting a food were more effective in encouraging children to taste that food compared to silent modelling [51]. However, using rewards to encourage children to eat has been debated, because the effect may not last longer than the offer of the reward [79,80]. Despite these findings, it has been suggested that verbal rewards are better than tangible rewards, and that rewards should be given according to the quality of the behaviour rather than the quantity of the behaviour [81].
Letting children serve themselves was found to be conducive to increasing fruit and vegetable intake in one study [48]. This practice is based on the notion that young children have the ability to self-regulate their food intake based on the energy density of the foods consumed and their energy needs [82], and that restrictive feeding methods (e.g. pre-portioning meals) may diminish children’s self-regulation abilities [83]. Furthermore, since it has been documented that children with higher adiposity show less self-regulation than children with lower adiposity [83], it may be important to promote self-self-regulation.
Gaps in the evidence
Interventions promoting physical activity in childcare centres included in this review focused largely on a homogenous population – African-Americans of low socioeconomic status, thus limiting the reachpotential generalisability of these interventions to children of other socioeconomic and ethnic groups. While this is a group at risk of not achieving recommended levels of physical activity [58–60], further evidence related to other sectorssegments of the population is required as the level of physical activity can vary by gender, culture and other population attributes [84]. Similarly, research into interventions to improve the eating
behaviours of preschoolers lack consideration of demographic differences between groups [85]. In addition to differences in childcare use, health disparities also exist among socioeconomic and ethnic groups [86]. Consequently, determining best practices to use to improve healthy eating and physical activity interventions in childcare centres may inadvertently perpetuate health inequalities between socioeconomic and ethnic groups. Therefore, although childcare centres may be a great place to promote healthy behaviours in a large proportion of the population, one should also consider intervening in places that will help reach marginalized groups, such as people of low socioeconomic status and ethnic minority.
As most of the studies relating to nutrition in this review date from 2000 and earlier, there is a need to reassess the interventions in today’s changed environment and with modern more reliable measures. Further, since children are highly influenced by other individuals who are similar to them (i.e. peers) [14], it might also be useful to assess how peers’ eating behaviours (e.g. picky eaters or overeaters) impact other children’s food intake.
Health-related behaviours learned in childhood are likely to persist into adolescence and adulthood [87,88], but the contribution of educators’ practices on this persistence is undocumented. Longitudinal studies are required to assess contributions of children’s different environments on their later eating and physical activity behaviours. Further, although childcare centres may represent an excellent setting to promote healthy behaviours in a large proportion of the population, program planners should also consider intervening in places that will help reach marginalized groups, such as people of low socioeconomic status and ethnic minority, which may be underrepresented in childcare settings (REFERENCES 52-57). Ignoring this may inadvertently contribute to widening the already apparent health disparities existing among socioeconomic and ethnic groups [86].
Methodology quality
Limitations relating to the lack of representativeness of the target population and lack of reporting of response rates were common across most studies, regardless of their design. The latter is common in
epidemiological studies, where it has been reported that a substantial number of peer-reviewed studies do not provide information on study participation [89]. Information was also lacking on the randomization procedures, and whether outcome assessors and/or participants were blinded. Although blinding reduces the risk for information bias, it has been reported that many studies do not properly report their blinding efforts, therefore reducing the readers’ ability to judge its effect on bias reduction [90]. Another limitation was the lack of reporting of the validity of outcome measurement tools. Ten of the fifteen studies (67%) did not report whether the data collection tools were valid, including all of the nutrition-related outcome measures. It has been said that the use of valid tools to measure physical activity and diet is problematic in epidemiological studies [91,92], as these are often costly and impractical on a population basis [92].
Strengths of this review included the detailed systematic approach for searching articles, the use of validated tools for assessing methodology quality, and not restricting the publication period. Some limitations nevertheless must be acknowledged. The heterogeneity in the study designs, outcomes, methods and measurement tools, made comparisons difficult; therefore data were narratively synthesized and described. There is also a risk of reporting bias since the review involved the judgments of the authors. However, this limitation was mitigated by having two independent assessors at every stage of the review.
Conclusion
This review provides a systematic summary of empirical studies that have examined the relationship between childcare educators’ practices and children’s eating and physical activity behaviours. It appears that educators may play a role in promoting healthy behaviours among preschoolers in childcare centres. However, because of the lack of high quality intervention studiesbody of evidence and the low quality of the existing studies, the influence of specific practices on children’s healthy eating and physical activity behaviours remains inconclusive. This lack of evidence is a barrier to providing evidence-based best practices for educators to use in childcare centres.
Future research should look at filling the gaps identified in this review by assessing previously-studied practices of educators on larger, more diverse populations and conducting analyses on subgroups of children, for instance according to gender, activity level and body weight, and assessing the effectiveness of other recommended practices, such as including physical activity in time periods typically devoted to sedentary activities (e.g. reading circles), involving children in the preparation of food or having frequent informal discussions regarding food. The methodological quality of studies should also be improved by ensuring representativeness, reporting on the blinding of outcome assessors, conducting or increasing the length of follow-ups, using valid, reliable and objective measurement tools, as well as ensuring that the validity and reliability of these tools are reported.
Conflict of interest statement
The authors declare no conflicts of interest.
Acknowledgements
SW was supported by a Canadian Institutes of Health Research Charles Best Canada Graduate Scholarships Doctoral Award and by the Gérard-Eugène-Plante Doctoral Scholarship. The funders did not play a role in the design of the study, the writing of the manuscript or the decision to submit it for publication.
References
1. De Onis M, Blossner M, Borghi E. Global prevalence and trends of overweight and obesity
among preschool children. Am J Clin Nutr 2010; 92:1257–1264.
2. Quattrin T, Liu E, Shaw N, Shine B, Chiang E. Obese children who are referred to the pediatric
endocrinologist: characteristics and outcome. Pediatrics 2005; 115:348–351.
3. Guo S, Huang C, Maynard L, et al. Body mass index during childhood, adolescence and young
adulthood in relation to adult overweight and adiposity: the Fels longitudinal study. Int J Obes
Relat Metab Disord 2000; 24:1628–1635.
4. Freedman D, Dietz W, Srinivasan S, Berenson G. The relation of overweight to cardiovascular
risk factors among children and adolescents: the Bogalusa Heart Study. Pediatrics 1999;
103:1175–1182.
5. Park M, Falconer C, Viner R, Kinra S. The impact of childhood obesity on morbidity and
mortality in adulthood: a systematic review. Obes Rev 2012; 13:985–1000.
6. Reilly J, Kelly J. Long-term impact of overweight and obesity in childhood and adolescence
on morbidity and premature mortality in adulthood: systematic review. Int J Obes 2011;
35:891–898.
7. Friedemann C, Heneghan C, Mahtani K, Thompson M, Perera R, Ward A. Cardiovascular
disease risk in healthy children and its association with body mass index: systematic review
and meta-analysis. BMJ 2012; 345:E4759–E4775.
8. Institute of Medicine, Committee on Prevention of Obesity in Children and Youth. Extent and
consequences of childhood obesity. In: Koplan J, Liverman C, Kraak V (eds). Preventing
childhood obesity: health in the balance. Library of Congress Cataloging-in-Publication Data:
Washington, 2005, pp. 54–58.
9. Centers for Disease Control and Prevention. (2013) Overweight and obesity; childhood
overweight and obesity, contributing factors [WWW document]. URL
http://www.cdc.gov/obesity/childhood/problem.html
10. Organisation for economic co-operation and development. (2013) PF3.2 Enrolment in
childcare and pre-schools [WWW document]. URL
http://www.oecd.org/els/soc/PF3_2_Enrolment_in_childcare_and_preschools.pdf
11. Eunice Kennedy Shriver National Institute of Child Health and Human Development, NIH,
DHHS. The NICHD Study of Early Child Care and Youth Development (SECCYD): Findings
12. Sinha M. (2014) Spotlight on Canadians: Results from the General Social Survey: Child care
in Canada [WWW document]. URL
http://www.statcan.gc.ca/pub/89-652-x/89-652-x2014005-eng.pdf
13. European Commission. (2009) The provision of childcare services: a comparative review of
30 European countries [WWW document] URL
http://ec.europa.eu/social/main.jsp?langId=en&catId=89&newsId=545&
14. Bandura A. Social learning theory. Prentice Hall: Englewood Cliffs, NJ, 1977.
15. Nicklas T, Baranowski T, Baranowski J, Cullen K, Rittenberry L, Olvera N. Family and
child-care provider influences on preschool children’s fruit, juice and vegetable consumption. Nutr
Rev 2001; 59:224–235.
16. Larson N, Ward D, Neelon S, Story M. What role can child-care settings play in obesity
prevention? A review of the evidence and call for research efforts. J Am Diet Assoc 2011;
111:1343–1362.
17. Mikkelsen M, Husby S, Skov L, Perez-Cueto F. A systematic review of types of healthy eating
interventions in preschools. Nutr J 2014; 13:56–64.
18. Temple M, Robinson J. A systematic review of interventions to promote physical activity in
the preschool setting. J Spec Pediatr Nurs 2014; 19:274-284.
19. Benjamin Neelon SE, Briley ME, American Dietetic Association. Position of the American
Dietetic Association: benchmarks for nutrition in child care. J Am Diet Assoc 2011; 111:607–
615.
20. American Academy of Pediatrics, American Public Health Association, National Resource
Center for Health and Safety in Child Care. Caring for our children: National health and
safety performance standards: guildelines for early care and education programs. 3
rdedn.
Elk Grove Village, IL; Academy of Pediatrics: Washington, 2011.
21. Centers for Disease Control and Prevention. Guidelines for school and community programs
to promote lifelong physical activity among young people. MMWR Recomm Rep 1997; 46:1–
36.
22. Sigman-Grant M, Christiansen E, Branen L, Fletcher J, Johnson S. About feeding children:
mealtimes in child-care centers in four Western states. J Am Diet Assoc 2008; 108:340–346.
23. Trost S, Messner L, Fitzgerald K, Roths B. Nutrition and physical activity policies and
practices in family child care homes. Am J Prev Med 2009; 37:537–540.
24. Lumeng J, Kaplan-Sanoff M, Shuman S, Kannan S. Head Start teachers’ perceptions of
children’s eating behavior and weight status in the context of food scarcity. J Nutr Educ Behav
2008; 40:237–243.
25. Freedman M, Alvarez K. Early childhood feeding: assessing knowledge, attitude, and
practices of multi-ethnic child-care providers. J Am Diet Assoc 2010; 110:447–451.
26. Nahikian-Nelms M. Influencial factors of caregiver behavior at mealtime. J Am Diet Assoc
1997; 97:505–509.
27. Gable S, Lutz S. Nutrition socialization experiences of children in the Head Start program. J
Am Diet Assoc 2001; 101:572–577.
28. Ramsay S, Branen L, Fletcher J, Price E, Johnson S, Sigman-Grant M. “Are you done?” Child
care providers’ verbal communication at mealtimes that reinforce or hinder children's internal
cues of hunger and satiation. J Nutr Educ Behav 2010; 42:265–270.
29. Copeland KA, Kendeigh CA, Saelens BE, Kalkwarf HJ, Sherman SN. Physical activity in
child-care centers: do teachers hold the key to the playground? Health Educ Res 2012; 27:81–
100.
30. McWilliams C, Ball S, Benjamin S, Hales D, Vaughn A, Ward D. Best-practice guidelines for
physical activity at child care. Pediatrics 2009; 124:1650–1659.
31. De Craemer M, De Decker E, De Bourdeaudhuij I, et al. Physical activity and beverage
consumption in preschoolers: focus groups with parents and teachers. BMC Public Health
2013; 13:278–290.
32. Ward S, Bélanger M, Donovan D, Horsman A, Carrier N. Correlates, determinants, and
effectiveness of childcare educators’ practices and behaviours on preschoolers’ physical
activity and eating behaviours: a systematic review protocol. Syst Rev 2015; 4:18–23.
33. Moher D, Liberati A, Tetzlaff J, Altman D. Preferred reporting items for systematic reviews
and meta-analyses: The PRISMA statement. BMJ 2009; 339:B2535.
34. National Collaboration Center for Methods and Tools. (2008) Quality Assessment Tool for
Quantitative Studies. [WWW document]. URL
http://www.nccmt.ca/registry/view/eng/14.html
35. Van Sluijs E, McMinn A, Griffin S. Effectiveness of interventions to promote physical activity
in children and adolescents: systematic review of controlled trials. Br Med J. 2007; 335:703–
715.
36. Van Sluijs E, van Poppel M, van Mechelen W. Stage-based lifestyle interventions in primary
care: are they effective? Am J Prev Med. 2004; 26:330–343.
37. Bower J, Hales D, Tate D, Rubin D, Benjamin S, Ward D. The childcare environment and
children’s physical activity. Am J Prev Med 2008; 34:23–29.
38. Brown W, Googe H, McIver K, Rathel J. Effects of teacher-encouraged physical activity on
preschool playgrounds. J Early Interv 2009; 31:126–145.
39. Brown W, Pfeiffer K, Mciver K, Dowda M, Addy C, Pate R. Social and environmental factors
associated with preschoolers’ non-sedentary physical activity. Child Dev 2009; 80:45–58.
40. Gubbels J, Kremers S, van Kann D, et al. Interaction between physical environment, social
environment, and child characteristics in determining physical activity at child care. Heal
Psychol 2011; 30:84–90.
41. Gunter KB, Rice KR, Ward DS, Trost SG. Factors associated with physical activity in children
attending family child care homes. Prev Med 2012; 54:131–133.
42. Alhassan S, Nwaokelemeh O, Ghazarian M, Roberts J, Mendoza A, Shitole S. Effects of
locomotor skill program on minority preschoolers’ physical activity levels. Pediatr Exerc Sci
2012; 24:435–449.
43. Annesi J, Smith A, Tennant G. Effects of a cognitive-behaviorally based physical activity
treatment for 4- and 5-year-old children attending US preschools. Int J Behav Med 2013;
20:562–566.
44. Annesi J, Smith A, Tennant G. Effects of the Start For Life treatment on physical activity in
primarily African American preschool children of ages 3-5 years. Psychol Heal Med 2013;
18:300–309.
45. Annesi J, Smith A, Tennant G. Reducing high BMI in African American preschoolers: effects
of a behavior-based physical activity intervention on caloric expenditure. South Med J 2013;
106:456–459.
46. Annesi J, Smith A, Tennant G. Cognitive-behavioural physical activity treatment in
African-American pre-schoolers: effects of age, sex, and BMI. J Paediatr Child Health 2013;
49:E128–132.
47. Branen L, Fletcher J. Effects of restrictive and self-selected feeding on preschool children’s
food intake and waste at snacktime. J Nutr Educ 1994; 26:273–277.
48. Harnack L, Oakes J, French S, Rydell S, Farah F, Taylor G. Results from an experimental trial
at a Head Start center to evaluate two meal service approaches to increase fruit and vegetable
intake of preschool aged children. Int J Behav Nutr Phys Act 2012; 9:51–58.
49. Ireton C, Guthrie H. Modification of vegetable-eating behavior in preschool children. J Nutr
Educ 1972; 4:100–103.
50. Hendy HM, Raudenbush B. Effectiveness of teacher modeling to encourage food acceptance
in preschool children. Appetite 2000; 34:61–76.
51. Hendy H. Comparison of five teacher actions to encourage children’s new food acceptance.
Ann Behav Med 1999; 21:20–26.
52. Tang S, Coley RL, Votruba-Drzal E. Low-income families’ selection of child care for their
young children. Child Youth Serv Rev 2012; 34:2002–2011.
53. Zachrisson H, Janson H, Nærde A. Predicting early center care utilization in the context of
universal access. Early Child Res Q 2013; 28:74–82.
54. Vandenbroeck M, De Visscher S, Van Nuffel K, Ferla J. Mothers’ search for infant child
care: The dynamic relationship between availability and desirability in a continental
European welfare state. Early Child Res Q 2008; 23:245–258.
55. Fuller B, Holloway S, Liang X. Family selection of child-Care centers: The influence of
household support, ethnicity, and parental practices. Child Dev 1996; 67:3320–3337.
56. Liang X, Fuller B, Singer J. Ethnic differences in child care selection: The influence of
family structure, parental practices, and home language. Early Child Res Q 2000; 15:357–
384.
57. Radey M, Brewster K. The influence of race/ethnicity on disadvantaged mother’s child care
arrangements. Early Child Res Q 2007; 22:379–393.
58. Eyre ELJ, Duncan MJ. The impact of ethnicity on objectively measured physical activity in
children. ISRN Obes 2013; 2013:1-15.
59. Kristjansdottir G, Vihjalmsson R. Sociodemographic differences in patterns of sedentary and
physically active behavior in older children and adolescents. Acta Paediatr 2001; 90:429–435.
60. McVeigh J, Norris S, de Wet T. The relationship between socioeconomic status and physical
activity patterns in South African children. Acta Paediatr 2004; 93:982–988.
61. Lämmle L, Worth A, Bös K. Socio-demographic correlates of physical activity and physical
fitness in German children and adolescents. Eur J Public Health 2012; 22:880–884.
62. Drenowatz C, Eisenmann JC, Pfeiffer KA, et al. Influence of socio-economic status on
habitual physical activity and sedentary behavior in 8- to 11-year old children. BMC Public
Health 2010; 10:214-224.
63. Vale S, Silva P, Santos R, Soares-Miranda L, Mota J. Compliance with physical activity
guidelines in preschool children. J Sports Sci 2010; 28:603-608.
64. Bredekamp S, Copple C (eds). Developmentally appropriate practice in early childhood
programs. 3rd edn. National Association for the Education of Young Children: Washington,
65. Warburton D, Nicol C, Bredin S. Health benefits of physical activity: the evidence. CAMJ
2006; 17:801–809.
66. Canadian Sport for Life. (2011) Helping children play – The adult role [WWW document].
URL
http://canadiansportforlife.ca/active-start/helping-children-play-%E2%80%93-adult-role-2
67. Cardon G, Cauwenberghe E, Labarque V, Haerens L, De Bourdeaudhuij I. The contribution of
preschool playground factors in explaining children’s physical activity during recess. Int J
Behav Nutr Phys Act 2008; 5:11–16.
68. Slining M, Mathias K, Popkin B. Trends in food and beverage sources among US children and
adolescents: 1989-2010. J Acad Nutr Diet 2013; 113:1683–1694.
69. Piernas C, Popkin B. Food portion patterns and trends among U.S. children and the relationship
to total eating. J Nutr 2011; 141:1159–1164.
70. Piernas C, Popkin B. Increased portion sizes from energy-dense foods affect total energy intake
at eating occasions in US children and adolescents : patterns and trends by age group and
sociodemographic characteristics. Am J Clin Nutr 2011; 94:1324–1332.
71. Harris J, Schwartz M, Munsell C, et al. (2013) Fast food FACTS 2013: Measuring progress in
nutrition and marketing to children and teens [WWW document]. URL
http://www.fastfoodmarketing.org/media/FastFoodFACTS_report.pdf
72. Powell L, Szczypka G, Chaloupka F. Trends in exposure to television food advertisements
among children and adolescents in the United States. Arch Pediatr Adolesc Med 2010;
164:794–802.
73. Guthrie J, Lin B, Frazao E. Role of food prepared away from home in the American diet,
1977-78 versus 1994-96: changes and consequences. J Nutr Educ Behav 2002; 34:140–150.
74. Adair L, Popkin B. Are child eating patterns being transformed globally? Obes Res 2005;
13:1281–1299.
75. Australasian Child & Adolescent Obesity Research Network. (2010) Dietary intake assessment
-
Direct Observation [WWW document]. URL
http://www.acaorn.org.au/streams/nutrition/assessment-methods/direct-observation.php
76. Long JD, Littlefield LA, Estep G, et al. Evidence review of technology and dietary assessment.
Worldviews Evid Based Nurs 2010; 7:191–204.
77. Drewnowski A, Specter S. Poverty and obesity : the role of energy density and energy costs.
78. Darmon N, Drewnowski A. Does social class predict diet quality? Am J Clin Nutr 2008;
87:1107–1117.
79. Lepper M, Greene D, Nisbett R. Undermining children’s intrinsic interest with extrinsic
reward: A test of the “overjustification” hypothesis. J Pers Soc Psychol 1973; 28:129–137.
80. Dickinson AM. The detrimental effects of extrinsic reinforcement on “Intrinsic motivation”.
Behav Anal 1989; 12:1–15.
81. Eisenberger R, Cameron J. Detrimental effects of reward: Reality or myth? Am Psychol 1996;
51:1153–1166.
82. Birch LL, Deysher M. Caloric compensation and sensory specific satiety: evidence for self
regulation of food intake by young children. Appetite 1986; 7:323–331.
83. Johnson S, Birch L, McPhee L. Parents’ and children's adiposity and eating style. Pediatrics
1994; 94:653–661.
84. Hinkley T, Crawford D, Salmon J, Okely A, Hesketh K. Preschool children and physical
activity: a review of correlates. Am J Prev Med 2008;34:435-441.
85. Lorson B, Melgar-Quinonez H, Taylor C. Correlates of fruit and vegetable intakes in US
children. J Am Diet Assoc 2009; 109:474–478.
86. Meyer P, Penman-Aguilar A, Campbell VA, et al. Conclusion and future directions: CDC
Health Disparities and Inequalities Report - United States, 2013. MMWR Surveill Summ
2013; 62:184–186.
87. Telama R, Yang X, Leskinen E, et al. Tracking of physical activity from early childhood
through youth into adulthood. Med Sci Sports Exerc 2014; 46:955–962.
88. Mikkla V, Rasanene L, Raitakari O, et al. Consistent dietary patterns identified from childhood
to adulthood: the cardiovascular risk in Young Finns Study. Br Jounral Nutr 2005; 93:923–
931.
89. Morton L, Cahill J, Hartge P. Reporting participation in epidemiologic studies: a survey of
practice. Am J Epidemiol 2006; 163:197–203.
90. Schulz K, Grimes D. Blinding in randomised trials: hiding who got what. Epidemiol Ser 2002;
359:696–700.
91. Livingstone M, Robson P, Wallace J. Issues in dietary intake assessment of children and
adolescents. Br J Nutr 2007; 92:S213–222.
92. Laporte R, Montoye H, Caspersen C. Assessment of physical activity in epidemiologic
research : Problems and prospects. Public Heal Rep 1985; 100:131–146.
Table and figure legends
Figure 1: PRISMA flow diagram of study selection process Table 1: Characteristics of included studies
Table 1 Characteristics of included studies
Paper (reference) Country Study design Study population Main objective(s) PA or diet outcome
measurement tools Quality* Score Physical activity-related studies
Bower et al. 2008
[37] United States Cross-sectional 80 children 20 childcare centres
To examine the relationship between the social and built environment of childcare centres and physical activity of children.
Observation OSRAC-P Low
Brown et al. 2009
[38] United States Pre-, post design 5 children
2 university-affiliated childcare centres
To enhance young children’s moderate-to-vigorous physical activity on playgrounds through a teacher-implemented
intervention. Baseline
observations were conducted on 7 to 14 days, while intervention observations were conducted on 3 to 6 days, depending on the child assessed.
Observation OSRAC-P Low
Brown et al. 2009
[39] United States Cross sectional 476 children 24 childcare centres
To describe which social and environmental events were predictors of MVPA and sedentary activity of children during outdoor play.
Observation OSRAC-P Low
Gubbels et al. 2011
[40] Netherlands Cross sectional 175 children 9 childcare centres
To investigate the link between childcare environment and PA of children.
Observation OSRAC-P Low
Gunter et al. 2012
[41] United States Cross sectional 136 children 45 family childcare centres
To examine the relationship between family childcare home practices and characteristics, and children’s physical activity.
Alhassan et al.
2012 [42] United States Clustered RCT 71 children Low SES; primarily Latino/Hispanic and African American 2 childcare centres
To examine the effect of a classroom, teacher-taught, locomotor skill-based PA program on the locomotor skills and physical activity levels of minority preschoolers. Data were collected at baseline and 6 months after the initiation of the intervention.
Accelerometers Parent questionnaire
Moderate
Annesi et al. 2013
[43] United States Quasi-experimental 885 children Low to middle SES, primarily African American 98 childcare classrooms
To assess the effect of the 9-month Start for Life trial on 4 to 5 year old African American preschoolers’ PA and BMI. Data were collected at months 1, 5 and 9 after the initiation of the intervention.
Accelerometers Moderate
Annesi et al., 2013
[44] United States Clustered RCT 338 children Low to middle SES, primarily African American
7 childcare centres; 19 classes
To assess the effect of the Start for Life obesity prevention trial on 3 to 5 year old African American preschoolers’ PA and BMI.
Data were collected at baseline and 8 weeks after the initiation of the intervention.
Accelerometers Moderate
Annesi et al. 2013
[45] United States Quasi-experimental 273 children African American children
17 childcare classrooms
To assess the effect of the 9-month Start for Life trial on 4 to 5 year old African American preschoolers’ PA and BMI. Data were collected at baseline and 9 months after the initiation of the intervention.
Annesi et al. 2013
[46] United States Clustered RCT 275 children African American children
32 childcare classrooms
To assess the effect of the Start for Life obesity prevention trial on African American
preschoolers’ PA and BMI. Data were collected at baseline and 8 weeks after the initiation of the intervention.
Accelerometers Moderate
Nutrition-related studies Branen & Fletcher,
1994 [47] United States Pre-, post design with age-group comparison 40 children Middle SES 1 childcare centre
To compare food intake and waste of 3 and 4 year old children at snack time when educators give one standard portion of a snack and when children are allowed to self-select the amount. Educators gave standard portions of snacks for 29 days. Children were allowed to self-select the portion for 25 days.
Observation Plate waste
Low
Harnack et al. 2012
[48] United States RCT with crossover 53 children Primarily African American 1 childcare centre
To evaluate the effects of serving fruits and vegetables first, serving meals portioned and plated by educators on children’s intake of fruits and vegetables. The provider portioned, fruits and vegetables first, and control conditions were each evaluated on two randomly chosen weeks, for a total study length of six weeks.
Observation
Waste measurements with household measuring tools
Ireton & Guthrie
1972 [49] United States Pre-, post design 19 children 1 childcare centre
To measure the effectiveness of varying preparation methods and using tokens as a reward on children’s consumption of cooked vegetables. Each experimental periods lasted three weeks
Weighed plate waste Low
Hendy &
Raudenbush 2000 [50]
United States Quasi-experimental 97 children To compare acceptance of four familiar foods by
preschool children across three lunches, with foods presented under either silent teacher modelling or simple exposure.
Observation Moderate
Hendy 1999 [51] United States Quasi-experimental 64 children
19 childcare centres
To compare the effectiveness of adult mealtime actions to encourage children’s acceptance of novel foods across three consecutive days.
Observation Moderate
* Quality score based on the Quality Assessment Tool for Quantitative Studies
RCT : randomized controlled trial; SES : socioeconomic status; PA: physical activity; BMI: Body mass index; OSRAC-P: Observational System for Recording Activity of Children – Preschool version; MVPA: moderate-to-vigorous physical activity.
Table 2 Summary of study results PHYSICAL ACTIVITY
Effectiveness
Study Relationship assessed Unadjusted mean difference
(p value) Adjusted mean difference (p value) Result summary
Brown et al.
2009 [38] MVPA (reference = non-intervention days) ∆ 56.6 % between conditions N/R On days when teachers guided discussions of PA, gave pep talks, participated in PA, encouraged and acknowledged children’s PA, children increased their MVPA on intervention days relative to non-intervention days.
Alhassan et al.
2012 [42] During Preschool PA : Sedentary PA Light PA
MVPA Total Daily PA: Sedentary PA Light PA MVPA N/R N/R N/R N/R N/R N/R
∆ -9.6 % (p =0.02) over 6 months between groups ∆ 2.9 % (p =0.19) over 6 months between groups ∆ 3.4 % (p =0.13) over 6 months between groups ∆ -9.3 % (p =0.01) over 6 months between groups ∆ 1.4 % (p =0.45) over 6 months between groups ∆ 2.9 % (p =0.23) over 6 months between groups
When educators instructed lessons on gross motor skills, children decreased their % of time spent in sedentary PA at preschool and over the total day, compared to children in the control group.
No effects on % of time spent in light PA or MVPA.
Annesi et al.
2013 [43] Sedentary activity MPVA VPA
∆ -0.7 % (p ≥0.05) over 9 months between groups ∆ 1.4 % (p =0.016) over 9 months between groups ∆ -1.8 % (p <0.001) over 9 months between groups
N/R N/R N/R
When educators instructed lessons on gross motor skills, used cues, gave performance feedback and helped children set goals and self-monitor, children spent more time in MPVA and VPA than usual practice centres. Annesi et al.,
2013 [44] Sedentary activity MVPA VPA
N/R N/R N/R
∆ -2.3 % (p =0.162) over 8 weeks between groups ∆ 2.77 % (p =0.026) over 8 weeks between groups ∆ 2.0 % (p =0.058) over 8 weeks between groups
When educators instructed lessons on gross motor skills, used cues, gave performance feedback and helped children set goals and self-monitor, children increased their time spent in MVPA compared to usual practice centres.
Annesi et al.
2013 [45] Sedentary activity Light PA MPA
MVPA VPA
N/R (p ≥0.05) over 9 months between groups ∆ -4.8 % (p <0.001) over 9 months between groups N/R (p ≥0.05) over 9 months between groups ∆ 2.0 % (p =0.031) over 9 months between groups ∆ 2.1 % (p <0.001) over 9 months between groups
N/R N/R N/R N/R N/R
When educators instructed lessons on gross motor skills, used cues, gave performance feedback and helped children set goals and self-monitor, children spent more time in MPVA and VPA and less time in light PA, compared to usual practice centres.
Annesi et al.
2013 [46] Sedentary activity MVPA VPA
∆ -1.84 % (p ≥0.05) over 8 weeks between groups ∆ 2.65 % (p =0.013) over 8 weeks between groups ∆ 1.8 % (p =0.037) over 8 weeks between groups
N/R N/R N/R
When educators instructed lessons on gross motor skills, used cues, gave performance feedback and helped children set goals and self-monitor, children increased their time spent in MVPA and VPA, compared to usual practice centres.
Correlates
Study Relationship assessed Result (p value or 95% CI) Result summary
Bower et al.
2008 [37] Association between educator behaviours and children’s PA: Staff behaviours were positively correlated with children’s mean activity level and MVPA, and negatively correlated with sedentary activity.
-Activity level (minutes observed) r =0.352
-Sedentary (% of observations) r =-0.360
-MVPA (% of observations) r =0.278
Brown et al.
2009 [39] Odds of children being active if educators initiated activities compared to if children initiated activities: Child initiated activities were associated with more intervals of MVPA and total PA than educator initiated activities. Children were less likely to be active when educators were around.
-MVPA
-Total PA OR: 0.72 (95% CI: 0.60 – 0.88) OR: 0.65 (95% CI: 0.57 – 0.73)
Odds of children being active alone, with one peer, or with a group of peers, if educators were present compared to if they were not present:
- Alone:
MVPA Total PA
- One-on-one with peers:
MVPA LMVPA
-Group without educator:
MVPA LMVPA OR:0.28 (95% CI: 0.25 – 0.32) OR: 0.36 (95% CI: 0.33 – 0.40) OR:0.44 (0.38 – 0.50) OR: 0.65 (95% CI: 0.59 – 0.72) OR:0.49 (0.45 – 0.55) OR: 0.68 (95% CI: 0.63 – 0.72) Gubbels et al.
2011 [40] Association between positive and negative prompting on children’s PA: Positive prompting by staff had a positive influence on children’s PA intensity both indoor and outdoor. Negative prompting by staff did not influence children’s PA intensity. - Positive prompts (reference = no prompts)
Indoor activity intensity
Outdoor activity intensity r= 0.37 (p <0.001) r= 0.39 (p <0.01) - Negative prompts (reference = no prompts)
Indoor activity intensity
Outdoor activity intensity r= 0.12 (p ≥0.05) r= -0.05 (p ≥0.05) Gunter et al.
2012 [41] Difference between total PA (min/hour) of children in PA promoting environments vs. children in non-PA environments as characterized by: Children engaged in more minutes of total activity/hour when educators often or always played with children during active free play time. Not restricting active play for children who misbehave, and reading books and playing games with PA or exercise themes were not associated with greater activity/hour in family childcare homes.
-Educators never restricts active play time for children who misbehave ∆ -0.1 (p =0.94) - Educators often or always plays with children during active (free) play time ∆ 2.5 (p =0.013)
EATING BEHAVIOURS Effectiveness
Study Relationship assessed Unadjusted mean difference
(p value) Adjusted mean difference (p value) Result summary
Branen & Fletcher, 1994 [47]
-Allowing children to self-select their food (reference = pre-portioning food)
Portions of snack eaten Portions of snack wasted Grams of snacks wasted
∆ 0.87 (p <0.01) between conditions ∆ 0.03 (p ≥0.05) between conditions ∆ 2.7 (p ≥0.05) between conditions N/R N/R N/R
Children increased their intake of snacks when teachers allowed children to self-select compared to when they pre-portioned food. Number of wasted portions did not significantly differ between pre-portioning food and allowing children to self-serve. Grams of waste did not significantly differ between both feeding methods.
Harnack et al.
2012 [48] Fruits and vegetables served first (reference = in tandem with other foods) Fruits (mean serving)
Vegetables, no potatoes (mean serving) Grains (mean serving)
Meat (mean serving) Milk (mean serving) Energy (kcal) Fat (%kcal) Fibre (g) Vitamin A (RAE in mcg) Vitamin C (mg) Folate (DFE, mcg) ∆ 0.08 (p <0.01) between conditions ∆ 0.02 (p ≥0.05) between conditions ∆ 0.02 (p ≥0.05) between conditions ∆ -0.05 (p ≥0.05) between conditions ∆ -0.04 (p ≥0.05) between conditions ∆ 14.4 (p ≥0.05) between conditions ∆ 1.1 (p ≥0.05) between conditions ∆ 0.2 (p ≥0.05) between conditions ∆ 367.2 (p <0.01) between conditions ∆ 1.3 (p ≥0.05) between conditions ∆ 4.2 (p <0.05) between conditions N/R N/R N/R N/R N/R N/R N/R N/R N/R N/R N/R
When educators served fruits and vegetables in advance of other menu items during a traditional family-style meal service, children consumed more fruit and increased their intake of vitamin A and folate, than when all items were served in tandem.
When educators pre-portioned meals, children ate more grains, meat and milk, and increased their intake in calories, % calories from fat, fibre and folate, compared to when meals were served family-style.
Children ate less fruits and vegetables (excluding potatoes), and decreased their intake in vitamin C when meals were pre-portioned rather than served family-style. Educator portioned (reference = family-style service)
Fruits (mean serving)
Vegetables, no potatoes (mean serving) Grains (mean serving)
Meat (mean serving) Milk (mean serving) Energy (kcal) Fat (%kcal) Fibre (g) Vitamin A (RAE in mcg) Vitamin C (mg) Folate (DFE, mcg) ∆ -0.07 (p <0.001) between conditions ∆ -0.03 (p <0.01) between conditions ∆ 0.08 (p <0.05) between conditions ∆ 0.49 (p <0.001) between conditions ∆ 0.06 (p <0.01) between conditions ∆ 61.5 (p <0.001) between conditions ∆ 2.4 (p <0.001) between conditions ∆ 0.3 (p <0.05) between conditions ∆ 228.4 (p ≥0.05) between conditions ∆ -3.6 (p <0.01) between conditions ∆ 9.5 (p <0.001) between conditions N/R N/R N/R N/R N/R N/R N/R N/R N/R N/R N/R