Université de Montréal
Influence of Perceived Stressful Homework on Lifestyle
Habits and Subsequently on Adiposity: a QUALITY Study
par Thiffya Arabi Kugathasan
Département de kinésiologie
Mémoire présenté à la Faculté́ des études supérieures et postdoctorales en vue de l’obtention du grade de maître ès science (M.Sc.)
en sciences de l’activité physique
Décembre, 2017
Résumé
Contexte : Les devoirs perçus stressants semblent avoir un effet négatif sur l’adiposité des
enfants entre 8-10 ans et l’activité physique d’intensité moyenne-élevée (APMV) et le temps-écran sont des médiateurs dans cette relation.
Objectifs : 1) Examiner si un facteur nutritionnel pourrait aussi être un médiateur, 2) Étudier
les associations et médiateurs présents à l’âge de 10-12 ans, et 3) Prendre une approche longitudinale sur ces résultats pour étudier ces relations.
Méthodes : Les données suivantes de l’étude de QUALITY ont été extraites : durée des
devoirs, niveau de stresse et temps-écran, durée de sommeil et APMV, facteurs nutritionnels, et profil d’adiposité. « Process Macro » a été utilisé pour faire les analyses statistiques.
Résultats principaux : Les devoirs perçus étant stressants étaient positivement associés avec
l’adiposité seulement à 8-10 ans chez les enfants, particulièrement les filles. La consommation de breuvage sucré était un médiateur partiel entre les devoirs perçus étant stressants et le pourcentage de gras abdominal des enfants de 8-10 ans. À 10-12 ans, le temps-écran était le seul médiateur entre les devoirs et l’index de masse corporelle. Le changement dans la durée de sommeil était le seul médiateur entre les changements de devoirs perçus étant stressant et pourcentage de gras abdominal qui s’est produit depuis l’âge de 8-10 ans chez les enfants, particulièrement les filles.
Conclusions : Avec l’avancée de l’âge et augmentation des devoirs, les habitudes d’écran
changent. Dans l’aspect préventif de l’obésité pédiatrique, le temps-écran et la durée de sommeil pourraient être surveillés de près.
Mots-clés: Devoir, écran, sommeil, activité physique, alimentation, breuvages sucrés, enfants,
Abstract
Background: Perceived stressful homework was shown to be associated with poor adiposity
profile in children aged 8-10 years old, and this was mediated by a decrease in moderate-to-vigorous physical activity (MVPA) and an increase in screen time.
Objectives: 1) Explore if any dietary factors could be potential mediator, 2) Observe the
associations and mediators present at 10-12 years of age, and 3) Examine from a longitudinal perspective these associations (from 8-10 years old to 10-12 years old).
Methods: The following information on the QUALITY cohort children were extracted:
homework duration, stress level and screen time, sleep and MVPA duration, dietary factors, and adiposity profile. Process Macro for SPSS was used for the statistical analyses.
Main Results: Perceived stressful homework was positively associated with adiposity at 8-10
years old only in all children, particularly in girls. High-sugar drink was a partial mediator between perceived stressful homework and trunk fat percentage in children at 8-10 years old. Screen time mediated the relationship between homework and body mass index of children at 10-12 years old. Sleep duration change mediated the association between perceived stressful homework duration and trunk fat percentage changes in children since ages 8-10 years old, especially in girls.
Discussion: As children grow and perform a lot of homework, screen habits changes. In
prevention aspect of paediatric obesity, screen time and sleep duration are the two major habits to monitor.
Keywords: Homework, screen, sleep, physical activity, diet, high-sugar drink, children,
Table of Contents
Résumé ... i
Abstract ... ii
Table of Contents ... iii
List of Tables ... vi
List of Figures ... vii
List of Acronyms and Abbreviations ... viii
Acknowledgements ... x
Introduction ... 1
Definition of obesity and its classification in adults ... 1
Obesity classification in children ... 2
Obesity trends in adults ... 3
Worldwide ... 3
In Canada ... 3
Obesity trends in children ... 4
Worldwide ... 4
In Canada ... 4
Consequence of obesity ... 5
Consequences on physical health ... 5
Consequences on mental health/social life ... 6
Consequences on the Canadian economy ... 6
Causes of obesity ... 7
Definition of mental work and workload ... 8
Measure mental workload ... 9
Definition of stressful mental work ... 10
Mental work, an emerging factor ... 10
Children ... 11
Lifestyle habits relevant to mental work ... 12
Sedentary behaviors ... 12 Physical activity ... 14 Sleep ... 15 Dietary patterns ... 17 Article 1 ... 19 Information ... 19 Author’s contribution ... 19 Article 2 ... 37 Information ... 37 Author’s contribution ... 37 Discussion ... 48
Purpose of this project ... 48
Summary of the major results ... 48
Adiposity ... 49
1.0 Adiposity and mental work ... 49
2.0 Adiposity as outcome ... 50
Physical activity ... 54
1.0 Physical activity and mental work ... 54
2.0 Physical activity and adiposity ... 55
3.0 MVPA as a mediator ... 56
Screen time ... 57
1.0 Screen time and mental work ... 57
2.0 Screen time and adiposity ... 58
3.0 Screen time as a mediator ... 58
Sleep time ... 60
1.0 Sleep time and mental work ... 60
2.0 Sleep time and adiposity ... 60
High sugar drinks ... 62
1.0 High sugar drinks and mental work ... 62
2.0 High sugar drinks and adiposity ... 63
3.0 High sugar drinks as a mediator ... 63
Combined mediators interpretation ... 64
1.0 Screen time and high-sugar drinks ... 64
2.0 Screen time and MVPA ... 65
Clinical implications ... 67
Strength and limitations ... 68
Future directions ... 70
My implication in this study ... 70
Conclusion ... 71
Bibliography ... 72
List of Tables
List of Figures
Figure 1. Different levels and sectors of society that are related to obesity ... 8
List of Acronyms and Abbreviations
BMI: Body mass indexDQI-I: Dietary Quality Index-International KBW: Knowledge-Based Work
Kg: Kilograms kJ: Kilojoules
LPA: Low-Intensity Physical Activity m: meter
MVPA: Moderate-to-Vigorous Physical Activity
OECD: Organisation for Economic Cooperation and Development QUALITY: QUebec Adiposity and Lifestyle InvesTigation in Youth WC: Waist circumference
Acknowledgements
Thank you to all the children and families who took part in the QUebec Adiposity and
Lifestyle InvesTigation in Youth (QUALITY) study, without whom I would not have had this precious dataset.
Thank you to Miguel Chagnon for outlining the statistical analyses for this project.
Thank you to all the pioneers of the Laboratoire d’activité physique et santé for their help and mental support throughout my masters: François Dupont, Baptiste Fournier, Valérie Giroux, Kapria-Jad Josaphat, François Lecot, Ryan Reid, Soraya Saidj as well as all the interns.
Thank you to my supervisor, Marie-Ève Mathieu, who was involved in all of the steps leading to this project. Thank you for guiding me through my masters. Thank you for recommending me to the QUALITY cohort study under the supervision of Pr Mélanie Henderson as a
research assistant. This opportunity brought me to other rewarding experiences (Thank you to Pr Mélanie Henderson). Thanks to the QUALITY project, I also met the wonderful personnel of QUALITY (Catherine Pelletier, Natacha Marion, Ginette Lagacé and many others) who supported me in one-way or the other, especially on the ‘‘Journée QUALITY de
l’hiver 2017’’. Thank you all very much!
Finally, I would like to thank my family (K.G., P.K., G.K., P.K. et P.G.) for their continuous support during the past years and the ones to come.
Introduction
Definition of obesity and its classification in adults
Obesity refers to a condition in which fat accumulates excessively or abnormally in adipose tissue, and impairs an individual’s health (Ofei, 2005; World Health Organisation (WHO), 2016c). An individual could be classified as obese according to their body mass index (BMI), which is considered to be an indicator of overall adiposity (I. Janssen et al., 2005). A BMI of ≥ 25 kilograms (kg)/meter (m)2 is classified as overweight whereas ≥ 30 kg/m2 is classified as obese (WHO, 2016c). BMI category delineations vary based on the ethnicity of an individual (Deurenberg, Yap, & van Staveren, 1998; Misra, 2003). For example, an Asian Indian would be classified as obese with a BMI ≥ 25 rather than ≥ 30 kg/m2 (Misra et al., 2009). BMI alone was observed to be a good predictor of mortality, with each increase of 5 kg/m2 increasing risk of mortality by ~30%, neoplastic mortality by 10%, vascular mortality by 40%, and diabetic, renal, and hepatic mortality by 120% (Prospective Studies, 2009).
Another known indicator of adiposity is waist circumference (WC), which is used as a predictor of abdominal visceral adiposity (Rankinen, Kim, Perusse, Despres, & Bouchard, 1999). This measurement also provides obesity-related health risk assessment, for example, WC can be used to predict the risk of cardiovascular disease (S. Zhu et al., 2002), type 2 diabetes (Chan, Rimm, Colditz, Stampfer, & Willett, 1994) and mortality (Koster et al., 2008). This indicator is stronger than BMI in predicting health risk associated with obesity (Ian Janssen, Katzmarzyk, & Ross, 2004). Similar to BMI categories, the WC cut-offs and related health risks vary depending on an individual’s ethnicity (Misra, Wasir, & Vikram, 2005). For example, an Asian individual will be at a much higher morbidity than a Caucasian individual for the same WC (Misra et al., 2005). One factor among others that explains these ethnic variations is the difference in abdominal adipose tissue and skeletal muscle composition.
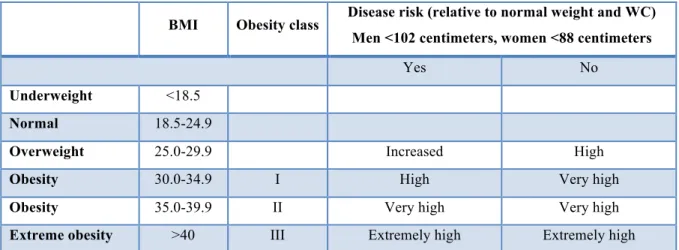
It has been suggested to combine WC with BMI to better determine obesity-related health risk (Douketis, Paradis, Keller, & Martineau, 2005; Lau et al., 2007). Below is a table in which BMI and WC are combined and indicate the health risk that is associated with each category (Table 1).
Tableau 1. BMI combined with WC and their disease risk
Obesity classification in children
There exists a BMI classification for children based on a percentile graph. Since the weight and height of children change as they grow, this percentile chart is designed to compare children of same sex and age (Hammer, Kraemer, Wilson, Ritter, & Dornbusch, 1991). Currently, BMI-for-age growth charts are used internationally to classify children in different weight categories based on national data (i.e. data from children born in the United States, collected between 1963 and 1994) (Kuczmarski et al., 2000). However, to compare the trend in overweight and obesity internationally, Cole and colleagues suggested cut-offs for children between 2 and 18 years of age based on international surveys. The authors also provided BMI percentile charts for different countries and sex (Cole, Bellizzi, Flegal, & Dietz, 2000).
As was the case for adults, children’s body fatness is not equivalent to BMI throughout the different race-genders (Daniels, Khoury, & Morrison, 1997), hence the exploration of other tools such as WC, which provides an effective measure of truncal adiposity in children and adolescents (Taylor, Jones, Williams, & Goulding, 2000), and can more accurately classify health risks associated with obesity. Fat distributed mostly around the abdominal area
BMI Obesity class Disease risk (relative to normal weight and WC) Men <102 centimeters, women <88 centimeters
Yes No
Underweight <18.5
Normal 18.5-24.9
Overweight 25.0-29.9 Increased High
Obesity 30.0-34.9 I High Very high
Obesity 35.0-39.9 II Very high Very high
Extreme obesity >40 III Extremely high Extremely high
BMI: Body mass index; WC: Waist circumference;
Source: Adapted from (NIH, National Heart, & North American Association for the Study of Obesity, 2000)
has a greater risk profile than fat distributed in the gluteal-femoral area (Zwiauer, Pakosta, Mueller, & Widhalm, 1992). WC assesses the adiposity profile of children and predicts overweight at puberty (Maffeis, Grezzani, Pietrobelli, Provera, & Tato, 2001).
In the clinical setting, BMI has been suggested to be combined with WC to best assess health risk (Bassali, Waller, Gower, Allison, & Davis, 2010; I. Janssen et al., 2005) and predict risk factors clustering (Katzmarzyk et al., 2004) in children and teenagers. For example, children in the overweight BMI category are two times more at risk of high triglycerides, elevated insulin levels, and the metabolic syndrome when also demonstrating a high WC (I. Janssen et al., 2005).
Another measurement called the waist-to-height ratio is a simple tool that is better than BMI and WC in predicting adiposity in children and adolescents (Brambilla, Bedogni, Heo, & Pietrobelli, 2013), and identifying cardiometabolic risk in adolescents (Rodea-Montero, Evia-Viscarra, & Apolinar-Jiménez, 2014). In children, this measurement does not alter with age or sex like BMI, which allows setting one single cut-off value for children (Arnaiz et al., 2014).
Obesity trends in adults
Worldwide
WHO states that since 1975 worldwide obesity has tripled (WHO, 2017b). In 2014 and 2016, 1.9 billion adults (≥ 18 years old) were identified as being overweight. However, in 2014, 600 million of those individuals actually fell into the obese category of BMI classification (WHO, 2016c), whereas in 2016, 650 million were considered overweight (WHO, 2017b). An upward trend in the prevalence of obesity from 1960 to 2025 has been observed in the United States, England, Mauritius, Australia and Brazil (Kopelman, 2000). Alarmingly, half of the world’s population living with obesity reside in only ten countries, the highest prevalence observed in the United States (Komlos & Kelly, 2016).
In Canada
Among the approximately forty countries part of the Organisation for Economic Cooperation and Development (OECD), Canada ranked as having the sixth highest-adult-obesity-rate with 25.4% of its adult population living with obesity (OECD, 2014). Statistics
Canada reported that in 2014, 20.2% of the adult population, which is around 5.3 million people, were classified as obese (Statistics Canada, 2015). The obesity rate in men has increased to 21.8%, which is an increase of 1.7% compared to 2013, and the highest percentage reached since 2003. The same trends were seen in women where the prevalence of obesity was 18.7% in 2013, which was also the highest percentage reached since 2003 (Statistics Canada, 2015). Moreover, the percentage of males with overweight was 40.0%, and 27.5% for women. It is important to note that 70% of adults in the First Nations Communities are considered overweight or obese, which is substantially higher than the rest of the Canada (Standing Senate Committee on Social Affairs, 2016).
Obesity trends in children
Worldwide
Since 1990, the number of children with overweight and obesity has increased drastically worldwide (de Onis, Blössner, & Borghi, 2010). In 1990, 32 million children between 0 and 5 years old were considered above overweight. In 2016, this number had increased to approximately 41 million children (WHO, 2016b). Moreover, this number is expected to increase and reach around 60 million children in 2020 (de Onis et al., 2010). The worldwide prevalence of childhood overweight and obesity has increased by 47.1% between 1980 and 2013 (Ng et al., 2014). Childhood obesity has widespread in developed countries and considered to have reached an epidemic level (Dehghan, Akhtar-Danesh, & Merchant, 2005). In the United States, for example, 25% of children were considered overweight whereas 11% were considered obese (Dehghan et al., 2005). In 2004, the highest prevalence of childhood obesity was in the Middle East, Central and Eastern Europe, and North America (James, 2004).
In Canada
Since 1980, the number of Canadian children living with obesity has increased sevenfold (Standing Senate Committee on Social Affairs, 2016). In 2014, 13% of children between the ages of 5–17 years were classified as obese and 20% as overweight (Standing Senate Committee on Social Affairs, 2016). Currently one out of seven Canadian children are
considered to be obese (Rao, Kropac, Do, Roberts, & Jayaraman, 2016). Compared to other countries surveyed, Canada ranked fifth on a list of forty countries with the highest childhood obesity prevalence (Standing Senate Committee on Social Affairs, 2016). As was the case for adults, in the First Nation Communities, there is a higher percentage of children below the age of 11 years who are considered either overweight or obese, and this percentage (62.5%) is considered to be high when compared to the rest of Canadian children (Standing Senate Committee on Social Affairs, 2016).
Consequence of obesity
Consequences on physical health
In adults
With increases in BMI demonstrated globally, we begin to see increased risk of developing type 2 diabetes, musculoskeletal diseases such as osteoarthritis, and certain types of cancers as well (endometrial, breast and colon) (Kopelman, 2000; WHO, 2017b). Obesity is associated with several other co-morbidities, such as cardiovascular diseases (WHO, 2016a, 2017b). In high-income countries, along with alcohol use and smoking, overweight and obesity are the main causes of cancer (Danaei, Vander Hoorn, Lopez, Murray, & Ezzati, 2005). The relative risk of cholelithiasis, hypertension, and coronary heart disease also increase with increases in BMI (Willett, Dietz, & Colditz, 1999). Moreover, obesity increases the risk of hospitalization and death due to cardiovascular diseases or type 2 diabetes (Smith, 2007). The Framingham Heart Study with approximately 40 years of follow-up (1948–1990) found an association between living with obesity and overweight, and having a shorter life expectancy/early death (Peeters et al., 2003). Obesity and overweight are associated with all-cause mortality (Flegal, Kit, Orpana, & Graubard, 2013).
In children
Children also suffer from numerous negative consequences of obesity. Obesity increases the risk of developing cardiovascular disease, insulin resistance, certain types of cancers, musculoskeletal disorders (WHO, 2016b), asthma (Gilliland et al., 2003),
hypertension, and fracture (WHO, 2017b). Other health problems include cholelithiasis, glucose intolerance, hyperlipidemia and many more (Dietz, 1998). Some systemic health problems that can be observed in children as a consequence of obesity are obstructive sleep apnea, polycystic ovary syndrome, and renal hyperfiltration (Han, Lawlor, & Kimm, 2010).
Aside from this poor risk factors profile, diseases such as diabetes (Wiegand, Dannemann, Krude, & Gruters, 2005) and hypertension (Sorof, Lai, Turner, Poffenbarger, & Portman, 2004), which were until recently referred to as adult diseases, are being diagnosed in children with obesity (Bridger, 2009). Moreover, living with obesity during childhood can have repercussions in adolescence and even adulthood. In fact, a little less than half of the incidence of obesity between ages 5–14 years occurs in 15% of children who were overweight at 5 years old (Cunningham, Kramer , & Narayan 2014). Living with obesity during childhood is associated with premature death and disability in adulthood (WHO, 2016c).
Consequences on mental health/social life
The consequences of obesity are not restricted to physical aspects only, there are also psychosocial consequences (Dietz, 1998). Children with obesity were observed to have a negative self-esteem, especially in girls (Richard S. Strauss, 2000). Moreover, children living with obesity typically have greater amounts of depression and low Health-Related-Quality of Life score compared to their normal-weight peers (Morrison, Shin, Tarnopolsky, & Taylor; Schwimmer, Burwinkle, & Varni, 2003). Many other consequences, such as school problems, grade repetition and conduct disorder have also been noted (Halfon, Larson, & Slusser). It is important to note that children with obesity were observed to transition into adolescence with a poor self-perception (Franklin, Denyer, Steinbeck, Caterson, & Hill, 2006).
Consequences on the Canadian economy
In 2006, total direct cost attributable to overweight and obesity in Canada was six billion dollars, and obesity accounted for 66% of this cost (Anis et al., 2010). This cost was calculated based on 18 comorbidities that were linked to obesity. Obesity also provokes indirect costs such as absenteeism and loss of productivity, which increase the burden on Canadian economy. In 2013, in Canada, compared to the economic burden of tobacco
smoking and physical inactivity (18.7 billion and 10.8 billion dollars respectively), excess weight created a burden of 23.3 billion dollars (Krueger, 2015).
Causes of obesity
Figure 1 is a modified casual web of the International Obesity Task Force’s that shows different factors that will end up influencing energy intake and energy expenditure (Huang, 2009; Kumanyika, Jeffery, Morabia, Ritenbaugh, & Antipatis, 2002) in children. In simple words, overweight or obesity is caused by a positive difference in energy balance that consists of energy intake, energy expenditure and energy storage (James O. Hill, Wyatt, & Peters, 2012). For example, factors such as high screen viewing time (low energy expenditure) with high consumption of energy-dense food with high fat content (high energy intake) will result in a state of positive energy balance (James O. Hill et al., 2012). This positive imbalance maintained over time will induce weight gain and in this context, 60–70% of the weight gain will be fat (J. O. Hill & Commerford, 1996). Moreover, physical inactivity is associated with obesity (M. S. Tremblay & Willms, 2003). In the past century, the daily amount of energy expended has decreased and this is, in part, due to sedentary occupations, modes of transportation and urbanization (James O. Hill et al., 2012). In children with obesity, a risk reduction of 23–43% and a reduction of 10–24% in children with overweight were observed when physical activity was performed regularly (M. S. Tremblay & Willms, 2003). In Figure 1, under the category “School/Work/Home”, a subcategory called “School Food & Activity”, which could regroup homework, a mental work that might have its share in affecting the energy balance.
On a larger scale, some key drivers of obesity are urbanization, economic growth, food availability and marketing (Huang, 2009). Even factors such as agriculture policies imposed on cultivation outcomes can have an influence on the eating habits of the population (Huang, 2009). For example, policies that support growth of certain types of food might impact farmers’ decisions on what type of food to grow, for instance, corn taking priority over fruits and vegetables (Huang, 2009). Eating habits of the population depend on commercial messages including packaging and marketing, which are determined by the food industries (Huang, 2009). Biological factors such as birth weight, genes and appetite can also affect the energy balance (Huang, 2009).
Figure 1. Different levels and sectors of society that are related to obesity
Source: Adapted from (Huang, 2009; Kumanyika et al., 2002)
Definition of mental work and workload
Mental work is defined as a mental task that demands a cognitive effort. In other words, a work to be considered, “mental work” must be cognitively demanding (Chaput & Tremblay, 2007; Lemay, Drapeau, Tremblay, & Mathieu, 2014).
In the 1980s, there was no consensus on the definition of mental workload and how it must be measured. Mental workload was thought to be tied to social pressure and expectations. An objectively easy task could appear harder under fatigue or lack of motivation thus making it more demanding (higher workload) (Moray, 1982). Workload can be defined as the portion of the total resource capacity allocated at a given time to perform a certain task (Pierce, 2009). Thus, if there is an increased mental demand, the person will increase the proportion of their resources to complete that task which would indicate that they are under increased mental workload. Subsequently, depending on the mental demand imposed on an individual, performance will vary which is described by a hypothetical graph between
INTERNATIONAL
FACTORS NATIONAL/REGIONAL COMMUNITY/LOCALITY WORK/SCHOOL/HOME INDIVIDUAL POPULATION
Globalization of Markets Development Media Programs & Advertising Urbanization Transport Education Media & Culture Social security Health Food & Nutrition Public Transport Public Safety Agriculture/Gardens /Local Markets Health Care Sanitation Manufactured/ Imported Food Leisure Activity/ Facilities Labour Infections Worksite Food & Activity Family & Home School Food & Activity Energy Expenditure Food Intake : Nutrient Density PREVALENCE OF UNDER/OVER- WEIGHT OR OBESITY
performance and mental workload proposed by Meister in 1976 shown in Figure 2 (De Waard, 1996). Briefly stated, as mental demand increases the performance decreases.
Figure 2. Relationship between performance and mental workload proposed by Mesiter
Source: Adapted from (De Waard, 1996)
Measure mental workload
Questionnaires are used to measure mental workload (subjective). In research a widely used questionnaire is the NASA Task Load Index, a multidimensional scale that estimates overall workload during or after a given task (Hart, 2006; Hoonakker et al., 2011). Participants are asked the following question: “How much mental and perceptual activity was required (e.g. thinking, deciding, calculating, remembering, looking, searching, etc.)? Was the task easy or demanding, simple or complex, exacting or forgiving?”. Workload score is calculated based on these answers and other factors such as participants’ weight (Hart, 2006). Other questionnaires have been used to assess mental workload (sample question: “How mentally straining do you consider your work?”) (Kivimäki et al., 2002). In children, homework and schoolwork would be considered mental work. The homework duration has been “measured” through questionnaires as well (M. K. Galloway & Pope, 2007; I. Michaud, Chaput,
Le ve l o f P er fo rm an ce High Low Demand High Low
O'Loughlin, Tremblay, & Mathieu, 2015). For example, Galloway & Pope (2007) asked: “On a typical day, how many hours do you spend on homework (Do not include time spent taking breaks, instant messaging, etc.)?”.
Objective measures have been used to measure mental workload in aircraft pilots and car drivers (Borghini, Astolfi, Vecchiato, Mattia, & Babiloni, 2014). Combination of heart rate and eye blink data could indicate the mental workload imposed on a pilot (Wilson & Fisher, 1991). For example, number and duration of blinks were associated with mental workload, with shorter and fewer blinks related to increased workload (Brookings, Wilson, & Swain, 1996). Performance-based measures, which are based on the assumption that a difficult task imposes higher demands, which will in turn decrease performance, can also objectively measure mental workload (Rubio, Díaz, Martín, & Puente, 2004).
Definition of stressful mental work
Dr Steptoe provided a widely accepted definition of stress in the 1991. It states that stress occurs when there is an imbalance between the resources that a person disposes to cope with various situations, which are the psychosocial resources, and the demands imposed by their environment (Steptoe, 1991; Wallis & Hetherington, 2004).
Mental work, an emerging factor
Adults
In males, sedentary work was noted to have increased (24.9% to 48.3%) and very physically demanding work decreased (31.5% to 10.2%) between 1972 and 2002 (Bockerman, Johansson, Jousilahti, & Uutela, 2008). In addition, workers were observed to suffer less of a physical burnout and more of a psychological exhaustion due to the advancement of technology that has transitioned the type of work from physical to mental (Angelo Tremblay & Therrien, 2006). It is therefore important to study the influence of mental work on the population.
Bockerman and colleagues conducted a study examining physical strenuousness at work and the BMI of workers between 1972 and 2002 (with data collection every 5 years) (Bockerman et al., 2008). In male workers, occupational structural changes were estimated to
account for 7% of the BMI increase that occurred during this period. Compared to males who performed sedentary work, those who performed very physically demanding work were observed to have a 2.4% lower BMI. Likewise, females performing physically demanding work had 1.4% lower BMI than those performing sedentary work.
Lallukka and colleagues incorporated a mental aspect into their occupational analyses and adiposity (Lallukka et al., 2008). In a 28-year follow-up, they collected the type of work, mental or physical, BMI and weight changes between 1973 and 1983 (Lallukka et al., 2008). This longitudinal study also recorded changes that took place in participants’ working conditions (i.e. increased, decreased or constant physical and mental strain) throughout those years. Male workers whose mental strain increased between these years gained 4.3 kg whereas those who had constant or decreased mental strain gained 2.4 kg (Lallukka et al., 2008).
Children
To our knowledge, the only study which has examined the relationship between mental work and adiposity in children is Michaud et al. (2015), from our own research team. In addition to analyzing the relationship between perceived stressful homework and adiposity indicators, they also examined which lifestyle habits (screen time, moderate-to-vigorous physical activity (MVPA) or sleep duration) mediated this relationship. Data of 511 Caucasian children from the QUALITY cohort between ages 8–10 years old was gathered. Boys who performed more than 30 minutes on homework while feeling stressed by schoolwork had a poor adiposity profile (I. Michaud et al., 2015). In teenagers, those who accumulated more than 3.5 hours/night of homework reported experiencing weight gain (M. K. Galloway & Pope, 2007). In addition, 72% of teenagers reported being stressed by school-related work and 56% reported homework as being the primary stressor in their life (M. K. Galloway & Pope, 2007).
Taking all these results into consideration, it is important to do a follow-up of Michaud and colleagues’ study (2015) when QUALITY cohort children were 10–12 years old while taking into account their perceived stress. Moreover, with increasing age, children’s homework load, number of hours spent doing homework on a weekday (M. K. Galloway & Pope, 2007), increases as well. Students nearly 13 years old performed more homework than children around 9 years of age (Snyder & Dillow, 2012). Compared to younger children, 11–
14 year old spent more time doing their homework (Canadian Fitness & Lifestyle Research Institute, 2014). Girls, generally, spend more time performing schoolwork than boys. High school students estimated to have a longer workday than most adults when hours spent doing homework were added to their regular school hours (M. K. Galloway & Pope, 2007). In addition to this increase in homework throughout academic years, the amount of homework given to students increased throughout the past decades i.e. percentage of high school students spending more than two hours of homework has increased from 7% to 37% from 1980 to 2002 (Statistics, 2007). These trends demonstrate the need to study the influence of homework on adiposity in older children.
Lifestyle habits relevant to mental work
Sedentary behaviors
Sedentary behaviors are activities characterized by low energy expenditure, ≤1.5 metabolic equivalents, such as sitting or being in a reclined position (Sedentary Behavior Research, 2012) while still awake. Canadian children spend on average 8.6 hours/day in sedentary behaviors, which is approximately 62% of the total time that they are awake (Colley et al., 2011). It is important to note that a child could be considered sedentary regardless of their daily physical activity level (Herman, Sabiston, Mathieu, Tremblay, & Paradis, 2014). Studies have demonstrated that 11-year-old children have a higher prevalence of sedentary behaviors than 6-year-old children (Fakhouri, Hughes, Brody, Kit, & Ogden, 2013). Furthermore, sedentary behaviors gradually increase from early teenage years towards adulthood (Brodersen, Steptoe, Boniface, & Wardle, 2007). Sedentary time has been linked to obesity during childhood and adolescence (Must & Tybor, 2005). Reducing these behaviors can be an effective strategy to decrease the incidence of obesity (M. S. Tremblay et al., 2011).
Screen time
Screen viewing (television, video games), reading or playing quietly are examples of sedentary behaviors (LeBlanc et al., 2015). In adults, television viewing was associated with negative health outcomes even though participants met physical activity recommendations (Healy et al., 2008). There was also a dose-response relationship between television viewing
and WC, systolic blood pressure, and 2-hour plasma glucose levels. In women, there was a dose-response relationship linking television viewing with fasting plasma glucose, triglycerides and high-density lipoprotein cholesterol (Healy et al., 2008).
In school-aged children, television viewing is often used as a measure of sedentary behavior (M. S. Tremblay et al., 2011). Recommended leisure time screen time for children is not more than two hours per day (Expert Panel on Integrated Guidelines for Cardiovascular Health and Risk Reduction in Children and Adolescents, 2011; Mark S. Tremblay et al., 2011). Television viewing of > 2 hours/day had a dose-response relationship with the risk of overweight/obesity whereas less than 2 hours/day was associated with higher fitness results and bone health (M. S. Tremblay et al., 2011). Low self-esteem and behavioral problems were also noted with ≥2 hours of screen time per day. Moreover, screen viewing during childhood and adolescence also has repercussions into adulthood (Boone, Gordon-Larsen, Adair, & Popkin, 2007). In fact, watching ≥ 2 hours of television per day during childhood and adolescence contributes to adulthood overweightness (Hancox, Milne, & Poulton, 2004).
It is noteworthy that in children, screen time, especially watching television, increases as they move from childhood to early adolescence (Rideout, Foehr, & Roberts, 2010), and the peak television viewing occurs between 9 and 13 years old (Gorely, Marshall, & Biddle, 2004). In teenagers, the home environment was observed to influence screen time. In fact, two predictors of television viewing (≥ 2 hours/day) were watching television with parents and mother viewing ≥ 2 hours/day of television (Hardy et al., 2006).
To the best of our knowledge, in adults, no studies have examined the effect of mental work on screen time and subsequently on adiposity. However, in children, it was found that increased screen time was a partial mediator between perceived stressful homework sessions and adiposity (I. Michaud et al., 2015). With increasing perceived stressful homework duration, screen time was seen to increase which was consequently associated with an increase in BMI.
As mentioned above, sedentary behaviors are more prevalent in early adolescence, increases with age and the amount of homework increases with academic years. It is therefore important to reinvestigate this relationship in older children.
Physical activity
The recommended amount of physical activity for adults is at least 150 minutes of more than moderate intensity aerobic exercise per week (WHO, 2010). However, a large proportion of adults were observed not to accumulate enough amount of physical activity (Metzger et al., 2008). More importantly, as mentioned earlier, reductions in physical activity on a daily day basis has contributed to the obesity epidemic (Fox & Hillsdon, 2007). Failure to reach this recommendation (physical inactivity) increases the risk of overall mortality (Fox & Hillsdon, 2007). Being physically active reduces the risk of high blood pressure, stroke, type 2 diabetes and many other diseases (Warburton, Charlesworth, Ivey, Nettlefold, & Bredin, 2010).
The recommended daily amount of physical activity for children between 5 and 17 years old is around 60 minutes of MVPA per day (WHO, 2010). Overall physical activity levels for a given age group decreased throughout chronological years. For example, step counts of 11–12 year-old Japanese boys in 1999 was 20,832 whereas in boys of the same age in 2009 was 12,237 (Itoi, Yamada, Nakae, & Kimura, 2015). In addition, the step counts of young girls of the same age were lower than those of boys at both time points (16,087 and 10,748 respectively). It is important to note that the overall physical activity level of young girls is much lower than boys whether it is at the age of 8 or 12 years old, after-school or during recess time (Itoi et al., 2015; Ridgers, Saint-Maurice, Welk, Siahpush, & Huberty, 2011; Veitch et al., 2006). In children, physical activity is known to be beneficial for health; improved cardiovascular fitness, lower body fat, and better cardiometabolic profile (WHO, 2010).
The physical component in the occupational setting has been extensively investigated in adults. However, the relationship between overall daily physical activity levels and mental work is currently unknown. In children, physical activity duration in a non-school environment was observed to partly mediate the relationship between homework and adiposity at 8–10 years old (I. Michaud et al., 2015). Children who performed a lot of homework while feeling stressed by schoolwork accumulated less minutes of physical activity, more precisely MVPA, which was consequently related to a poorer adiposity profile. Interestingly, a study with a sample size of 496 reported that 56% of children reported dropping out of their favorite
activity or hobby due to the high schoolwork load (M. K. Galloway & Pope, 2007), which could have been physical activity.
As children age, they become physically inactive and consequently do not reach the recommended physical activity levels each day (Dumith, Gigante, Domingues, & Kohl, 2011; Kimm et al., 2002; Troiano et al., 2008; Veitch et al., 2006). During the after-school period, the mean minutes/day of MVPA of children between 10–12 years old was lower than those between 5 and 6 years old in 2001, 2004 and 2006 (Veitch et al., 2006). For example, in 2001, 5–6 years old accumulated 277 minutes/day whereas 10–12 years old cumulated 150 minutes/day. Moreover, the physical activity levels of teenagers were observed to be low using various indicators of physical activity (Colley et al., 2011; Itoi et al., 2015; Verloigne et al., 2012). These trends describe the need for a longer-term follow-up on the relationship between mental strain and adiposity observed in young children becoming teenagers.
Sleep
In adults, a longitudinal study (n=6981) reported that individuals who had less than seven hours of sleep per night at the baseline had a higher BMI and increased risk of obesity than those with full seven hours of sleep per night (Gangwisch, Malaspina, Boden-Albala, & Heymsfield, 2005). In women, sleep duration and WC was noted to have a U-shape relationship (Theorell-Haglöw, Berglund, Janson, & Lindberg, 2012). However, after adjusting for poor habits such as physical inactivity and smoking, short sleepers were still at increased risk of central obesity, whereas in long sleepers this association disappeared (Theorell-Haglöw et al., 2012).
In children, sleep duration and obesity are closely linked in a dose-response relationship (Sekine et al., 2002). Children who slept ~10 hours/night were more likely to be classified as obese and have a higher annual BMI gain compared to those who slept ~12 hours/night (Ruan, Xun, Cai, He, & Tang, 2015). In addition, every gain of an hour of sleep reduces the risk of obesity by 21% in children (Ruan et al., 2015).
To better understand the relationship between sleep and adiposity, the level of certain hormones have been analyzed. Short sleepers had an increased level of ghrelin, a hormone that increases appetite, and a decrease of leptin, a hormone that suppresses appetite (Taheri, Lin, Austin, Young, & Mignot, 2004). Other hormones such as cortisol, a hormone that increases
food intake and accumulation of visceral fat (Yehuda & Mostofsky, 2007), and thyroid hormone, that regulates metabolism (Brent, 2012; Oetting & Yen, 2007), may also play a role in this relationship (Leproult, Copinschi, Buxton, & Van Cauter, 1997; Pereira & Andersen, 2014). Increased duration of wakefulness is associated with increased energy intake and sedentary behaviors such as screen viewing (Chaput, 2010; Magee, Caputi, & Iverson, 2014; Nedeltcheva et al., 2009). Another study described that an increase in energy intake or level of hormones was not affected, but a decrease in the daytime physical activity was observed (Schmid et al., 2009).
One of the factors that was observed to affect sleep is cognitive workload (Goel, Abe, Braun, & Dinges, 2014). Sixty-three healthy adults were randomly assigned to four different groups of varying cognitive workload and duration of wakefulness (sleep restricted vs. non-restricted) (Goel et al., 2014). To differentiate between different workload groups, the researchers kept the same battery of cognitive tests, but adjusted the time spent performing those tests such that the high workload group spent 120 minutes and the moderate group spent 60 minutes. This recent study showed that subjects who were under increased mental workload, regardless of the duration of wakefulness, had an increased rating of subjective fatigue and sleepiness (Goel et al., 2014). In addition, the high workload group had a delayed sleep onset and less wake after sleep onset compared to the moderate condition. Adults subjected to stressful mental work had increased anxiety and incorporation of prior-sleep-stressful-events into their dreams (Koulack, Prevost, & De Koninck, 1985).
To our knowledge there is a limited number of studies that have observed the effect of mental work on sleep and consequently on adiposity profiles in adults. However, in children (8–10 years old) this type of analyses was performed and sleep duration did not mediate the relationship between mental work and adiposity (I. Michaud et al., 2015). It is important to perform a follow-up on these three variables in older children since, as a child moves from one academic year to another, trends towards increased homework duration (Clemmitt, 2007) and sleep insufficiency are observed (Eaton et al., 2010). In fact, in young teenagers, longer homework duration was one of the factors that were associated with shorter sleep duration and later bedtimes (Jiang et al., 2015). In addition, girls were observed to have shorter sleep duration than boys and this difference was seen to accentuate with age. Homework duration was also noted to be associated with sleep quality (Jiang et al., 2015).
Dietary patterns
Eating habits, i.e. the other side of the energy balance equation, could have a negative impact on health. For example, dietary fat intake and added sugar seems to play a major role in obesity trends seen in adults (Popkin, 2006; Popkin, Adair, & Ng, 2012). In children, an unhealthy diet is linked to obesity (Collins, Watson, & Burrows, 2009; WHO, 2017a). For instance, consuming high amounts of added sugar (Maunder, Nel, Steyn, Kruger, & Labadarios, 2015) or low consumption of iron (Papandreou et al., 2016) are linked to obesity in children. Parents along with their children and teens were noted to consume high amounts of junk and sweet food (Rosen et al., 2014). Around 90% of children (7–12 years old; n=860) were noted to consume more than recommended amount of non-core foods such as soft drinks and snacks (Gevers, Kremers, de Vries, & van Assema, 2016).
Mental work has been documented to influence eating habits in adults. A case study reported that following a period during which an individual had to dictate a text for a grant application, the ratings of feeling of hunger and desire to eat were higher under the experimental condition (Angelo Tremblay & Therrien, 2006). While a case study can be limited, other studies suggest the same results. Chaput and colleagues (2007) had two experimental conditions: 1) 45 minutes of knowledge-based work (KBW), which consisted of reading then writing a 350-word summary on the computer, and 2) seated-resting period. Both of these conditions were followed by an ad libitum buffet. Energy intake was observed to be higher by 959 kilojoules (kJ) following KBW compared to control. This increase in energy intake was not compensated by a decrease in energy intake during the rest of the day, which consequently lead to a positive energy balance (Chaput & Tremblay, 2007). Another study, which used a similar design, reported that women had a higher energy intake after KBW than following resting conditions whereas male had a higher energy intake following resting condition (Perusse-Lachance et al., 2013).
McCann and colleagues observed employees of Grant and Contract Services under low and increased workload periods (McCann, Warnick, & Knopp, 1990). During high workload periods, during which perceived stress and workloads were high, plasma total cholesterol, calorie intake, total fat and percentage of calories from fat were elevated (McCann et al., 1990). Mental work can also increase sweet food consumption. Cognitively demanding tasks
increased chocolate intake by 15% compared to control condition (Wallis & Hetherington, 2004).
During the KBW task, participants had reported feeling stressed compared to the control condition which might explain the increase in energy intake (Chaput & Tremblay, 2007). A mental arithmetic problem that could not be solved (stress condition) vs. could be solved (control condition) was given to participants (Rutters, Nieuwenhuizen, Lemmens, Born, & Westerterp-Plantenga, 2009). The energy intake and energy intake from sweet foods were found to be higher under stressful mental work compared to the control condition. Psychological stress was stated to be associated with increased food intake without the presence of hunger, and participants had a preference for certain macronutrients (Rutters et al., 2009).
In school-aged children, snacks during the after-school period were found to provide 13% of the total daily energy intake and were more often energy-dense and with poor nutrient content (Gilbert, Miller, Olson, & St-Pierre, 2012). This after-school eating habit coincides with the moment of the day during which homework is performed. In fact, doing a lot of reading/doing homework was associated lower consumption of sugar drinks and snacks, and with higher consumption of vegetables and fruits (Utter, Neumark-Sztainer, Jeffery, & Story, 2003). When stress is taken into consideration, different patterns emerge. Teenage girls during school examination period were noticed to increase their energy intake whereas boys were observed to increase the level of fat intake (C. Michaud et al., 1990).
To our knowledge no study has investigated the effect of mental work on adiposity mediated by nutritional factors neither in adults nor in children. Michaud and colleagues (2015) studied different lifestyle habits, but lacked the nutritional aspect necessary to more completely understand the relationship. It is important to identify if any of these nutritional factors that are associated with homework could mediate the relationship between mental and adiposity while taking stress into consideration.
Article 1
Information
Title of the manuscript: Impact of Stressful Homework on Adiposity Profile in the QUALITY Cohort: A Longitudinal Approach
To be submitted to the Journal of School Health
No conflict of interest to declare and co-authors authorized inclusion of this manuscript in this dissertation
Author’s contribution
Thiffya Arabi Kugathasan is the first author of this manuscript whose contribution is primary for each section of the manuscript and from the beginning (literature review) to end (submission).
Pr Mélanie Henderson is the principal researcher of the QUALITY cohort. She helped in reviewing the article and provided her professional expertise on each component of the manuscript.
Pr Angelo Tremblay who has already worked on this topic (mental work and adiposity) brought his knowledge to the article.
Pr Marie-Eve Mathieu is the project mentor who guided and followed each step closely. She is the head of the laboratory.
ABSTRACT
BACKGROUND: At 8–10 years of age, perceived stressful homework duration was observed
to be associated with children’s adiposity profiles. Moderate-to-vigorous physical activity (MVPA) and screen time partly mediated this relationship. The current study aims to track these associations in those children at 10–12 years of age.
METHODS: Accelerometer, DXA, and questionnaires provided all necessary data for the
analyses. Using mediation models (PROCESS Macro), screen, sleep, and MVPA duration were investigated as potential mediators of the association between homework duration and adiposity in children (n = 361) at 10–12 years old, and over 2-year period.
RESULTS: At 10–12 years, only in girls not feeling stressed by schoolwork, homework was
positively associated with total and trunk fat percentages. Screen time mediated the relationship between homework and body mass index percentile in children. Longitudinal analyses revealed that sleep duration mediated the relationship between homework and trunk fat percentage changes over 2 years in children and in girls who were stressed.
CONCLUSION: At 10–12 years, perceived stressful homework was rarely associated with
adiposity and almost none of the mediating factors persisted in this relationship. Sleep with increasing homework duration should be further investigated in the prevention of pediatric obesity, especially in girls.
BACKGROUND
One of the emerging factors of obesity is principal occupation. In fact, males who have a sedentary occupation have a body mass index (BMI) that is 2.4% higher than males who perform strenuous physical occupations.1 It is possible that in addition to a reduction in energy expenditure, a cognitive component affects the adiposity profile in adults. In fact, a prospective study found that male workers who were under increased mental strain in their employment gained two times more weight than those under decreased or constant mental strain over a period of ten years.2 Stressful mental work was observed to affect dietary intake
3-6, which could lead to a positive energy balance and weight gain over time.
In children, our team is the only one to have noted that young boys (8–10 years) who performed long periods of stressful homework had higher adiposity than those who performed short-duration-homework, and this only when they reported feeling stressed by schoolwork.7 Interestingly, this was not observed in young girls of the same age under the same conditions, supporting the sex specificity found in adults’ study.2 In young children, a decrease in
moderate-to-vigorous physical activity (MVPA) was considered to partly mediate the relationship between stressful perceived stressful homework and adiposity.7
As children age, they opt for unhealthy behaviors such as becoming physically inactive.8-10 At 10–12 years of age, their physical activity levels are below recommended levels, with girls’ physical activity levels being much lower than boys11 during recess12 and in the after-school period.10 Also, children aged 11 to 14 years spend more time doing their homework, a sedentary behavior requiring mental work, than younger ones.13 How these changes influence the relationship between mental strain and childhood adiposity remains unknown.
Other lifestyle habits such as screen time and sleep duration also have an impact on the adiposity profile of children. Screen time was associated with increased risk of obesity14,15, and short sleep duration with obesity.16 Long homework duration has been shown to be one of the factors related to shorter sleep duration in children aged 8 to 17.17 Only one study observed the effect of mental strain on screen time and sleep duration and subsequently on adiposity.7 The authors reported that screen time, but not sleep duration mediated the relationship between mental work such as homework and adiposity profile. As children age, they increase their screen time18 and decrease their sleep duration19,20. It is therefore important to
re-investigate the impact of mental workload on sleep and screen time, and consequently on the adiposity profile in older children.
There is very little data in the literature regarding mental strain and adiposity profiles of children over 10 years of age, and no study has addressed all lifestyle activities as potent mediators. As a result, the purposes of this study were to (1) examine the relationship between mental work and adiposity indicators in children at 8–10 and 10–12 years old while stress level is considered or ignored and (2) determine whether screen time, MVPA and/or sleep duration mediate these associations.
METHODS Participants
Data was extracted from the first (V1) and second (V2) visits of the QUebec Adiposity and Lifestyle InvesTigation in Youth (QUALITY) cohort21,22: V1 when children were 8–10 years of age (July 2005 to December 2008), whom we will be referring to as young children, and V2, two years thereafter (July 2007 to March 2011), whom we will refer to as older children. This cohort is composed of Caucasian children with at least one obese biological parent at recruitment (parental obesity defined by: BMI ≥ 30 kg/m2 or waist circumference ≥
88 cm for women and ≥ 102 cm for men).23
Anthropometric measurements
Anthropometric measurements included height and weight obtained according to standardized methods24, and BMI in percentile interpreted according to the U.S. Centers for Disease Control and Prevention growth charts.25 Dual-energy X-ray Absorptiometry (DXA) (Prodigy Bone Densitometer System, DF114664, GE Lunar Corporation, Madison, WI, USA)26 was used to determine total and truncal body fat percentages.
Lifestyle activities profile
Average daily MVPA duration was calculated using accelerometry (Actigraph LS 7164 and CAL71 calibrator, Actigraph LLC, Pensacola, FL, USA). It had to be worn for seven consecutive days from the time children were awake to the time they went to bed. They had to remove the accelerometer when doing a water-based activity such as showering, swimming and bathing. Periods of non-wear were excluded from the analyses defined as 60 consecutive minutes during which the activity intensity count was equal to zero; children were allowed 1–2 minutes of 0–100 counts.8 Children who failed to wear the accelerometer more
than 4 days for at least 10 hrs/day27,28 were excluded from the analyses, both for MVPA and sleep levels. Based on self-reported television time (including video movies) on weekends and weekdays, a mean score over seven days was calculated and used as an indicator of average daily screen time. Average daily sleep duration was obtained by calculating the mean difference between the time at which the accelerometer was removed at bedtime and the time at which it was reattached to the child the following morning.
Homework profile
Children filled out a questionnaire with a research assistant’s help, and answered the following questions to obtain daily homework duration and concerns about schoolwork7: 1) “How many hours do you usually spend on homework in a single day (including homework on the computer)?”. From this data, average time spent doing homework per day was calculated, and was kept on a continuous scale. 2) “During the past 3 months, have you been worried or stressed by schoolwork?”. Depending on their answer, homework was considered as either “perceived non-stressful” if answered, “not at all”, or “perceived stressful” if reported a little bit, quite a bit or a whole lot.
Data Analysis
All analyses were performed using SPSS Statistics software (IBM, Armonk Corp., NY, USA) version 24.0. The characteristics of the cohort were analyzed as follows: Independent sample t-test to evaluate whether there were significant sex differences in children at V1 only and an ANOVA for repeated measures to analyze any significant changes between V1 and V2, and boys vs. girls in all variables (visit x sex). In addition, Chi-square was used to analyze sex differences and McNemar test for longitudinal changes in stress-related schoolwork data since it is a dichotomous variable. After applying the log-transformation on homework, sleep, and screen duration data, regression and mediation analyses (PROCESS macro for SPSS, v2.16)29 was used to examine if any lifestyle habit was a mediator between homework duration and adiposity at V1, V2, and from V1 to V2 (difference between both visits (V2-V1)). The direct effect (c’), which is the remaining effect of the total effect after taking into consideration a mediating factor, is reported in the figures. Potential mediators were considered individually, one at a time, and the bootstrapped confidence intervals (CI) for indirect effects were used to determine which of those habits was a mediator (CI must be exempt of 0 to be considered
significant). Unstandardized beta coefficients (β) between two variables and their P values are reported.
Statistical significance was set to a p-value of < 0.05. Not all children from V1 were present at V2 (loss to the follow-up), thus children who were not present at V2 were excluded from the 10–12 years old and longitudinal analyses. Independent sample t-test was used to examine the differences between children, who were included vs. excluded from V1 for the subsequent analyses.
RESULTS
Outliers [homework = 5.86 hrs/day (n = 1 in V2) and sleep = 3.18 hrs/night (n = 1 in V1)] were excluded, and there was no significant difference in all the variables between the included vs. excluded children from V1 (p > 0.05).
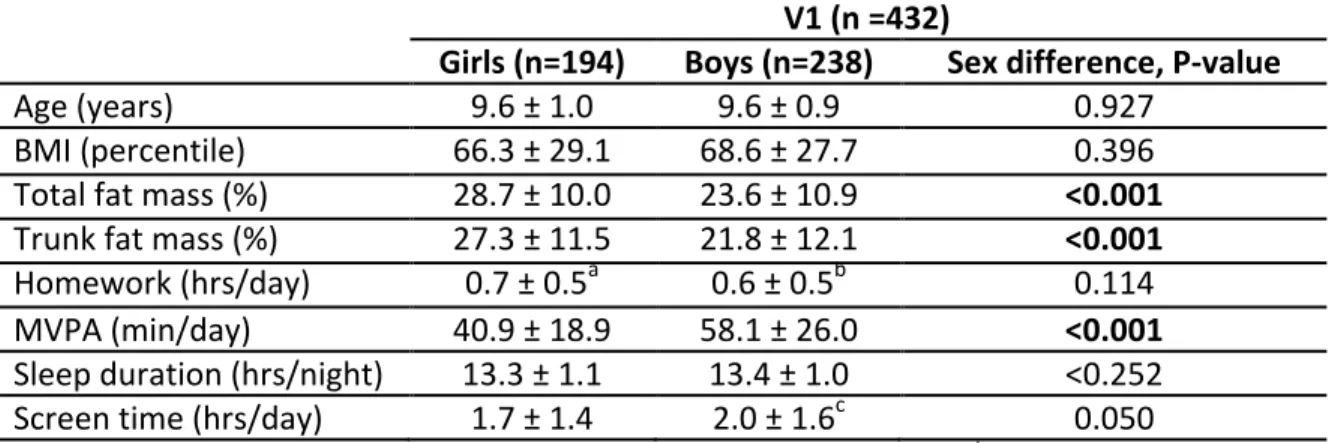
Participants’ characteristics
At V1 (n = 432), total fat and truncal fat percentages were significantly greater in girls than in boys [t(430) = -5.078 and t(430) = -4.803 respectively, both p < 0.001] (Table 1). MVPA was significantly lower in girls than in boys [t(430) = 7.687; p < 0.001]. From V1 to V2 (n = 361), all parameters except BMI percentile changed significantly (Table 2), and most shifted towards poor habits (all p < 0.05). Significantly higher total and trunk fat percentages in girls than in boys independently of the visit were observed [F(1, 359) = 9.891, p = 0.002 and F(1, 359) = 9.011, p = 0.003 respectively]. Homework duration increased by 42.9% in girls and 50.0% in boys between both visits. Significantly more children were stressed at V2 than at V1 (p = 0.025), but no sex differences were found at V1 (p = 0.104) or V2 (p = 0.069). Boys accumulated significantly more minutes of MVPA than girls independently of the visit [F(1, 359) = 54.740, p < 0.001].
Mediation analyses at V1 (at 8–10 years old)
At V1, using a continuous scale for homework duration showed that when a child’s stress status was not considered, from the mediation models, homework duration was positively associated with total fat and trunk fat percentages (total effect) (β: 10.983, p = 0.019; β: 13.380, p = 0.011 respectively). In addition, the relationship between homework duration and all three adiposity indices (total fat percentage, trunk fat percentage, BMI) in those children was mediated (indirect effect) by MVPA (CI: [0.760, 6.697], [0.768, 7.017] and [0.623, 9.403], respectively) and screen time (CI: [0.025, 3.377], [0.024, 3.749] and [0.262,
9.621], respectively). As homework duration increased, children decreased their MVPA duration, which was associated with increased adiposity indicators (BMI shown, Figure 1). As for screen time, it increased with increased homework duration and was associated with increased adiposity indicators (BMI shown, Figure 1). In girls only, homework duration was positively associated with trunk fat percentages (β: 15.577, p = 0.027). Also, screen time was a mediator. It increased with increasing homework duration and was positively associated with all adiposity indicators (CI: [1.084, 8.951], [1.125, 10.380], and [1.739, 23.024], respectively). In boys, no association between homework duration and adiposity was observed (all p > 0.05), and none of the lifestyle habits mediated this relationship.
At V1, when stress status was considered and only when present, the following were observed from the mediation models: In children, perceived stressful homework duration was positively associated with all three indicators (β: 18.680, 21.882 and 44.768 respectively; all p < 0.05), and screen time was a mediator with total trunk fat percentage and BMI only (CI: [0.025, 6.831] and [1.728, 21.195], respectively). As perceived stressful homework duration increased, screen time increased which excludes time spent in front of a screen for homework purpose, and was associated with increased adiposity indicators. In girls, perceived stressful homework duration was positively associated with all three adiposity indicators (β: 19.130, 24.250 and 52.473 respectively; all p < 0.05), and screen time was the mediator (CI: [2.194, 16.458], [1.496, 18.189] and [5.770, 51.846], respectively). As perceived stressful homework duration increased, screen time increased and was subsequently associated with increased adiposity indicators (trunk fat percentage shown, Figure 2). In boys, regardless of stress status, none of the mediating factors were significant.
Mediation analyses at V2 (10–12 years old)
In children, when stress status was not considered in the mediation model, although homework duration was not directly associated with BMI (p > 0.05), screen time mediated the relationship between homework duration and BMI (CI: [-8.713, -0.031]). As homework duration increased, screen time decreased, which was associated with decreased BMI (Figure 1). This was the only exception since the other mediating factors observed at V1 did not persist. In girls, in those who reported not feeling stressed, homework duration was positively associated with total and trunk fat percentages (β: 25.459, p = 0.009; β: 30.233, p = 0.006 respectively).
Mediation analyses from V1 to V2
In the longitudinal analyses, in children who claimed to be stressed by their homework at both visits, sleep duration changes mediated the relationship between homework duration and trunk fat percentage changes (CI: [-2.914, -0.443]). As children increased their perceived stressful homework duration between both visits, they decreased their sleep duration, which was associated with decreased trunk fat percentage (Figure 3). In those who reported not feeling stressed at both visits, homework duration changes was negatively associated with screen time (β: -0.476; p = 0.009). In girls who reported feeling stressed at both time points, sleep time changes was also a mediator (CI: [-3.800, -0.217]), i.e. with increase in homework duration, sleep duration decreased (β: -0. 070) which was associated with a decreased trunk fat percentage over time (β: 24.619). In boys who initially reported feeling stressed, but did not feel stressed at V2, an increase in homework duration was positively association with the trunk fat percentage (β: 18.787; p = 0.024). In those who reported not feeling stressed at both visits, homework duration changes were negatively associated with screen time changes (β: -0.538; p = 0.008).
DISCUSSION
Few studies have examined mental work as a potential obesogenic factor in the pediatric population. The current study adds to the current literature by examining mental work, lifestyle habits, and adiposity profiles in older children. Our results show that in 10-12-year-old girls who did not feel stressed by schoolwork, adiposity indicators (total and trunk fat percentage) worsened with increasing homework duration. Contrary to what was hypothesized, almost no lifestyle habits (MVPA and sleep duration) mediated the relationship between homework duration and adiposity profile in older children. The only exception was screen time. When stress status was not considered, it mediated the relationship between homework duration and BMI. The longitudinal analyses revealed that children who were stressed by schoolwork since ages 8–10 and increased their homework duration decreased their sleep duration, which was associated with an improved trunk fat percentage. Sex analyses revealed that this result was also true in girls who were stressed at both time points.
The relationship between mental work and adiposity profile has been studied in adults. As mentioned earlier, males under increased mental strain over a period of 10 years had doubled the body weight gain observed in those under decreased or constant mental strain.2 A