HAL Id: hal-01734879
https://hal-mines-paristech.archives-ouvertes.fr/hal-01734879
Preprint submitted on 15 Mar 2018
HAL is a multi-disciplinary open access
archive for the deposit and dissemination of
sci-entific research documents, whether they are
pub-lished or not. The documents may come from
teaching and research institutions in France or
abroad, or from public or private research centers.
L’archive ouverte pluridisciplinaire HAL, est
destinée au dépôt et à la diffusion de documents
scientifiques de niveau recherche, publiés ou non,
émanant des établissements d’enseignement et de
recherche français ou étrangers, des laboratoires
publics ou privés.
The decarbonized pathways of post-Paris climate policy
Sandrine Selosse, Nadia Maïzi
To cite this version:
Sandrine Selosse, Nadia Maïzi. The decarbonized pathways of post-Paris climate policy. 2018.
�hal-01734879�
cahi
e
rs
ch
a
ire
les
de la
chaire modélisation prospective au service du développement durable
The decarbonized pathways
of post-Paris climate policy
Sandrine Selosse and Nadia Maïzi
MINES ParisTech, PSL Research University,
Centre for Applied Mathematics
Rue Claude Daunesse, CS 10207,
06904 Sophia Antipolis, France
W
Working Paper
N°2017-01-25
contents
W
Working Paper N°2017-01-251- Introduction
2- Modeling Approach
3- Results
3-1 - Convergence with the 2°C objective and burden sharing
3-2- technological choices in mitigation efforts
3 www.cma.fr
The decarbonized pathways
of post-Paris climate policy
Sandrine Selosse* and Nadia Maïzi
MINES ParisTech, PSL Research University, Centre for Applied Mathematics, Rue Claude Daunesse, CS 10207, 06904 Sophia Antipolis, France
W
Working Paper N°2017-01-25The historic climate agreement adopted by all countries in December 2015 marks a turning point towards a decarbonized world. Applying a long-term prospective approach, and more precisely the bottom-up optimiza-tion model TIAM-FR, we investigate different greenhouse gas emissions mitigaoptimiza-tion trajectories to discuss these pathways and the corresponding technological solutions in global and regional perspectives. The contribution to GHG mitigation varies according to regions’ development; as the technological choices regarding climate constraints and the evolution of the energy system. Climate constraints tending toward a 2°C objective involve significant decarbonization of the power system with considerable investments in renewable energies in the lower and higher constraints, as well as in carbon capture and storage technologies (CCS), notably bio-energy and CCS (BECCS). CCS technologies start to be installed when climate constraints are high (2°C) but not in scenarios expressing national pledges. It is interesting to note that in case of a ban on BECCS, the latter is compensated not by a higher development of fossil CCS technologies, but by an increase in renewable energies.
Keywords
Paris Agreement; Nationally Determined Contributions; Equity; Energy system; Decarbonization; Carbon capture and storage
Acknowledgements
This research was supported by the Chair Modeling for sustainable development, driven by MINES ParisTech, Ecole des Ponts ParisTech, and AgroParisTech, supported by ADEME, EDF, GRTgaz, SCHNEIDER ELECTRIC and the French Ministry of Ecology, Sustainable Development and Energy.
Abstract
1- Introduction
W
Working Paper N°2017-01-25Spurred by significant awareness and following decades of negotiations and regional divisions, a historic climate agreement was adopted by all 195 parties at the UN-FCCC, on December 12, 2015, to respond to climate issue. The 21st Conference of Parties (COP 21) then marked a decisive stage in the transition to a decar-bonized world, with countries calling for a more ambi-tious long-term goal. With new words for a new world, they recognized the 1.5°C goal (without formalization) as the main long-term objective of the Agreement, and the need for net-zero emissions, implying phasing out fossil fuel use in the long-term. This historical agreement marked a major milestone in climate policy and in the transition initiated by the (Intended) Nationally Deter-mined Contributions ((I)NDCs). Indeed, all countries signed the agreement and almost all countries submitted their NDCs to UNFCCC, representing more than 98% of global GHG emissions. Notably, the ten largest CO2 emitters, representing nearly 76% of global emissions, submitted their contribution: by order of issue, China, USA, Europe (a single contribution for the 28 Member States), India, Russia, Japan, South Korea, Canada, In-donesia and Saudi Arabia. Considering these NDCs, and despite the unprecedented international mobilization, the world might still be heading towards a rise of between 2.7 and 3 degrees Celsius (Luomi, 2016) or, according to Climate Action Tracker, between 2.4 and 2.7°C in the case of full implementation of the NDCs (Climate Action Tracker). Thus, to ensure that we remain on a compatible trajectory with the 2°C or 1.5°C boundary, the Paris Agreement requires that each country review these NDCs every five years from 2020, with no reduction of targets and with encouragement for individual states to be more ambitious. In addition, GHG emissions need to peak as soon as possible, so that countries must aim to achieve neutral emission in the second half of this cen-tury.
NDCs outline their pathways until 2030, involving several potential long-term pathways. The first aim of this study is to explore some of these pathways considering the level of regional mitigation. To achieve this objective nec-essarily requires gradually phasing out the most polluting fossil fuels. The most advanced economies have already included renewable energy in their energy mix, and have planned to increase its use to achieve their mitigation objectives. The European Union anticipates that renew-ables will reach 27% of its final energy consumption. Japan aims to obtain 22-24% of its electricity from
re-newable sources in 2030, China 15% of non-fossil in TPES by 2020 and 20% by 2030, and India 40% of its power supply capacity from renewables in 2030. Bioen-ergies are also highlighted to diversify the energy mix and contribute to mitigating CO2 emissions, as illus-trated for example by the Indian objective of a 20% min-imum blending rate of biofuel (Kang et al., 2015). Indeed, energy and climate change challenges call for an evolution in the global energy system, especially in the technological mix required to satisfy energy de-mands and in response to climate issues and policy. In-troducing carbon capture and storage (CCS) increasingly appears inevitable to bring down future CO2 emissions in line with the limit of a 2°C temperature increase. This is all the more so if fossil fuels are to remain the dominant source of energy over the next decades, resulting in a drastic increase in GHG emissions to reach unsustain-able levels. Indeed, CCS are still presented as a solution to reach ambitious climate targets, despite persistent controversies in terms of significant and uncertain costs, insufficient investment and progress in terms of plausi-ble, large-scale deployment, and also of infrastructures (i.e. transport, shared platform), support for incentives in comparison with other options, such as renewables, or the risks to environment and human health that question the social acceptability and the appropriate place of CCS within the portfolio of GHG abatement strategies. The combination of bio-energy carbon capture and geologic storage (BECCS) is also the focus of increasing atten-tion, as this alternative offers an unique opportunity for net carbon removal from the atmosphere while fulfilling energy needs (Obersteiner et al., 2001). When stringent targets are applied, negative emissions become a valu-able option (Azar et al., 2010; Katofsky et al., 2010; Luckow et al., 2010; Ricci and Selosse, 2013, van den Broek et al., 2011; van Vuuren et al., 2007, 2009). The aim of this study is to analyze different paths of GHG emission mitigation targets. We investigate different mit-igation trajectories according to an ambitious ultimate and global target by 2050 in line with the 2°C objective, commitments resulting from the Paris Climate Agree-ment, and regional assumptions by 2050 according to the optimistic/pessimistic revisions of long-term com-mitments. Then, we discuss possible futures for the next climate regime. We also focus on the energy system, no-tably investigating different constraints on the use of BECCS.
5 www.cma.fr
The decarbonized pathways of post-Paris climate policy
2- Modeling Approach
This research is developed with TIAM-FR, the French ver-sion of the TIMES Integrated Assessment Model, a widely used, linear programming TIMES family model developed under the IEA’s Energy Technology Systems Analysis Pro-gram (ETSAP). TIAM-FR is a bottom-up model, depicting the world energy system with a detailed description of dif-ferent energy forms, technologies and end-uses consti-tuting the Reference Energy System (RES). The RES network links these commodities to several thousand ex-isting and future technologies characterized by their eco-nomic and technological parameters in all sectors of the energy system (agriculture, industry, commercial, residen-tial and transport; taking into account conversion and the electricity sector). Driven by end-use demand, it aims to supply energy services at minimum global cost by simul-taneously making decisions on equipment investment and operation, primary energy supply, and energy trade. It minimizes the total discounted cost of the world energy system over a long time period under environmental, technical and demand constraints. Geographically inte-grated, TIAM-FR offers a representation of the global en-ergy system in 15 regions. In each region, TIAM-FR computes a total net present value of the stream of the total annual cost, discounted at 5% to the selected refer-ence year 2010 and describes the energy system with the same level of technological disaggregation. These re-gional discounted costs are then aggregated into a single total cost which is the objective function to be minimized by the model while satisfying a number of technological and/or environmental constraints. The demands projec-tion of the five energy service sectors is based on socio-economic assumptions specified by user (GDP, household, population, sectorial growth, and industrial production.) over the time horizon. The structure of the energy system is given as an output: future investments, type and capacity of the energy technologies, energy con-sumption by fuel, emissions, energy trade flows between regions, etc. TIAM-FR integrates several CCS technolo-gies derived from fossil or bioenergy resources. In the power sector, it considers two capture technologies for bioplants: pre-combustion for the biomass gasification process, and post-combustion for the direct combustion process. Biomass co-firing in coal power plants has also been implemented, with and without carbon capture.
We investigated alternative scenarios according to as-sumptions concerning: the long-term UNFCCC 2°C ob-jective on the one hand, and the Paris Accord with the NDCs on the other hand. More precisely, we considered the Post-Paris pledges for 2030 and made assumptions on the 2050 targets. We then compared these pledges to global scenarios compatible with the 2°C objective. As re-gards the latter, three scenarios express this goal accord-ing to a range of uncertain pathways of reduction percentage of GHG emission by 2050 compared to 2010: • UNFCCC-40: 40%;
• UNFCCC-50: 50%; • UNFCCC-70: 70%.
Concerning the commitments occurring according to the Paris Accord for 2030, we consider low and high targets (conditional and unconditional) for the period. The various scenarios we investigate include environmental targets for different world regions over the period 2010-2050. We an-alyze a combination of these scenarios in order to provide a framework for understanding the climate context of the future regime depicted by the Paris Accord. This combi-nation gives us the different trends of the ambition: • NDCs-2050-lolo: lower 2030 GHG targets and lower 2050 assumptions;
• NDCs-2050-loup: lower 2030 GHG targets and higher 2050 assumptions;
• NDCs-2050-uplo: higher 2030 GHG targets and lower 2050 assumptions;
• NDCs-2050-upup: higher 2030 GHG targets and higher 2050 assumptions.
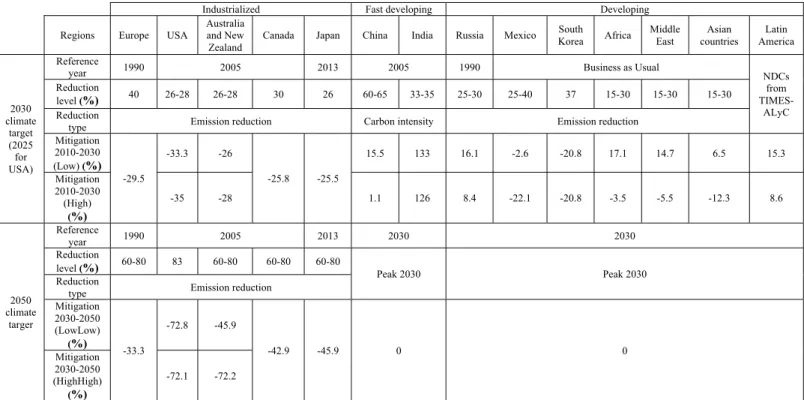
Almost all countries have submitted and published their contributions to reduce GHG emissions under the NDCs, and notably, the three largest GHG emitters, China, USA, and Europe, representing nearly 54% of global emissions. With its commitment to reduce its carbon intensity by 60%-65% by 2030 in comparison with its 2005 level, China foresees a peak in its emissions by 2030. USA has committed to contributing a 26-28% reduction by 2025 compared to 2005, and Europe to a reduction of at least 40% by 2030 compared to 1990. Table I presents the dif-ferent NDCs of our 15 modeled regions, based on their climate targets pledged under the Paris Accord by 2030, and the different assumptions for 2050.
W
Working Paper N°2017-01-25Industrialized Fast developing Developing Regions Europe USA
Australia and New Zealand
Canada Japan China India Russia Mexico South Korea Africa Middle East Asian countries Latin America 2030 climate target (2025 for USA) Reference
year 1990 2005 2013 2005 1990 Business as Usual NDCs from TIMES-ALyC Reduction level (%) 40 26-28 26-28 30 26 60-65 33-35 25-30 25-40 37 15-30 15-30 15-30 Reduction
type Emission reduction Carbon intensity Emission reduction Mitigation 2010-2030 (Low) (%) -29.5 -33.3 -26 -25.8 -25.5 15.5 133 16.1 -2.6 -20.8 17.1 14.7 6.5 15.3 Mitigation 2010-2030 (High) (%) -35 -28 1.1 126 8.4 -22.1 -20.8 -3.5 -5.5 -12.3 8.6 2050 climate targer Reference year 1990 2005 2013 2030 2030 Reduction level (%) 60-80 83 60-80 60-80 60-80 Peak 2030 Peak 2030 Reduction
type Emission reduction Mitigation 2030-2050 (LowLow) (%) -33.3 -72.8 -45.9 -42.9 -45.9 0 0 Mitigation 2030-2050 (HighHigh) (%) -72.1 -72.2
Table I: Overview of GHG emissions constraints from NDCS by 2030 and 2050
We also consider an emission reduction of 25-30% by 2030 compared to 1990 for Russia, an emission reduction of 25-40% % by 2030 compared to their BAU level for Mexico, and an emission reduction of 37% by 2030 compared to their BAU level for South Korea. For Africa, Middle East and the other Asian developing countries, we assume a GHG emis-sion of 15-30% by 2030 compared to their BAU level. For Latin America, we implement the targets extracted from TIMES-ALyC, the TIMES model of Latin America and the Caribbean (Postic, 2015; Postic and al., 2016). Each NDC is implemented individually in the TIMES-ALyc model so that we can determine the level of GHG emissions to mitigation by 2030. The aggregated target for the whole region Central and South America is then implemented in TIAM-FR.
It is interesting to note what these targets mean in terms of emissions levels and, if we translate them to the same refer-ence year (2010), and follow the same type of reduction (emission mitigation). Table 1 also highlights the GHG emis-sions level that the regions undertake not to exceed (high or low) and the evolution that these pledges involve from 2010 to 2030. Europe has pledged a 40% reduction in GHG emis-sion by 2030 compared to 1990 levels; this commitment rep-resents a reduction of 29.5% by 2030 compared to 2010, against 33.3% in the low case and 35% in the high case for the USA. China’s reduction of carbon intensity by 60% and 65% by 2030 compared to 2005 is equivalent to limiting the increase of its CO2 emissions by 15.5% in 2030 compared to 2010 in the low case and by 1.1% in the higher case. In India, between 2010 and 2030, the limitation of increase is 133% in the low case and 126% in the high case. This is due to wide variations in GDP projections. Note the significant re-duction represented by Mexican and South Korean commit-ments (based on BAU level), i.e. 22% and 21% of reduction
respectively in 2030 by comparison with 2010 in the high case. In Latin America, the NDCs are equivalent to an in-creased limitation of GHG emission, with an augmentation of between 15.3% and 8.6% over the period. In Africa, Middle East and Asian countries, the high case of commitments in-volves a reduction of GHG emissions by 3.5%, 5.5% and 12.3% respectively, against a limited increase in the lower case.
The commitments to GHG emissions mitigation pledged by developed and developing countries cover 98% of 2005 global emissions. The major question is to determine what will happen after 2030. Decisions adopted emphasize the need to radically increase the ambition of pledges beyond 2020 to cut GHG emissions in order to achieve the objective of 2°C. To place us on a compatible trajectory with this 2°C boundary, the Paris agreement requires that each country re-view these NDCs every five years from 2020, without reducing the targets and with active encouragement for states to do better. In addition, GHG emissions must peak as soon as pos-sible, and countries should aim to achieve neutral emission in the second half of this century. Then, for the long-term pathways, we assumed low and high targets for industrialized countries, i.e. 60% and 80% reduction in GHG emissions by 2050 compared to their official reference year. For the United States, we considered the target indicated in the Copenhagen Accord. In its NDCs, China committed to reach a peak in its emissions by 2030. For all other regions, we assume an emis-sions peak by 2030.
We analyze a combination of these scenarios to provide a framework for understanding the climate, technological and energy resources context of the future regime that is expected to be followed after 2020.
7 www.cma.fr
The decarbonized pathways of post-Paris climate policy
3. Results
3.1. Convergence with the 2°C objective and burden sharing
Current climate pledges do not yet correlate with the agreed global objective, and are still far from the “well below” 2°C objective. However, the Paris Agreement initiates the stabilization of GHG emissions. NDCS would achieve rel-ative stabilization of GHG emissions by 2030 in comparison with 2010 levels, while a drastic reduction is expected to be in line with the 2°C objective, whatever the strength of the UNFCCC scenarios (Figure 1 and 2). In the long term, although the direction seems right, a move to a higher level is necessary. The issue is to determine the level of mitigation that each region should target to globally reach a decarbonized pathway consistent with the climate change fight.
The principle of common but differentiated responsibilities played a major role in negotiations and is still active in structuring post-2020 negotiations. However, an ambitious emission mitigation objective does not seem realistically achievable without significant contribution from developing countries, especially in terms of technological challenges. Considering the targets pledged by countries under the framework of the Conferences of Parties, three groups of countries can be distinguished according to the level of their commitments:
"Industrialized countries", considered as responsible for past, present and future climate change, and committed •
to absolute emissions reduction targets (Europe, USA, Japan, etc.).
"Fast-growing countries", considered as responsible for present and future climate change, and committed to •
relative targets (in relation to their level of growth; China and India).
"Developing countries", considered as responsible for future climate change and/or vulnerable countries, some •
of which are committed to absolute emissions reduction targets, while others implement national actions, and some are committed to a relative mitigation target (according to BAU level).
In 2005, industrialized countries represented 48% of the world’s GHG emissions against 25% for fast-growing coun-tries and 27% for developing councoun-tries. In 2010, they represented 36%, 29% and 34% respectively. Thus, the miti-gation challenge is a fair way of determining countries’ contributions, and particularly those of developing countries, and so, burden sharing. Their participation is essential to reach an ambitious target, and industrialized and fast-grow-ing countries must assume their responsibility for GHG emissions and contribute as far as they are able. But are these implemented targets in line with the principles of equity and common but differentiated responsibilities?
W
Working Paper N°2017-01-25Figure 1 highlights the contribution of each regional group to reach their climate target in comparison with the business as usual (BAU) scenario. Thus, in 2050, 28 Gt of GHG are expected to be avoided in the NDCs-2050-lolo scenario by comparison with the BAU 2050 level of emission. In other words, climate target pledges in NDCs-2050-lolo implies reaching a GHG emissions level of 34 Gt by 2050 instead of 62 Gt of expected GHG emission if nothing is done, as in the BAU scenario, i.e. a GHG emission reduction of 28Gt. The NDCs-2050-upup scenario allows a reduction of 32.8 Gt of GHG emissions. In these scenarios, the contribution to GHG mitigation varies according to the region. Thus, indus-trialized countries reduce their GHG emissions from 8.4 Gt to 10 Gt respectively in the lower and higher NDCs scenarios, fast-growing countries from 12 Gt to 13.4 Gt, and developing countries from 7.6 Gt to 9.6 Gt.
In NDCs-2050-lolo, industrialized countries represented 37% of the world’s GHG emissions against 39% for fast-growing countries and 24% for developing countries in 2030 but respectively 13%, 45% and 42% in 2050. In NDCs-2050-upup, industrialized countries represented 35% of the world’s GHG emissions against 39% for fast-growing countries and 26% for developing countries in 2030 but respectively 10%, 48% and 43% in 2050. This highlights the limits of the im-pact of industrialized countries’ decarbonization with the aim of drastically reducing global GHG emission levels and the importance of the contribution of developing countries, China and India.
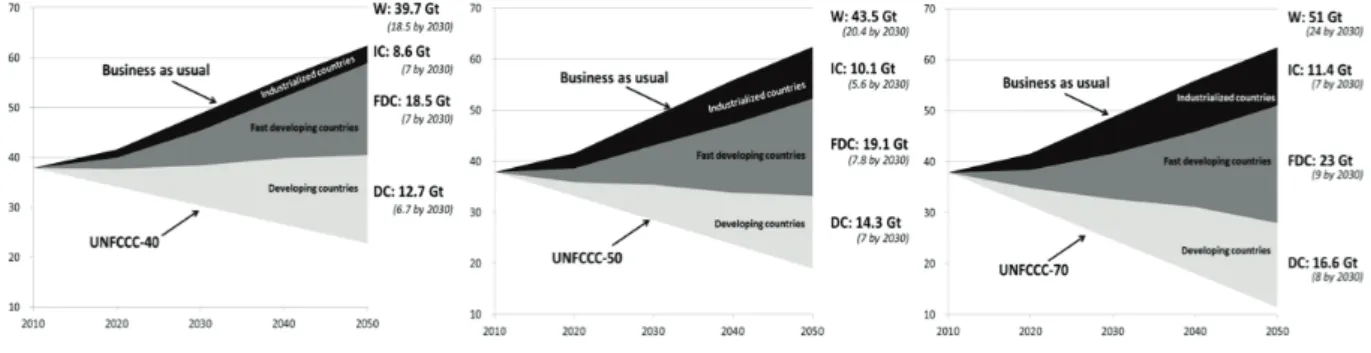
At the global level, in the UNFCCC scenarios, from 39.7 Gt to 51 Gt of GHG have to be avoided in 2050 to be in the range of the 2°C objective. 43.5 Gt of GHG emissions are expected to be avoided in UNFCCC-50 by 2050 by comparison with the BAU level. These GHG emissions mitigations also obviously result from different regional contributions (Figure 2). Industrialized countries reduce their GHG emissions by 8.6, 10.1 and 11.4 Gt, respectively in the UNFCCC-40, UN-FCCC-50 and UNFCCC-70 scenarios; fast-growing countries by 18.5 Gt, 19.1 Gt and 23 Gt, and developing countries by 12.7 Gt, 14.3 Gt and 16.6 Gt.
Figure 2: Regional contribution to GHG emissions mitigation (Gt) in UNFCCC scenarios
Indeed, the level of the contribution from fast-growing countries, but also largely from developing countries, increases with the strength of the climate target. This is less the case for industrialized countries, whose contributions are at the same level in NDC scenarios as can be expected in the global UNFCCC objective scenario (especially UNFCCC-40 and UNFCCC-50). At this level, the energy system used by industrialized countries is well advanced in terms of decar-bonization and it appears difficult to significantly reduce their GHG emissions. Note that this level of contribution cor-responds to that of developing countries in the NDC scenarios. However, contribution equality does not mean equity.
9 www.cma.fr
The decarbonized pathways of post-Paris climate policy
3.2. Technological choices in mitigation efforts
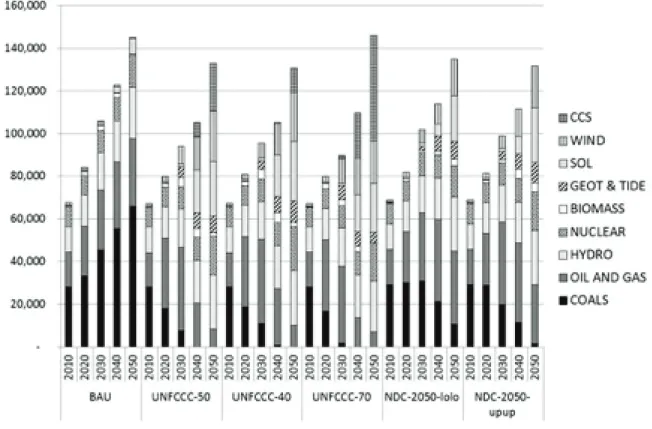
Over the entire time period, in the BAU scenario, the global power mix is dominated by fossil fuels, followed by hydro and nuclear, at respectively 66%, 18% and 14% of electricity generation in 2010 and respectively 67%, 16% and 10% in 2050. Renewables represent less than 2% of world production in 2010. Their share increases in 2050 to 7% in the BAU (Figure 3). When climate constraints tend toward a 2°C objective, significant decarbonization of the power system takes place, whatever the UNFCCC scenario. Such a transformation of the system involves considerable investments in renewable energies and carbon capture and storage technologies. The CCS option is particularly deployed in the more constrained scenario, where it appears as early as 2030, against 2040 in UNFCCC-50 and to a lesser extent in UNFCCC-40. Furthermore, the stronger the climate constraint is, the greater the CCS development is.
Figure 3: World electricity production by scenario (PJ) – Pathways to a decarbonized world
Considering the NDCs scenarios, an important result is the fact that the CCS technology is not developed. To reach the climate target, the decarbonization of the power system results from the integration of renewable energies, in the lower and higher cases. Coal production of electricity is drastically reduced over the time period, but oil and gas plants are still used to produce electricity. In NDCs-2050-lolo, fossil fuels represent 33% in 2050. Hydro and nuclear represent 19% and 11% in 2050 respectively. Renewables reach 35% of the power mix (including geothermal, tide and wave) and bioplants generate 2% of the world’s electricity. In NDCs-2050-upup, in 2050, fossil fuels represent 22%, hydro 19% and nuclear 14%. Renewables reach 41% and biomass 3%.
In 2050 the global renewable production of electricity represents 47% in UNFCCC-40, 43% in UNFCCC-50 and, 32% in UNFCCC-70. CCS technologies represent respectively 9%, 17% and 34% in these scenarios. The development of CCS technologies is, to a large extent, BECCS. An interesting question could be to determine whether CCS remains competitive in the face of renewable energies, if BECCS, and thus negative emissions, is not deployed.
W
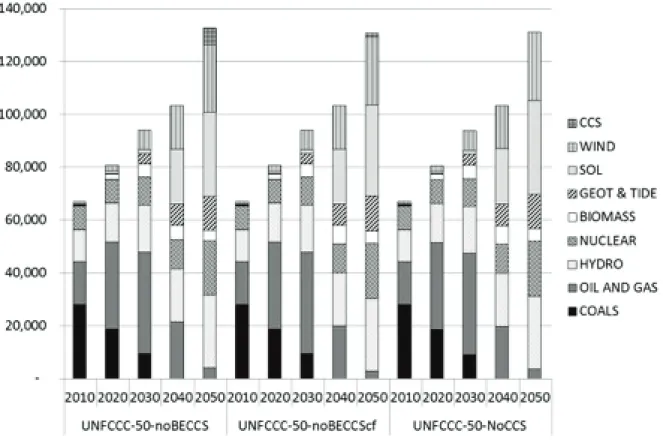
Working Paper N°2017-01-25Focusing on the intermediate global climate scenario, UNFCCC-50, Figure 4 highlights the power mix according to technological availability. More precisely, in UNFCCC-50-noBECCS, BECCS is forbidden but CCS in fossil plants is allowed, including firing coal/biomass plants. In UNFCCC-50-noBECCScf, BECCS is forbidden, such as co-firing coal/biomass plants, but CCS in fossil plants is allowed. In UNFCCC-50-noCCS, CCS is forbidden, whatever the plant. It is interesting to note that the BECCS ban is not compensated by greater development of fossil CCS, but by an increase in renewable energies. In UNFCCC-50-noBECCScf, fossil CCS represents a small part of the mitigation option, and the renewables share increases again.
Figure 4: World electricity production by scenario (PJ) – Sensitivity to BECCS availability
As shown in section 3, the contribution to GHG mitigation varies according to the region, depending on whether it includes industrialized, fast-growing or developing countries. The same is true in terms of technological choices to deal with climate constraints and the evolution of the energy system. Concerning the power mix in 2050 in indus-trialized countries, interesting results consist in the significant development of CCS technologies in the UNFCCC scenario – representing 38%, 16% and 5% respectively in UNFCCC-70, UNFCCC-50 and UNFCCC-40 – and the fact that no CCS is developed if BECCS is forbidden. In this case, in UNFCCC-50-noBECCS, investments are made in bioplants. In the NDCs scenario, the reduction of GHG emission involves greater development of renewable en-ergies but no development of CCS, whatever BECCS of fossil CCS.
In China and India, significant investments are made in CCS technologies and particularly in BECCS. The strength of the climate constraints supported by this region involves the need to benefit from negative emissions.
Unlike industrialized countries, if BECCS is banned, India and China still develop CCS technologies, to a larger extent co-firing plants in UNFCCC-70-NoBECCS. In UNFCCC-70-NoBECCScf, where BECCS and co-firing CSS are forbidden, CCS technologies remain an important option for attaining carbon constraints. Note that renewable energies are largely developed in all climate constraint scenarios, even in NDCs scenarios. However, in the NDCs scenarios, CCS technologies are not developed.
In developing countries, the decarbonization of the energy system is possible thanks to the significant development of CCS technologies in the global UNFCCC scenarios and the integration of renewables in the system in NDCs scenarios.
In 2050, in NDC-2050-lolo, renewables represent 9% of power generation, and 19% in NDC-2050-upup. Hydro-electricity represents respectively 33% and 34%. Fossil fuels remain a dominant resource to produce Hydro-electricity in the lower NDCs scenario, even if coal almost disappears. In the UNFCCC scenario, CCS represents 48% of the
11 www.cma.fr
The decarbonized pathways of post-Paris climate policy
4. Conclusion and policy implications
Tackling the problem of global climate change indeed re-quires a drastic reduction of total GHG emissions and a high level of international cooperation. The ambition of the Paris agreement is to support countries in a new world: a decarbonized world. Firstly, a significant gap still remains between the ambition of countries’ commitments and what is required in order to stay well below the 2°C temperature increase and so avoid dangerous climate change. This position contrasts with the inclusion of the reference to 1.5 °C in the Paris Agreement, even though a revision pledge is provided in the text. However, at the same time, the Paris Agreement can be qualified as his-toric and as the world’s greatest diplomatic success due to the fact that countries’ initial pledges appear sufficient to clearly limit the increase of global temperature, coupled with the institutionalization of a new paradigm, as high-lighted in Bodansky (2016). To take GHG emissions miti-gation further, a key measure of success is therefore how well, and how fast, the Paris Agreement will incentivize more ambitious action (Luomi, 2016). However, while the global contribution of all countries appears essential to reach the ultimate goal of the Paris Accord, a fair level of contribution from developing countries has to be deter-mined. Or (financially) supported. In the same way, ambi-tious GHG reduction by India and China is expected to reflect their level of growth and pace of development, but they must remain realistic. In a global context of drasti-cally reducing global GHG emission levels, this study highlights the limits of the impact of industrialized coun-tries’ decarbonization and the importance of a contribu-tion from developing countries, China and India. At same time, it points to a significant transformation of their en-ergy systems, even in their NDC context. Realistic climate targets have to be discussed in line with realistic techno-logical change and the availability of technotechno-logical solu-tions.
More broadly, discussions investigate long-term solu-tions, such as the development of CCS technologies or renewables, in response to a constraint that influences the energy mix. The aim is to highlight the challenges. Not only must countries act, but technological progress must also find an adequate response to countries’ ambitions to expand the pool of available (or not) technologies and their mitigation potential. This not only concerns CCS technologies, but also non-fossil energies, like wind, solar, biomass. Thus the question of technological expansion is also a critical factor for the future international climate regime. Indeed, the carbon constraint response in these scenario analyses is often investments in CCS technolo-gies in order to reach targets of different levels. However, the feasibility of avoiding the required Gt of CO2 emis-sions by investing in CCS technologies is questionable. Could the potential use of these technologies be enough to satisfy this need? This question of plausibility also con-cerns renewables. In the total primary energy supply, the shares of renewables, biomass, and alcohol can appear
high. Their size might increase significantly with a more stringent target, but this depends on the cost and effi-ciency of renewable technologies, and their comparability with fossil fuels. Their future technological development is still an uncertain variable that should be taken into ac-count. Widespread integration of renewables would not be possible without investment in storage technologies. Considering the McKinsey abatement curve, a large port-folio of technologies is available and some of them are fi-nancially advantageous. But some of others are yet complicated and expensive (Spiegel, 2015a,b). CCS is still quite expensive, but for IEA, Alberta’s Quest, a new Canadian CO2 storage project initially developed to cut emissions from oil sands, provides further proof that CCS can help reduce GHG emissions. However, the question is whether private companies are willing to invest in CCS projects. In a study on Norwegian oil companies, Emh-jellen and Osmundsen (2013) show that a CCS project is unlikely to be implemented by a private company due to its low ranking and CCS projects’ negative net present value. CCS oil projects became profitable with the intro-duction of a considerable subsidy (68% of investments). Building CCS at this scale for climate change mitigation requires the development of incentive policies as well as a regulatory framework to support business models and result in widescale adoption (Rai et al., 2010). This implies that governments must play a decisive role in CCS tech-nologies. The IEA, in its latest Energy Technology Per-spective (ETP), reported that moderate progress in CCS was made in 2015 and that industry and governments will need to make significant investments in projects and technology development to get CCS on track to meet the expected target of annual CO2 storage (IEA, 2016). Sig-nificant development of CCS will also involve making storage sites socially acceptable, with the benefits of negative emissions due to BECCS only being effective in case of sustainable use of biomass. In this area, the restoration and preservation of forests is another key fac-tor. And so many more challenges remain to be over-come.
To reach an optimistic climate constraint in line with the 2°C objective, the scale of the technological challenge has to be assessed. And to address these issues, the Paris Accord sends policy makers, investors and the business community a clear signal for decarbonization. However, the question remains of the (institutional) ca-pacity of developing countries to support a decarbonized energy system and the willingness of industrialized coun-tries to support them. Developing and emerging economies thus face a two-fold energy challenge: “meet-ing the needs of billions of people who still lack access to basic, modern energy services while simultaneously participating in a global transition to clean, low-carbon energy systems” (Ahuja and Tatsutani, 2009). In this con-text, more efficient technologies will not usually be the first choice, and the choice of a decarbonized system “will depend to a large extent on how quickly developed and developing countries recognize and begin to act upon their shared stake in achieving positive outcomes that can be managed only by working together” (ibid.).
Working Paper N¡2016?04?22