HAL Id: hal-01621565
https://hal.archives-ouvertes.fr/hal-01621565
Submitted on 23 Oct 2017
HAL is a multi-disciplinary open access archive for the deposit and dissemination of sci-entific research documents, whether they are pub-lished or not. The documents may come from teaching and research institutions in France or abroad, or from public or private research centers.
L’archive ouverte pluridisciplinaire HAL, est destinée au dépôt et à la diffusion de documents scientifiques de niveau recherche, publiés ou non, émanant des établissements d’enseignement et de recherche français ou étrangers, des laboratoires publics ou privés.
du procédé d’infusion : caractérisation par
micro-tomographie X
Julie Hemmer, Christian Burtin, Christophe Binetruy, Sébastien
Comas-Cardona, Thibaut Savart, Arthur Babeau
To cite this version:
Julie Hemmer, Christian Burtin, Christophe Binetruy, Sébastien Comas-Cardona, Thibaut Savart, et al.. Evolution de la microstructure des renforts fibreux lors du procédé d’infusion : caractérisation par micro-tomographie X. Journées Nationales sur les Composites 2017, École des Ponts ParisTech (ENPC), Jun 2017, 77455 Champs-sur-Marne, France. �hal-01621565�
Evolution de la microstructure des renforts fibreux lors du procédé d’infusion :
caractérisation par micro-tomographie X
Fibrous reinforcement microstructure evolution during infusion process :
experimental characterization with X-ray computed tomography
Julie Hemmer1,2, Christian Burtin1, Christophe Binetruy1, Sébastien Comas-Cardona1, Thibaut Savart2and
Arthur Babeau2
1 : Département PMM, Laboratoire GeM Ecole Centrale de Nantes 1, rue de la Noe 44300 Nantes e-mail : julie.hemmer@ec-nantes.fr
2 : Plateforme CANOE Cheminnov 2 - ENSCBP 16, avenue Pey Berland 33600 Pessac e-mail : savart@plateforme-canoe.com
Résumé
L’utilisation du procédé d’infusion pour fabriquer des pièces composites implique un phénomène de décompaction dû à la flexibilité de la bâche à vide. Pour des pièces de structure, des tissés ou des non tissés sans ondulations (Non Crimp Fabric, NCF) sont majoritairement utilisés et leur imprégnation par une résine liquide donne lieu à un flux double-échelle. De nombreux auteurs modélisent et simulent à la fois un flux double-échelle et une variation de la compaction du milieu fibreux, en considérant celui-ci comme un milieu continu, mais aucun d’entre eux ne prend en compte l’évolution de la microstructure due à l’état de compaction. Pourtant, la connaissance de cette microstructure est essentielle pour déterminer les perméabilités au sein des mèches et entre les mèches. Cet article propose une méthodologie expérimentale pour quantifier l’évolution d’une même microstructure locale soumise à différents états de compaction. Un montage spécifique mis au point pour réaliser des infusions miniaturisées dans un micro-tomographe X est présenté, et les résultats concernant les microstructures obtenues sont donnés pour un sergé de verre. Ces images 3D de microstructure sont actuellement utilisées pour alimenter un outil de prédiction numérique du tenseur de perméabilité.
Abstract
Composites manufacturing using infusion process involves a decompaction phenomenon due to the vacuum bag flexibility. When considering structural parts, woven or non-crimp fabrics are mainly used and lead to a double-scale flow during their impregnation by a liquid resin. Several existing works tend to model and simulate both double-scale flow and variation of the compaction state, when considering the fibrous preform as a continuous medium, but none takes into account the reinforcement microstructure evolution due to the compaction state. Nonetheless, a detailed knowledge of the microstructure is essential because it impacts intra-tow and inter-tow permeabilities. This paper proposes an experimental methodology to quantify the evolution of a same localized microstructure under several compaction states. A set-up developed to realize in-situ miniaturized infusion inside a X-ray computed tomography (X-ray CT) device is presented, and microstructure results are given for a glass twill-weave fabric. These 3D images of microstructure are now being used as inputs for a computational tool to predict the 3D permeability.
Mots Clés : procédé d’infusion, décompaction, micro-tomographie, microstructure Keywords : infusion process, decompaction, X-ray computed tomography, microstructure
1. Introduction
When large composite parts are considered, the infusion process is competitive on both mechanical and cost aspects. It is a closed mold composite process, where the bottom side of the mold is solid, and the top side is a vacuum bag. Because the vacuum bag is flexible, local compaction state of the porous fabric preform can easily be modified. In the saturated area of the part, far behind the flow front, a decompaction of fabrics is experimentally observed, due to the gradient of the resin
pressure field [1], [2]. Moreover, depending on its architecture, the fabric preform can be considered as a single-scale porous medium, like randomly oriented fiber material, or as a double-scale porous medium, like unidirectional, woven or non-crimp fabrics. Double-scale porosity materials induce a delayed impregnation of fiber tows [3] which has to be taken into account in process simulation. Several existing works tend to model and simulate both double-scale flow and variation of the com-paction state, when considering the fibrous preform as a continuous medium [4], [5], but none takes into account the reinforcement microstructure evolution due to the compaction state. Nonetheless, a detailed knowledge of the microstructure is essential because its impacts intra-tow and inter-tow permeabilities [6] .
This article deals with an experimental set-up developed to measure with a X-ray CT device the evolution of a same localized microstructure under several compaction states. Image processing on recorded microstructure highlights the decompaction phenomenon at the macroscopic scale and provides a novel quantification of the mesoscopic geometry of the tows under a defined compaction state.
2. Methods
2.1. Experimental principle
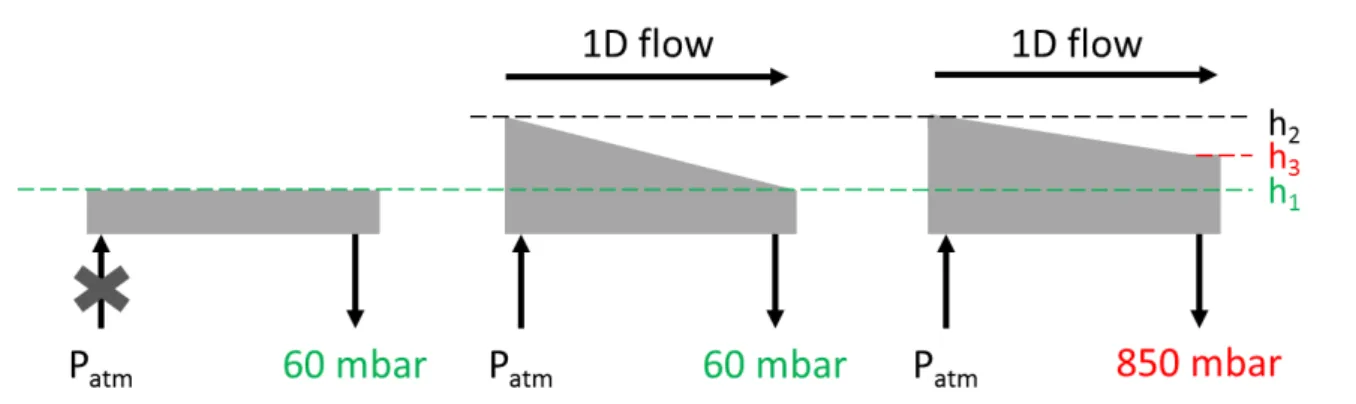
Fig. 1. Experimental steps : a) Dry state, at 60 mbar. b) Wet state, stationnary 1D flow, at 60 mbar. c) Wet state, stationnary 1D flow, at 850 mbar.
A controlled level of vacuum (60 mbar) is applied in a cavity where six plies of glass twill-weave fabric are previously laid down (Fig. 1a). A 1D continuous flow of glycerol is then maintained in the cavity, leading to a decompaction phenomenon near the fluid inlet (Fig. 1b). While keeping a constant fluid flow, the vacuum level is increased step by step from 60 mbar to 850 mbar (Fig. 1c). For each step, two 3D images of the microstructure are recorded : the first one near the fluid inlet and the second one near the vacuum vent (Tab. 1).
Tab. 1. Order of the image recordings linked to the level of vacuum and the reinforcement state.
dry state wet state
60 mbar (1) (2) 200 mbar (3) 450 mbar (4) 600 mbar (5) 850 mbar (6) 2.2. Experimental set-up
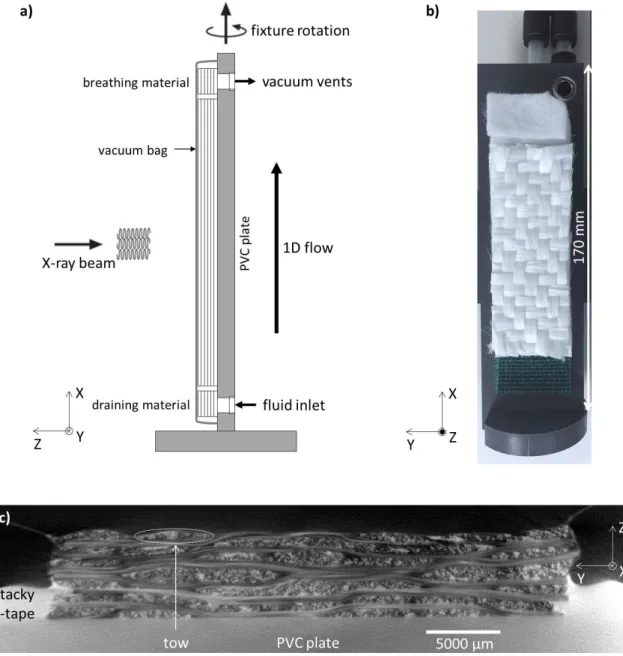
To follow this experimental principle, a set-up is developed to realize in-situ miniaturized infusion inside the X-ray CT device (Fig. 2). A PVC plate, transparent to X-rays, is dimensioned with respect
to the geometric constraints imposed by the X-ray CT device. The fluid inlet and the vacuum vents are placed out of the recording field of view to avoid artefacts. During the recording, the entire set-up does a 180° rotation around the X axis, and a high stability is needed to obtain sharp images. Therefore, to prevent any improper movement, a platform is integred to the set-up, and flexible pipes are used. To ensure tightness and no vacuum leakage, a double vacuum circuit is adopted. A bagging strategy is previously validated to limit boundary effects.
Fig. 2. a) Sketch of the set-up for in-situ infusion in the X-ray CT. b) Detail of the set-up with the infused reinforcement. c) A raw slice (YZ plane) extracted from the X-ray CT 3D reconstruction at X = 72 mm near the vacuum vent, at 60 mbar.
2.3. Image processing
Macroscopic scale. For a defined vacuum level, six slices (YZ plane, as presented in Fig. 2c) along
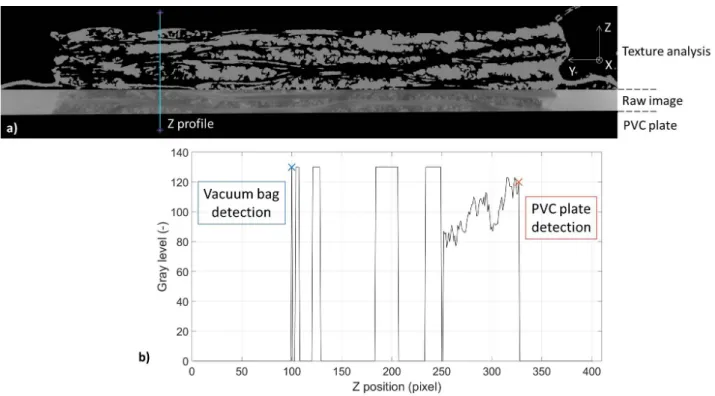
the X axis are selected (X1 to X6). For each slice, a partial texture analysis and a thresholding are applied (Fig. 3a). Five Z gray level profiles are extracted along the Y axis and the detection of the profile boundaries gives a macro-scale thickness (Fig. 3b). Therefore, for a vacuum level, at an X location, the macro-scale thickness is defined as the mean of the five thicknesses measured with the Z profiles. This procedure is applied for all the vacuum levels, for the locations X1to X6.
Fig. 3. a) A post-treated slice (YZ plane) extracted at X = 72 mm near the vacuum vent, at 60 mbar, with the representation of a Z profile. b) Z gray level profile extracted from the considered slice, and its boundaries detection.
Fig. 4. a) Representation of the smallest structure tensor eigenvalues of a slice (YZ plane) extracted at X = 29 mm near the fluid inlet, at 60 mbar, with the location of the three tows. b) Extraction of tow(B). c) Tow(B) after texture analysis, with the convex hull represented in green. d) Measurement of tow(B)’s thickness.
Mesoscopic scale. For a defined vacuum level, the slices at X1 to X6 locations are considered. For each slice, the structure tensor is computed using the plugin FeatureJ of ImageJ [7] and warp tows are isolated, as they exhibited a more isotropic shape than the weft tows (Fig. 4a). Therefore, three tows
are selected at different Z locations : a tow near the vacuum bag tow(A), a cluster of two tows in the Z-middle of the sample tow(B) (Fig. 4b) and a tow near the PVC plate tow(C). For each tow, a texture analysis is applied, a convex hull is plotted (Fig. 4c) and the thickness is then measured (Fig. 4d). This procedure is applied for all the vacuum levels, for the locations X1to X6.
3. Results and discussion
In the following section, the deformation ∆Hiis defined as : ∆Hi =
hi− hr e f,i hr e f,i
(Eq. 1) where i stands for macro (plate) or meso (tow), h is the thickness for a defined vacuum level and a defined X position and hr e f is the thickness at the reference dry state under the vacuum level 60 mbar (corresponding to the step (1) in Tab. 1) for a defined X position.
3.1. Macroscopic scale validation
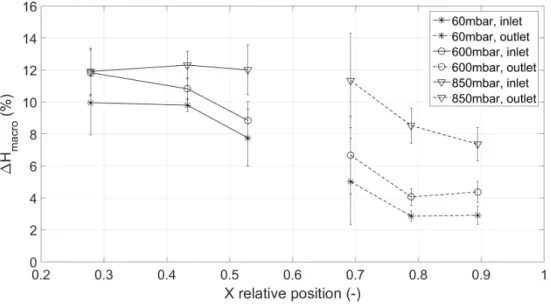
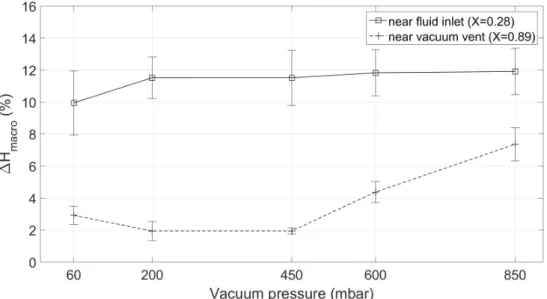
Under 60 mbar, the fluid flow generates a thickness variation of 10% near the fluid inlet and 3% near the vacuum vent with respect to the dry state under the same vacuum level (Fig. 5). The decrease of the vacuum level from 60 to 850 mbar softens this decompaction gradient : near the fluid inlet, the thickness variation rises from 10% (60 mbar) to 12% (850 mbar) whereas near the vacuum vent, it rises from 3% (60 mbar) to 7% (850 mbar) (Fig. 6).
These results show that it has been possible to realize an infusion within the X-ray tomography constrained environment. It also validates the ability of the set-up to reproduce and record the decom-paction phenomenon at a macroscopic scale and the ability of the methodology to capture the impact of the compaction state on the global thickness evolution.
Fig. 5. Macroscopic decompaction evolution along the 1D flow X axis for several vacuum levels.
Fig. 6. Influence of the compaction state on the macroscopic thickness evolution far and near the vacuum vent. 3.2. Mesoscopic scale investigation
Between the dry and the wet state at 60 mbar, the tows’ thickness can rise by 15% near the fluid inlet (tow(A)) and by 3.5% near the vacuum vent (tow(C)). It first shows that the microstructure evolves between the dry and the wet state. The impact of the compaction state on the microstructure is also highlighted (Fig. 7), essentially near the fluid inlet, where the tow(A)’s thickness variation rises from 15% (60 mbar) to 20% (850 mbar).
From a tow to another, the thickness evolution is completely different : for instance, tow(A)’s thickness rises by 20% near the fluid inlet at 850 mbar whereas tow(C)’s thickness only rises by 5.5%. It could be explained by the complexity of the reinforcement architecture, where tows are more or less constrainted by the surrounding tows.
Finally, these first results underline distinct behaviors between the macro-scale and the meso-scale : for instance, near the fluid inlet at 850 mbar, the stack decompaction is around 12% (Fig. 5) and the tow decompaction (tow(A)) reaches 20% (Fig. 7) . Therefore, the microstructure is affected by the modification of the tows’ geometry and the channels’ spatial distribution.
4. Conclusion
A new experimental set-up has been designed to carry out an infusion within the X-ray tomography constrained environment. The results obtained confirm the presence of a macroscopic thickness gradient induced by the infusion process. Therefore, the set-up and the methodology described in this study are reliable to reproduce the decompaction phenomenon. A novel quantification of this phenomenon at the mesoscopic scale is proposed by observing and recording the same localized microstructure under different compaction states. The first results presented show the importance of the tows’ thickness evolution with the compaction state and then of the microstructure evolution (20% of tows decompaction versus 12% of stack decompaction at the fluid inlet for instance). These 3D images of microstructure are being used as inputs for a permeability computational tool that gives promising results. Further work will focus on the resolution enhancement of the images recorded, and the final results will be implemented as a "pressure-microstructure law" in a double-scale flow simulation tool.
Acknowledgement
The authors would like to thank CANOE (Technological Center for Advanced Materials and Com-posites in Nouvelle-Aquitaine Region) for their financial support so as the funding provided by the French ANRT by grants under CIFRE funding program.
Références
[1] K. D. Tackitt, S. M. Walsh « Experimental Study of Thickness Gradient Formation in the VARTM Process », Materials
and Manufacturing Processes Vol. 20 n° 4, pp. 607–627, 2005.
[2] B. Yenilmez, M. Senan, E. M. Sozer « Variation of part thickness and compaction pressure in vacuum infusion process », Composites Science and Technology Vol. 69, pp. 1710–1719, 2009.
[3] J. Slade, K. M. Pillai, S. G. Advani « Investigation of unsaturated flow in woven, braided and stitched fiber mats during mold-filling in resin transfer molding », Polymer Composites Vol. 22 n° 4, pp. 491–505, 2001.
[4] J. Acheson, P. Simacek, S. Advani « The implications of fiber compaction and saturation on fully coupled VARTM simulation », Composites : Part A Vol. 35, pp. 159–169, 2004.
[5] M. S. Rouhi, M. Wysocki, R. Larsson « Modeling of coupled dual-scale flow–deformation processes in composites manufacturing », Composites : Part A Vol. 46, pp. 108–116, 2013.
[6] B. Caglar, L. Orgéas, S. Rolland du Roscoat, E. Murat Sozer, V. Michaud « Permeability of textile fabrics with spherical inclusions », Composites Part A : Applied Science and Manufacturing Vol. 99, pp. 1–14, 2017.
[7] E. Meijering, FeatureJ : an ImageJ plugin suite for image feature extraction, https ://images-cience.org/meijering/software/featurej/, 1996-2017.