HAL Id: hal-02043953
https://hal.archives-ouvertes.fr/hal-02043953
Submitted on 21 Feb 2019
HAL is a multi-disciplinary open access archive for the deposit and dissemination of sci-entific research documents, whether they are pub-lished or not. The documents may come from teaching and research institutions in France or abroad, or from public or private research centers.
L’archive ouverte pluridisciplinaire HAL, est destinée au dépôt et à la diffusion de documents scientifiques de niveau recherche, publiés ou non, émanant des établissements d’enseignement et de recherche français ou étrangers, des laboratoires publics ou privés.
Tests in an Engineered Fractured Geothermal Reservoir:
Example of the Soultz-Sous-Forêts European Hot
Fractured Rock Geothermal Project, Rhine Graben,
France
D. Bruel
To cite this version:
D. Bruel. Impact of Induced Thermal Stresses During Circulation Tests in an Engineered Fractured Geothermal Reservoir: Example of the Soultz-Sous-Forêts European Hot Fractured Rock Geothermal Project, Rhine Graben, France. Oil & Gas Science and Technology - Revue d’IFP Energies nouvelles, Institut Français du Pétrole, 2002, 57 (5), pp.459-470. �10.2516/ogst:2002030�. �hal-02043953�
Impact of Induced Thermal Stresses
During Circulation Tests
in an Engineered Fractured Geothermal Reservoir
Example of the Soultz-sous-Forêts
European Hot Fractured Rock Geothermal Project,
Rhine Graben, France
D. Bruel
11 Centre d’informatique géologique, École des mines de Paris, 35, rue Saint-Honoré, 77300 Fontainebleau - France e-mail: bruel@cig.ensmp.fr
Résumé — Impact des contraintes d’origine thermique lors d’un essai de circulation dans un réservoir géothermal développé en milieu fracturé : application au site de Soultz-sous-Forêts, Alsace, France, dans le cadre du projet européen sur la géothermie en milieu fracturé profond —
Le concept de géothermie en roches profondes fracturées est introduit comme une généralisation du concept classique de géothermie sur nappes aquifères, par nature limitées dans l’espace. Un outil numérique bâti selon une approche de réseaux de fractures discrètes est présenté, avec certaines des spécificités et couplages requis pour l’étude des écoulements en milieu fracturé et profond. L’application s’appuie sur les données acquises dans le cadre du projet européen mené à Soultz-sous-Forêts (Alsace, France), dans le graben du Rhin. Les conditions géologiques semblent bonnes, puisqu’un grand nombre de fractures se trouvent favorablement orientées vis-à-vis des contraintes actuellement en place.
Un modèle des principales structures géologiques a été construit à partir des données acquises de 1993 à 1997, entre 2850 et 3600 m de profondeur. Le jeu de données comprend de la microsismicité induite, de la géophysique en forage, des essais hydrauliques en puits unique ou entre forages, ainsi qu’un test de circulation de quatre mois pendant lequel deux tests de traçage ont été réalisés. La modélisation numérique montre que les effets de refroidissement dans le voisinage de la zone de réinjection peuvent se manifester durant cette période, ce qui pourrait expliquer certaines observations, comme la lente diminution de l’impédance hydraulique du réservoir, la modification des débimétries en forage, ainsi que les allures sensiblement différentes des courbes de percées des traceurs.
Abstract — Impact of Induced Thermal Stresses during Circulation Tests in an Engineered Fractured Geothermal Reservoir: Example of the Soultz-sous-Forêts European Hot Fractured Rock Geothermal Project, Rhine Graben, France — The wider concept of hot fractured rock geothermal energy is put forward to overcome the natural limitations of classic geothermal fields. A suite of numerical modules based on a discrete fracture network approach has been developed, specifically devoted to the understanding of flow through faulted and fractured deep rock masses. The presented application concerns the geothermal project developed at the Soultz-sous-Forêts site (Alsace, France) in a graben
INTRODUCTION
The increased concern about impact of hydrocarbons back to the atmosphere combined with the growing interest in sustainable energy sources make the geothermal energy more and more attractive. The concept of extraction of the heat from deep, hot but poorly conductive rocks to produce heat or electricity was originally based on forced fluid circulation through artificially created fractures. Hence, energy could be ideally produced at any place, close to potential customers, and was not dependant on geological constraints like the presence of a deep, warm and permeable natural reservoir, as conventional geothermal doublets are.
Early experimental projects performed at Fenton Hill (United States) with the aim of developing this hot dry rock (HDR) technology experienced some difficulties, mainly high hydraulic impedances with very moderate heat exchange areas (Armstead and Tester, 1987). Thus the concepts gradually evolved to take advantage of pre-existing path ways in geolog-ical settings where the interactions between natural joint orien-tation and in situ stresses may easily result in the enhancement of the hydraulic conductivity of the fracture network. Developing such a reservoir in a strike slip stress regime, was undertaken at Rosemanowes (Cornwall, United Kingdom), but difficulties were encountered as soon as injection regime was increased (Richards et al., 1994). The reservoir was not stable and fractures start shearing and propagating, thus leading to uncontrolled fluid losses and demonstrating that operating a two well system—even made of parallel cells previously developed at different depths—at pressure close to the pressure level required for the development of the reservoir was not appropriate. More over a hydraulic short circuit between wells was created at Rosemanowes, may be due to thermal rock shrinkage, that resulted into a rapid thermal drawdown at the production borehole (Parker, 1989).
Lessons were however learned from these early research programs, and a new European project was launched at Soultz-sous-Forêts (France) in 1987. The area was previously known for a high heat flux anomaly, in connection with the local graben geological context and pre-existing natural fluid circulations.
The overall objective of this recent research program at Soultz is to prove that engineering a deep heat exchanger in
such a geological setting is feasible and that its main parameters can be properly evaluated (Baria et al., 1996). A successful developed reservoir should exhibit a large heat exchange area combined with poor fluid losses and a low global hydraulic impedance in order to keep pumping costs as low as possible. The extension of the heat exchange area should prevent from any cooling along the circulated loops to avoid uncontrolled development of a rapid potential path toward the production zones.
To demonstrate that these goals were achievable, two deep, nearly vertical wells, respectively 3.6 and 3.9 km in depth, were drilled, 450 m apart, and the rock mass was stimulated by massive injections:
– to improve the natural connectivity of the wells to the nearby fractures;
– and to enhance the natural transmissivity of the farther pre-existing fracture network.
Although the information upon stress magnitudes is of moderate quality, recorded induced seismicity (see Fig. 1a) indicated that the main geomechanical process during the creation of the reservoir was fracture shearing up to large distances, with some jacking mechanism occurring nearby the injection well in the upper part of the reservoir, where about 65% of the fluid is injected (Fig. 1b).
This first truly engineered reservoir has been successfully circulated at fluid pressures far below the stimulation pressure levels during a four month period in 1997 (Baumgartner et al., 1998), using a down hole pump at the production hole to enhance recovery by taking advantage of the natural far field permeability to insure the overall fluid mass balance. The set of measurements related to this experimental phase will form the basis for the modeling work presented in this paper.
A conceptual model is proposed that present attractive capabilities in understanding a significant part of the wide range of measured data, collected during the enhancement of the reservoir and when the reservoir was operated (Baria et
al., 1999). The modeling work emphasizes on the gradual
process followed to calibrate the hydraulic properties of the various conductive features, against both the global hydraulic impedance and mass balance obtained during successive interference, circulation and tracer experiments performed in 1996 and 1997. Heterogeneities in the hydraulic properties in
geological setting. This area seems well suited for such a project, since most of the faults and fractures are nearly optimally-oriented for frictional slip in the present day stress field.
A 3D structural model is generated from a variety of measurements collected during the 1993-1997 experimental program at depths ranging in 2850 down to 3600 m. These include induced microsismicity, geophysical logs, flow logs, hydraulic interference tests between wells 500 m apart, a four months long circulation test and two tracer tests. An interesting output of the modeling work is that rock shrinkage due to cooling at the reinjection well is likely to happen within some months of fluid circulation, and this would fit with many observations, such as a pressure decrease at the re-injection well, noticeable changes in the flow logs or a significant evolution in tracer breakthrough curves.
the vicinity of the bore holes, as a result of fracture re-activation through hydraulic treatments at high pressures and high flow rates, will thus be considered.
A discrete fracture network approach is proposed to simulate some of these hydraulic tests. Flow rules are derived from the cubic law but thermal effects, fracture normal compliance and an irreversible-dilatant shearing mechanism are accounted for. In a forward modeling sense, we show how a suitable parameter configuration can be found, that matched the stimulation treatments, the hydrodynamic measurements, and that can be use in a predictive sense to model the tracer breakthrough curve. An interesting output of this numerical effort is to show that rock shrinkage due to cooling at the reinjection well is likely to happen after some months of circulation, and this would fit with the observed trend of pressure decrease at the reinjection well (about 0.02 MPa/day, Fig. 2a). A noticeable evolution in early tracer breakthrough can also be obtained by the numerical simulation of the two tracer tests carried out at two periods, early and late during the four months long circulation test that compare satisfactorily with in situ measurements
(Fig. 2b), although the tracers were not the same in both
experiments. This would also be supported by some noticeable changes on flow logs at the injection well
(Fig. 2c). More flow is injected at the top of the open hole
section, just below the casing shoe, which is the place the
most sensitive to any thermo-mechanical interaction, because of the vertical stress gradients.
1 THE DISCRETE FRACTURE NETWORK APPROACH – THEORITICAL BACKGROUND
OF THE FRACAS CODE
In granitic fractured reservoirs, the overall flow pattern is controlled by the pre-existing network of discontinuities. Access to the reservoir depends on the connection between boreholes and these natural pathways. Since fractures are unevenly distributed in space but rather assemble into clusters and are widely variable in size—see Genter et al., (2000) for this particular faulted area—and since the heat to mine out is stored in the matrix surrounding the fractures, continuum models based on equivalent porous materials are not adequate. Conceptual models based on deterministic regular fracture patterns (Hicks et al., 1996; Kolditz and Diersch, 1993; Kolditz and Clauser, 1998) or randomly distributed networks (Robinson, 1990; Bruel, 1995; Willis-Richard et al., 1996) embedded in the rock mass have been developed for this particular HDR research area. Similar discrete fracture network approaches were recently proposed for the evaluation of oil recovery techniques in fractured reservoirs using injection of steam (Dershowitz et al., 1999).
0 4 8 12 16 20 (l/s)
24
GPK1 19/10/96 GPK2 21/09/96
Main flowing zones 2800 2900 3000 3100 3200 3300 3400 3500 3600 Depth (m) Figure 1a
Locations of seismic events, falling in the 2900-3100, 3100-3300 and 3100-3300-3500 m depth range from right to left. Plan view showing lineaments in the north 150 east direction for the shear propagation and north 170 east direction close to the casing shoe of the GPK1 injection well. GPK2 (squares) well is drilled 450 m to the south of GPK1 (diamonds).
Figure 1b
Flow logs showing the main hydraulically active zones in both boreholes. Three main zones are identified in each open hole.
5 25 20 15 10 5 0 -3 3 0 -4 2 -1 4 1 -2 -5 0 14 28 42 56 70 Time (days) Pressure (MPa) (kg/s) 84 98 112 126 P-inj. P-pro. Flowrate
Circulation experiment 1997 July 12
Figure 2a
The 1997 circulation experiment, after Baumgartner et al. (1998), showing the continuous trend in pressure decrease at the reinjection well GPK1, for a nearly stable flow rate of 24 kg/s.
2700 2800 2900 3000 3100 3200 3300 3400 3500 3600 0 4 8 12 16 20 (l/s) Depth (m) 24 July 18 Oct. 27 GPK1 flowmeter 90 80 70 60 50 40 30 20 10 0 0 100 200 300 400 500 Elapsed time from start of tracer injection (h)
Amino-G (ppb) 1.2 1.0 0.8 0.6 0.4 0.2 0 Benzoic acid (ppm) Amino-G Oxide of deuterium Benzoic acid A1 A2 Figure 2b
Two flow logs in the reinjection well GPK1, run early in the circulation phase and at a later time of this circulation phase, showing that flow is redistributed. More mass is entering at the top of the open hole and slightly less at the bottom part. Injection pressure dropped from about 4.0 MPa down to 2.5 MPa during this period of time.
Figure 2c
First part of the tracer recovery curves. Although arrival times for benzoic acid (August, 1997) and amino-G (Oct. 1997) are similar (A1, four days), some significant differences can be observed. The main peak time is delayed by some days and the amino-G response suggests a secondary path way.
1.1 Geometry
The FRACAS modeling approach is based on the assumption that fluid moves through a rock mass within a system of interconnected fractures and that flow in the rock matrix is negligible by comparison. The 3D hydraulically conductive network of planar, disc-shaped fractures generation is inherited from Cacas et al. (1990) modeling work. Series of individual fractures are generated within a rectangular block of rock, based on stochastic descriptions of fracture density (Poisson distribution), fracture orientation (Fisher von Mises distribution), and fracture diameter (log-normal distribution). Specific fracture sets can be defined as models of faults zones. Relay structures or simple planar fault segments can be generated (Jeong, 2000) as well as combinations of adjacent blocks with different fracture network properties. Integration with a porous media, treated as a heterogeneous continuum through standard numerical methods, is also available (Jeong and Bruel, 2000).
1.2 Flow Rules
1.2.1 Hydraulic Conductivities
The overall flow model is based on the premise that flow in granitic basements primarily occurs on channels within fractures. The 3D structure resulting of the superimposition of the connected portions of planes is thus treated as a 3D network of 1D pipes as in Cacas et al. (1990). Equivalence of this channel flow approach with others solving true 2D flow in planes has been discussed (Dershowitz and Fidelibus, 1999).
Time-dependant analysis requires assumptions to be made concerning the form of fluid flow within the fracture network. The general form of fluid flow assumed in each fracture is based on an analytical solution, known as the “cubic law”, for fluid flow between approximately parallel surfaces (Witherspoon et al., 1980). Modified forms of the cubic law are used to account for the effects of changes in the morphology of contact between fracture surfaces. As the effective stress across a fracture increases flow through the fracture becomes confined to a limited number of channels.
Thus, in FRACAS, the volumetric flux (m3s–1) in the
x-direction through a length l (m) of a fracture has the form:
(1) where a0is the hydraulic aperture (m) of the fracture at zero effective stress, g is acceleration due to gravity (ms–2), νis the kinematic viscosity (m2s–1), dh/dx is the hydraulic head gradient driving flow through the fracture, and F is a dimensionless function dependent on effective stress. The effective stress is defined as σ´ =σn– p, where σn(Pa) is the rock stress normal to the fracture surface and p (Pa) is the
fluid pressure in the fracture. Empirical expressions for F, in which F decreases as the effective stress increases (F = 1 at zero effective stress) are presented by Bruel et al. (1994). Many analytical formulations can be used to describe the aperture change versus a change in normal stress. Among them, the Barton et al. (1985) hyperbolic normal closure model has been selected. This is a two parameter model that insures a finite aperture at zero effective stress. Given a normal stiffness coefficient kn0at zero effective stress and a maximum closure value a0for a joint, the available aperture
a for fluid motion at a given effective stress level σ´ is
derived as follows:
u = σ´ a0/(a0kn0+ σ´) (2)
a = a0– u = a0(1 + σ´/(a0kn0+ σ´)) (3)
For the above normal closure law, the F factor can be easily derived as:
F = (1 + σ´/(a0kn0+ σ´))3 (4)
This coupled approach was tested against various in situ experiments performed in hard rocks in the frame work of a nuclear waste storage research program, and predictive results were compared with those of other numerical approaches (Rejeb and Bruel, 2001).
However, in this paper the objective is to incorporate the potential effects of a short term thermal perturbation to evaluate how significantly it may alter the reservoir performances. Therefore F will be rederived later, according to the procedure described in the section devoted to the thermo-hydro-mechanical interactions, after the basics for heat exchange modeling in the FRACAS discrete fracture network model have been introduced.
1.2.2 Specific Storage of the Fractures
The specific storage S (m–1) of a fracture with R as radius (m) is given by:
(5) where ρis the fluid density (kgm–3) and g the acceleration due to gravity (ms–2). S
0denotes the potential specific storage of the adjacent weathered rock that can be identified on cores and in situ, using sonic logs. These zones exist on both fracture sides and can extend up to a metric scale (Genter et
al., 2000).
In deriving the specific storage term, the rock stress has been assumed constant, such that changes in effective stress are caused only by fluid pressure changes. Also, fluid compressibility is generally much smaller than fracture compressibility and, thus, has been neglected. The form the of the term das/dσ´ calculated at the center of the fracture disc, depends on the assumed form of the relationship between the hydraulic fracture aperture and the effective stress, as discussed above.
S g a da d S =ρ + σ 1 0 0 ' Q a glFdh dx =− 03 12ν
1.3 Convective and Conductive Heat Transfer
Heat exchange along the circulated fractures can be evaluated assuming that heat conduction develops perpendicular to the fracture plane. No energy is retained by the volume of fluid within the fractures. The conservation of energy is written at each fracture center as a balance between convected energy and energy dissipated by conduction. At any time, continuity of the temperature at the fracture wall is assumed, that is:
θf= θm(y = 0) (6)
Subscript f and m respectively stand for fluid and matrix. If qijand qik(m3s–1) denotes fluxes entering and leaving a given disc i at time t, with respective temperatures θfi(t) and
θfi(t+dt), the energy exchanged during dt is dQi(J), given by:
dQi= ∑jρfCfqijθfjdt – ∑kρfCfqikqfidt (7)
This energy is related to the heat flux at the fracture wall,
Φi, across the exchange area Si(m
2), that has to dissipate in an adjacent rock volume according to a diffusive equation. The shape of this adjacent block is cylindrical, with a radius equal to that of the fracture-disc and a length chosen so that the temperature at the face opposite to the circulated fracture remains constant during the modeled test. The cumulated volume of all this blocks is equal to the global reservoir volume. Further developments insuring block to block thermal interactions for predicting long term thermal depletions are assumed to be not relevant for the present purpose, since the diffusivity coefficient, which is in the order of 1·m2s–1 for rocks, may not allow the temperature changes to propagate at great distances within time periods no longer than a couple of months.
dQi= ΦiSidt, (8)
Φi= Km(dθm/dy)y = 0 (9)
(10) At each disc i in the network, the diffusivity equation is written in a discrete form following a standard finite differ-ence scheme, and the set of equations is solved for θfi and θmi at time t + dt knowing similar quantities at time t. The initial temperature field is derived in the present case from the local temperature gradient (Pribnow and Schellschmidt, 2000) and the temperature of the injected fluid is continuously pre-scribed. Parameters are matrix heat conductivity Km(W m–1 K–1), heat capacity C
m, Cf (J kg
–1K–1) for both fluid and solid, density ρf, ρm(kg m–3) for both fluid and matrix.
1.4 Thermo-Hydro-Mechanical Interactions
1.4.1 Thermal Behavior of the Rock Mass
In this particular circumstance where transport of energy is greatly enhanced by fluid flow, the thermo-elastic
phenomenon is considered. Numerical approaches developed in two dimensions using a regular fractured pattern (Hicks et
al., 1996) with perpendicular fracture sets already showed the
perverse effects of stress perturbations. Impedance reduction is obtained but it is likely that the coldest flow paths will carry growing proportions of the injected fluid volume. It was therefore important to further evaluate the impact of these mechanical processes in 3D, using noncontinuous jointing patterns.
In the simplified formulation which is developed for random network of disc-shaped fractures, the temperature term is similar to the pressure term, with the Biot’s coupling term replaced by Eα/(1-2ν), where E and ν are elastic moduli and αis the linear thermal expansion coefficient.
For a given disc with a calculated change ∆θm(y) in the temperature profile of the adjacent rock block along the normal y direction, the deformation εis first constructed and after integration along the rock block length, we solve two equations for two unknowns, namely the closure u and the change in effective stress ∆σ´. These two equations are as follows:
ε= du/dy = –∆σ´/E* + α*∆θm(y) (11)
∆σ´ = kn0u a0/(u + a0) (12)
with E* = (1 –ν)E/(1 +ν)(1 – 2ν) the oedometric modulus and α* =α(1 –ν)/(1 +ν).
1.4.2 Shearing Mechanism
Each fracture represents a surface of weakness in the rock mass, such that changes in fracture fluid pressure or rock stress can cause the fracture to become unstable, resulting in shear slip along the fracture surfaces and an associated change in fracture hydraulic aperture. The shear stability of each fracture is assessed according to the Coulomb criterion, in which the shear forces on the fracture are resisted by cohesive and frictional forces. Shear slip along fracture surfaces is accompanied by an increase in fracture hydraulic aperture. This behavior is modeled in FRACAS by increas-ing the fracture hydraulic aperture in proportion to the relative shear displacement of the fracture surfaces.
At any given fracture center of known depth and orientation, the normal stress and shear stress components are derived, assuming an homogeneous stress state, linearly variable with depth. The algorithm translating excess of shear forces into slip and dilation is derived from Willis-Richard et
al. (1996). The normal increase of aperture is arbitrarily
bounded to two-times the initial aperture a0 to reflect some damaging fracture surface processes. In turn, a back stress is applied, normal to the fracture and proportional to this change of aperture and to the fracture stiffness kn at that effective normal stress level. This stiffness is given as:
(13) k du d k a a n = = n σ 0 0 2 K C t m m m m m ρ θ θ ∆ =∂ ∂
1.4.3 Accounting for Stimulation Treatments
Injection at high flow rate and high pressure are generally used to reach in the vicinity of a bore hole a critical mechanical regime with low effective normal stresses that causes fractures to shear and dilate. In this paper, we directly apply the above mechanism in sub-volumes around the well using a constant fluid over pressure, called stimulation pressure, and then turn the excess of resolved shear, if any, into some aperture increment. The final supported shear stress is less than its initial value controlled by fracture depth and orientation, while the normal stress component is somewhat enlarged according to (13).
The size and shape of the stimulated sub-volumes are directly inferred from the location and the in situ extension of the cloud formed by all the induced seismic signals located around the wells. It is important to notice that the overpressured fractures will remain mechanically stable during any further hydraulic test at lower injection regime, in accordance with the effective stress law for shear failure.
1.5 Transport Module for Tracer Breakthrough Predictions
A particle following technique has been implemented, with the assumption of perfect mixing at the fracture intersections and no interaction along the fracture walls. Particles are injected along a particular location (e.g. a bore hole). The mean transit time in each fracture ta is derived from the calculated local fluxes, under current normal stress conditions, which reflects the true tortuosity via the factor F and from the fracture volume, which is the area times the available aperture a. A local dispersion factor (Taylor mechanism) is considered to account for the roughness of the fracture walls and result in a gaussian distribution of the residence time, around the mean value of the transit time. Because of the channel model for flow, the swept area in the fracture plane is larger than the channel area. A geometrical correction factor C is therefore introduced to reflect this effect. This parameter has the magnitude of the ratio of areas in contact between the two opposite faces of the fracture walls. To build the mean residence time tr in a given fracture, we calculate tr= ta×C. Although C can be estimated from
fractures samples on cores and is known to be stress dependant (Capasso et al., 1999), the upscaling of C to the real fracture size is highly uncertain and it has generally to be calibrated. However, guidelines can be obtained from numerical tests on single fracture models. Using fractal models for describing the variable aperture distribution, see for instance Jeong (2000), it is possible at the single fracture scale, to perform a first analysis on the dependency on contact area, accessible areas, mean travel time, path length distribution, particle dispersion, at increasing normal loading and closure levels.
2 APPLICATION TO A SITE SPECIFIC DATA BASE: THE HDR SOULTZ-SOUS-FORÊTS GEOTHERMAL PROGRAM
2.1 Geometry
The conceptual geometrical model of the investigated system is basically a hierarchical model made of the superimposition of different types of discontinuities belonging to three length scales. This simplified model seeks to capture most of the geometrical information provided by the bore hole obser-vations, together with the delineations derived from the microseismicity records obtained during hydraulic stimulation phases (see Fig. 2a) and the exact locations of the main flowing features obtained from injection and production flow logs (Fig. 2b).
The faulted block considered is 2 km ×2 km × 1 km in size. The blue segment in Figure 2a refers to GPK1 open section which extends from 2.9 km down to 3.6 km. The red segment refers to GPK2 open section, that extends from 3.2 km down to 3.8 km, 450 toward the south of GPK1. Main structures are parallel, with strike North 150 and dip 60 East, while additional fractures North 170, 70 East represent the stimulated major fractures, embedded in the stimulated zones
(Fig. 3b).
The whole domain is filled with a random network of fractures, disc shaped with 25 m of radius in average, belonging to two equally dense sub-vertical directional sets, respectively striking North 150 and North 180. These parameters are derived from previous analysis on fractures performed by Dezayes et al. (1995) at shallower depths on this site and more recently by Genter et al. (2000).
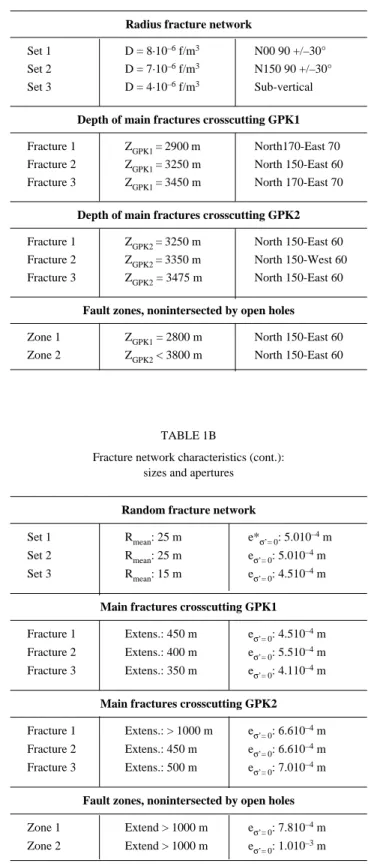
The main structure is the one crosscutting GPK1 behind the casing shoe, and connected to the well, through a sub-vertical fracture. A second main structure has been added, that passes south and below GPK2, without crosscutting it directly. Parameters calibrated for this study are listed in Tables 1a and 1b.
2.2 Pre-calibration of Hydraulic Parameters against the Transient Interference Tests
2.2.1 Extension of the Stimulated Zones
The stimulated areas used in the numerical model are illustrated in Figure 3b. The fractures belonging to these zones have been sheared with 8.5 MPa in the vicinity of GPK1 open section and 11.5 MPa of over pressure in the vicinity of GPK2. These values correspond to averaged values measured during stimulation treatments and that are assumed uniform within the stimulated zones.
Shearing is controlled by a friction angle φof 35°, a zero cohesion and an angle of dilation fixed to 5° to turn sliding motion into a normal and irreversible increase of fracture aperture. Stimulated zones along both bore holes do not
Figure 3a
View from north west of the modeled volume, showing the major faults and main fractures at the wells. Open hole section of GPK1 is the blue segment, the open hole section of GPK2 is the red segment. The yellow segment is a pre-figuration of a third well drilled symmetrically to the north. For visualization, two horizontal planes crosscut the domain at the respective depths of 2.9 km and 3.25 km. The bottom surface of the block lies at 4 km in depth.
Figure 3b
View from north west of the modeled stimulated sub-volumes, along both bore holes sections. These are ellipsoidal in shape, with 100 to 150 m of typical half length size.
TABLE 1A Fracture network characteristics: locations, densities and orientations
Radius fracture network
Set 1 D = 8·10–6f/m3 N00 90 +/–30°
Set 2 D = 7·10–6f/m3 N150 90 +/–30°
Set 3 D = 4·10–6f/m3 Sub-vertical
Depth of main fractures crosscutting GPK1
Fracture 1 ZGPK1= 2900 m North170-East 70 Fracture 2 ZGPK1= 3250 m North 150-East 60 Fracture 3 ZGPK1= 3450 m North 170-East 70
Depth of main fractures crosscutting GPK2
Fracture 1 ZGPK2= 3250 m North 150-East 60 Fracture 2 ZGPK2= 3350 m North 150-West 60 Fracture 3 ZGPK2= 3475 m North 150-East 60
Fault zones, nonintersected by open holes
Zone 1 ZGPK1= 2800 m North 150-East 60 Zone 2 ZGPK2< 3800 m North 150-East 60
TABLE 1B
Fracture network characteristics (cont.): sizes and apertures
Random fracture network
Set 1 Rmean: 25 m e*σ’= 0: 5.010–4m
Set 2 Rmean: 25 m eσ’= 0: 5.010–4m
Set 3 Rmean: 15 m eσ’= 0: 4.510–4m
Main fractures crosscutting GPK1
Fracture 1 Extens.: 450 m eσ’= 0: 4.510–4m
Fracture 2 Extens.: 400 m eσ’= 0: 5.510–4m
Fracture 3 Extens.: 350 m eσ’= 0: 4.110–4m
Main fractures crosscutting GPK2
Fracture 1 Extens.: > 1000 m eσ’= 0: 6.610–4m
Fracture 2 Extens.: 450 m eσ’= 0: 6.610–4m
Fracture 3 Extens.: 500 m eσ’= 0: 7.010–4m
Fault zones, nonintersected by open holes
Zone 1 Extend > 1000 m eσ’= 0: 7.810–4m
Zone 2 Extend > 1000 m eσ’= 0: 1.010–3m
* Hydraulic aperture under zero effective normal stress, a0, or maximum closure. According to the selected closure law, the hydraulic aperture a for three different evels of normal stress, respectively 5, 15 and 25 MPa, varies with the following magnitudes: a(σ´= 5)= 0.7 a0, a(σ´= 15)= 0.4 a0, a(σ´= 25)= 0.3 a0.
overlap. The rest of the random network of disc shaped fractures, that entirely fills the modeled rock block, does not experience this shearing treatment. As a result the local stress tensor acting upon a stimulated fracture slightly departs from the initial stress state which was controlled by depth solely. There is no attempt to account for any large scale stress heterogeneity, translating recent fault movements in the area, because no reliable data base would support such an hypothesis.
2.2.2 Calibrating the Joint Closure Behavior and Global Network Porosity
The propagation of the pressure wave and the pressure decay during shut-in phases is used to evaluate the magnitude of the stiffness of the fractures connecting both bore holes. The initial aperture distribution, under zero stress, that controls the overall porosity and the storage capabilities of the system is also investigated. These efforts lead to the parameters closed to those listed in the second part of Table 2. However it must be agreed that these results, as shown in Figure 4, do not exactly match in situ observations. The injection pressure should have reached 4 MPa, while the production rate was
TABLE 2
Physical parameters used in the numerical simulations. Extracted from Baria et al. (1999)
Stress distribution
Maximum hor. gradient 0.029 MPa m–1
Minimum hor. gradient 0.014 MPa m–1
Vertical stress gradient 0.026 MPa m–1
Max. hor. stress at 4 km 103 MPa Min. hor. stress at 4 km 54 MPa Vertical stress at 4 km 103 MPa Max. stress/north 10 Deg
Temperature field
Gradient 0.025 km–1
Temperature at 4 km 170 C
Rock properties
Density 2600 kg m–3
Young’s modulus 40 000 Mpa Poisson’s ration 0.22 – Thermal expansion 0.8 10–6 k–1
Solid heat capacity 900 J kg–1k–1
Heat diffusivity 1.15 10–6 m2s–1 Fracture parameters
Friction tg(φ) 0.7 –
Cohesion 0.0 MPa
Dilation angle 5 Deg
Fluid properties
Density 1000 kg m–3
Dynamic viscosity µ(θ) Bingham law Pa s–1
Figure 4
Simulation of interference tests between GPK1 and GPK2. Injected flow (l s–1) at GPK1 (step-wise curve) and draw
down at the production GPK2 (m) are prescribed during time. Injection head at GPK1 and produced flow at GPK2 are the model outputs.
throughout the present work is to avoid focusing on too short experiences where initial and boundary conditions are not well identified (fluid salinity, temperature history, pressure distribution, etc.), and therefore we use these first estimates to refine the analysis at the scale of the circulated system with the most unperturbed situation, by trying to stick as far as possible with the general trends and the maximum of quantified observations.
2.3 Simulation of the Circulation Test (1997) and of the First Tracer Test
During this hydraulic test, the injected flow is fixed at 22 l/s at GPK1. A –1.8 MPa draw down is prescribed at the GPK2 open hole section. This downstream boundary condition accounts for buoyancy effects as a driving force for fluid extraction in the production well, estimated at about 0.7 MPa. They correspond to the hydraulic regime prevailing at the site when the tracer (organic, benzoic acid, amino-G) was injected.
Aperture values are refined as well as the characteristics of the stimulated zones, so that the calculated injection pressure reaches 3.1 MPa and the produced flow stabilizes around 20 l/s. The solution is obviously non unique, but we are interested in a combination of parameters that full fill the maximum of site specific measurements. For different sets of calibrated parameters, admissible with regard to the hydraulics, we perform a transport modeling experiment.
A set of 100 000 inert particles are then injected in the open section of GPK1 bore hole. Different responses are produced among which a particular one, with 42% of the total mass collected at the downstream boundary within
32 400 350 300 250 200 150 100 50 0 24 16 8 28 20 12 4 0 0 1440 2880 4320
Elapsed time (min)
(l/s) (m)
5760 7200 8640 10080
GPK2 - Flux out
GPK2 - Draw-down
100 days, shows some agreement with the ~30% mass recovery observed at the site.
The best fit illustrated in Figure 5 has been obtained by using a correction factor C for the transit time of about 5 for the random fracture-discs and 3 for the planar faults. The breakthrough curves show how the upper part of GPK2 contributes to the global tracer recovery. Early breakthrough is found to correspond to paths intersecting GPK2 below 3.3 km. The combination of two main paths across the reservoir seems sufficient to explain the shape of the tail of the curve.
The limited mass recovered highlights the open nature of the reservoir to the top. Conversely, the prescribed head depletion around GPK2 yields a continuous but separate water supply through the principal faults that insures the in
situ observed global fluid balance (Baumgartner et al., 1998).
2.4 Numerical Simulation of the Four Months Long Circulation Experiment
Keeping constant the above set of parameters, a 120 days long period of injection is simulated, with the same boundary conditions. Fluid is entering the system at a constant temperature of 60°C. As a result of the gradual cooling of the fracture wall near the injection bore hole, the calculated injection pressure slowly decreases as shown in Figure 6, while more and more fluid is entering the network at the top of the injection zone. This behavior fits with the in situ general observed pressure trends depicted by Figure 2a and is in agreement with the observed evolution in flow logs
(e.g. measurements respectively performed on 18 July and 27 October 1997, Figure 2b, after Baria et al., 1999).
In Figure 7, the calculated stress perturbation due to the matrix cooling is illustrated. Traction develop close to the reinjection zone, where the prescribed temperature drop is about 100°C. After three months of fluid circulation, significant changes, larger than 0.15 MPa, can be found at distances up to 150 m from the injection zones. The normal stress drop at the entry point can be larger than 2 MPa. It is interesting to notice that these stress changes do not allow any of the pre-stimulated fractures to be reactivated, since the criterion for shear can not be met with a fluid pressure less than 4 MPa in the thermally perturbated zone. However, according to the relation (13) and to the aperture versus effective stress relationship depicted in Table 1b, a drop of 1 MPa in the effective stress corresponds to an hydraulic aperture increase of about ten microns, which in turn induces an increase of the hydraulic conductivity of about 10%. This is the main noticeable effect after a four months long period of fluid circulation.
2.5 Simulation of the Second Tracer Test
To evaluate the induced perturbations of the thermo-mechanical effects on the transport properties of the circulated reservoir, a second tracer test is simulated, starting at the date 94 days, on the Figure 6. The same amount of inert particles is injected in the well and we resimulate the breakthrough curve, keeping the whole set of parameters as it was obtained in the previous transient calculation at the date
Figure 5
Observed and calculated tracer breakthrough curves after steady state conditions for flow are met (~day 13) in Figure 5. Contribution of the upper zone (dark blue) and lower zone (cyan) to the global recovery (blue). Measurements are reported in yellow.
Figure 6
Long term circulation test. A constant flow at GPK1 and a constant head at GPK2 are prescribed. Calculations show how the injected pressure (solid line) decreases from 3.5 MPa down to 2.5 MPa within three months while the injected flow is redistributed along GPK1, in favor of the upper entry point (dark blue curve).
Tracer test August 1997 - benzoic acid
0 14 28 42 56 70 Elapsed time (day)
84 98 112 126 1000 800 600 400 200 0 (Mass/day) GPK2 - (3200, 3300) GPK2 - (3300, 3600) GPK2 Measurements 20 400 350 300 250 200 150 100 50 0 15 10 5 0 0 14 28 42 56 70 Elapsed time (day)
Flow rate (l/s) Injection head (m) 84 98 112 126 GPK1 - (2800, 3000) GPK1 - (3000, 3300) GPK1 - (3300, 3600) GPK1 - injection head GPK1 - start tracer
94 days. Thus, the injection pressure is lower than in the first tracer test and the impedance of main fractures close to the injection well has evolved according to the change in effective stress derived from Figure 7 results. We obtained a very comparable overall breakthrough curve, but the interesting outcome concerns the distribution of the particles at the production well. This production well is again separated in two zones, an particles are transferred from the upstream boundary toward one of these downstream boundaries, thus generating two breakthrough curves
(Fig. 8). The upper part of GPK2 part seems now more
productive, or more directly linked with the source zone in GPK1 since more particles are produced in this sub-zone. However, the early particles still arrived from the deeper part of the reservoir, rather quicker, although the breakthrough curve for this zone indicates that less particles have traveled toward the deepest part of the production zone. This could form a basis for a quantitative understanding of in situ results shown in Figure 2c.
CONCLUSION
The general performance of the present model measured against the whole data-package is considered as satisfactory enough, to suggest that the discrete fracture network approach is suitable for valuable prospective calculations.
The specific hydraulic behavior and coupled processes that develop in time in such systems can be discussed and it is hoped that the methods and results will translate into informative predictions for the next phase of the project. The
new aim is the development of three well pilot system, drilled from a common platform close to the GPK2 well, down to a true vertical depth of 5 km, with rock temperatures of about 200°C.
Lessons learned from the modeling of the four months circulation test are of great importance for the next future of the project. In this graben type reservoir, it is likely that transfer along large distances are governed by a few main zones which do not connect directly the pair of wells. These zones could be easily reactivated, sheared and self-propped by injection at high regime, because of the low supported normal stress.
It has been concluded from modeling that cooling around the reinjection bore hole gives rise to significant tractions across fractures, after short periods of times (some months). Because stresses and natural temperatures enlarge with depth, and because the applied temperature drop is constant along the well, the injected fracture zones that are close to the top of the open hole section may be more sensitive to any induced thermal stress change.
This may induce at least a redistribution of flow in the vicinity of the reinjection bore hole and some evolution of the global hydraulic properties, but may also end by a permanent change of the main flow paths across the fractured reservoir. It is therefore anticipated that the equivalent heat exchange area used for temperature draw down computations will evolve during the reservoir life time and that it should be accounted for when running predictions for future energy production and for economic related purposes. However it is also acknowledged that the hydro-thermo-mechanical coupling presented here may not be adequate for handling
Tracer test August 1997 - Amino-G
0 14 28 42 56 70 Elapsed time (day)
84 98 112 126 1000 800 600 400 200 0 (Mass/da y) GPK2 - (3200, 3300) GPK2 - (3300, 3600) GPK2 Measurements Figure 7
Fractures within the network where the induced thermal traction is larger than 1% (approximately 0.15 MPa) of the initial effective normal stress at the end of the four months circulation test.
Figure 8
Tracer breakthrough after about ten weeks of injection (day 94 in Fig. 6). Updated contributions of the upper zone (dark blue) and lower zone (cyan) to the global recovery (blue) modeled at the production well.
long term interactions. To address these coupled effects at relevant time scales, other numerical schemes must be proposed. Sub blocks of rock should exchange heat and stress changes calculated at a given fracture should induce displacements at other locations as it is suggested in Hicks et
al. (1996). Alternative boundary element methods based on
the superposition of elastic solutions in infinite rock masses could be helpful to evaluate, in non regular fracture patterns, the critical flow rate required for the thermal induced stresses to trigger shear propagation along fractures at a further date.
ACKNOWLEDGEMENTS
The research described in this paper was supported by the European Commission DG XII, in the framework of the Non Nuclear Program, Joule III, concerted action JOR3-CT98-0313 and ADEME (French Agency for Environment). The author would like to thank SOCOMINE for sharing data and making fruitful suggestions for this study.
REFERENCES
Armstead, H.C.H. and Tester, J.W. (1987) Heat Mining, a New
Source of Energy. E&FN Spon Ltd, London.
Baria, R., Baumgartner, J. and Gérard, A. (1996) European Hot
Dry Rock Programme 1992-1995, Extended Summary of the
Final Report to EC (DGXII), contract JOU2-CT92-0115. Baria, R., Baumgartner, J., Gérard, A. and Jung, R. (1999)
European Hot Dry Rock Geothermal Research Programme 1996-1997, EC Final Report (DGXII) EUR18925ER.
Barton, N., Bandis, S. and Bakhtar, K. (1985) Strength, Deformation and Conductivity Coupling of Rock Joint. Int. J.
Rock Mech. Min. Sci. & Geomech. Abstr., 22, 3, 121-140.
Baumgartner, J., Gérard, A., Baria, R., Jung, R., Tran-Viet, T., Gandy, T., Aquilina, L. and Garnish, J. (1998) Circulating the HDR Reservoir at Soultz: Maintaining Production and Injection Flow in Complete Balance. Proc. of Twenty-Third Workshop
on Geothermal Reservoir Engineering, Stanford University,
Stanford, California, Jan. 26-28.
Bruel, D., Cacas, M.C., Ledoux, E. and de Marsily, G. (1994) Modelling Storage Behaviour in a Fractured Rock Mass. J. of
Hydrology, 162, 267-278.
Bruel, D. (1995) Heat Extraction Modeling from Forced Fluid Flow through Stimulated Fractured Rock Masse Application to the Rosemanowes HDR Reservoir. Geothermics, 24, 3, 361-374. Cacas, M.C., Ledoux, E., Marsily, G. de, Barbreau, A., Tillie, B., Barbreau, A., Durand, E., Feuga, P. and Peaudecerf, P. (1990) Modeling Fracture Flow with a Discrete Fracture Network: Calibration and Validation, 1. The Flow Model. Water Resources
Research, 26, 3, 479-489.
Capasso, G., Scavia, C., Gentier, S. and Pellegrino, A. (1999) The Influence of Normal Load on the Hydraulic Behaviour of Rock Fractures. In Proc. of International Congress on Rock
Mechanics,Vouille and Berest eds, Paris, France, 863-868,
Balkema, Rotterdam.
Dershowitz, W.S. and Fidelibus, C. (1999) Derivation of Equivalent Pipe Network Analogues for Three Dimensional
Discrete Fracture Networks by the Boundary Element Method.
Water Resources Research, 35, 9, 2685-2691.
Dershowitz, W.S., Lee, G. and Eiben, T. (1999) Discrete Fracture Network Approach for Thermally Assisted Gravity Segregation Enhanced Oil Recovery. Proc. 9th ISRM Congress on Rock
Mechanics, Paris, France, 435-439.
Dezayes, C.H., Villemin, T., Genter, A., Traineau, H. and Angelier. J. (1995) Analysis of Fractures in Boreholes of the Ho Dry Rock Project at Soultz-sous-Forêts (Rhine Graben, France).
Scientific Drilling, 5, 31-41.
Genter, A., Traineau, H., Bourgine, B., Ledesert, B. and Gentier, S. (2000) Over Ten Years of Geological Investigations within the HDR Soultz Project, France. World Geothermal Congress 2000 (WGC2000, extended abstract).
Hicks, T.W., Pine, R.J., Willis-Richards, J., Xu, S., Jupe, A.J., and Rodrigues, N.E.V. (1996) A Hydro-Thermo-Mechanical Numerical Model for HDR Geothermal Reservoir Evaluation. Int.
J. Rock Mech. Min. Sci. & Geomech. Abstr., 33, 5, 499-511.
Jeong, W.C. (2000) Influence d’une zone de faille sur l’hydrogéologie en milieu fissure. Thèse de l’École des mines de
Paris.
Jeong, W.C. and Bruel, D. (2000) Modelling the Influence of Fault Zone Heterogeneity on Groundwater Flow and Radionucleide Transport. In Euradwaste 1999, Radioactive
Waste Management Strategies and Issues, C. Davies (eds), Nov.
1999, Luxembourg, EUR 19143 EN, 475-478.
Kolditz, O. and Diersch H.J. (1993) Quasi-Steady-State Strategy for Numerical Simulation of Geothermal Circulation in Hot Dry Rock Fractures. Int. J. Non-Linear Mechanics, 28, 4, 467-481. Kolditz, O. and Clauser, C. (1998) Numerical Simulation of Flow and Heat Transfer in Fractured Crystalline Rocks: Application to the Hot Dry Rock Site at Rosemanowes (UK). Geothermics, 27, 1, 1-23.
Parker, R.H. (1989) Hot Dry Rock Geothermal Energy. Phase 2B
Final Report of the Camborne School of Mines Project, 1,
Pergamon Press, Oxford.
Pribnow, D. and Schellschmidt R. (2000) Thermal Tracking of Upper Crustal Fluid Flow in the Rhine Graben. Geoph. Res.
Letter, 27, 13, 1957-1960.
Rejeb, A. and Bruel, D. (2001) Hydromechanical Effects of Shaft Sinking at Sellafield Site. Int. J. Rock of Mech and Min. Sci. &
Geom. Abstr, 38, 17-29.
Richards, H.G., Parker, R.H., Green, A.S.P., Jones, R.H., Nicholls, J.D.M., Nicol, D.A.C., Randall, M.M., Richards, S., Stewart, R.C. and Willis-Richards, J. (1994) The Performance and Characteristics of the Experimental hot Dry Rock Geothermal Reservoir at Rosemanowes, Cornwall (1985-1988).
Geothermics, 23, 2, 73-109.
Robinson, B.A., (1990) A Discrete Fracture Model for a Hot Dry Rock Geothermal Reservoir. In Camborne School of Mines
International Conference on Hot Dry Rock Geothermal Energy,
Ed. Roy Baria (1989), 315-327, Robertson Scientific, London. Willis-Richards, J., Wanatabe, K. and Takahashi H. (1996) Progress Toward a Stochastic Rock Mechanics Model of Engineered Geothermal Systems. J. of Geoph. Research, 101, B8, 17481-17496.
Witherspoon, P.A., Wang, J.S.Y., Iway, K. and Gale , J.E. (1980) Validity of the Cubic Law for Fluid Flow in a Deformable Fracture. Water Resources Research, 16, 6, 1016-1024.