HAL Id: tel-01973083
https://tel.archives-ouvertes.fr/tel-01973083
Submitted on 8 Jan 2019
HAL is a multi-disciplinary open access
archive for the deposit and dissemination of
sci-entific research documents, whether they are
pub-lished or not. The documents may come from
teaching and research institutions in France or
abroad, or from public or private research centers.
L’archive ouverte pluridisciplinaire HAL, est
destinée au dépôt et à la diffusion de documents
scientifiques de niveau recherche, publiés ou non,
émanant des établissements d’enseignement et de
recherche français ou étrangers, des laboratoires
publics ou privés.
David Guyon
To cite this version:
David Guyon. Supporting energy-awareness for cloud users. Networking and Internet Architecture
[cs.NI]. Université Rennes 1, 2018. English. �NNT : 2018REN1S037�. �tel-01973083�
THÈSE DE DOCTORAT DE
L’UNIVERSITE DE RENNES 1
COMUE UNIVERSITE BRETAGNE LOIRE
Ecole Doctorale N°601
Mathématiques et Sciences et Technologies
de l’Information et de la Communication
Spécialité : Informatique
Par
« David GUYON »
« Supporting Energy-awareness for Cloud Users »
Thèse présentée et soutenue à R
ENNES, le 7 décembre 2018
Unité de recherche : IRISA – UMR6074
Rapporteurs avant soutenance :
Sébastien MONNET, Professeur, Université Savoie Mont Blanc, LISTIC Jean-Marc PIERSON, Professeur, Université de Toulouse, IRIT
Composition du jury :
Président : Jean-Marc MENAUD, Professeur, IMT-Atlantique, LS2N
Examinateurs : Laurent LEFEVRE, Chargé de recherche, Université de Lyon, Inria, LIP Guillaume PIERRE, Professeur, Univ Rennes, Inria, CNRS, IRISA Sébastien VARRETTE, Chargé de recherche, Université du Luxembourg Dir. de thèse : Christine MORIN, Directrice de recherche, Inria, IRISA
“However difficult life may seem, there is always something you can do, and succeed at. It matters that you don’t just give up.”
Remerciements
Cette thèse est le résultat d’un investissement d’un peu plus de 3 ans. Elle a été pour moi une expérience unique à ma vie qui n’aurait pas été possible sans l’implication de nombreuses personnes. Tout d’abord, je tiens à remercier l’ensemble des membres de mon jury pour l’intérêt que vous avez porté envers mes travaux de recherche et le temps que vous y avez investi. Je remer-cie Jean-Marc Pierson et Sébastien Monnet d’avoir accepté de rapporter ce manuscrit et pour vos retours enrichissants. Je remercie également Laurent Lefèvre, Guillaume Pierre et Sébastien Varrette d’avoir pris le temps d’assister à ma soutenance et Jean-Marc Menaud pour l’avoir présidé. Je souhaite exprimer ma gratitude envers mes deux encadrantes, Anne-Cécile Orgerie et Chris-tine Morin, pour m’avoir permis de réaliser une thèse sur un sujet si passionnant et pour m’avoir soutenu tout durant cette aventure. Merci pour votre patience, votre apport pédagogique et sci-entifique, vos nombreux conseils et retours toujours donnés avec soin et qualité. J’ai apprécié travailler avec vous.
Merci à l’ensemble de l’équipe Myriads pour son accueil et plus généralement aux personnels et agents de l’IRISA. Merci pour tous ces bons moments passés ensemble. Un merci particulier envers mes anciens collègues de bureau, Ismael et Yunbo, avec qui je n’oublierai pas la marche de nuit en forêt Australienne et les soirées burger/cinéma à Rennes. À toi Benjamin C., qui a dû supporter ma période de rédaction. Et pour finir, merci à toi Benjamin R. pour ton soutien autour de notre double café quotidien.
Cette thèse a été ma première expérience dans l’enseignement et cela n’aurait pas été possible sans vous, Guillaume et Cédric. C’était un plaisir de découvrir cette discipline avec votre soutien pédagogique. Clin d’œil à Cédric pour ces heures d’échanges musicaux qui offraient d’agréables moments de déconnexion.
Mes parents, Laura, mes amis, mes colocataires, comment pourrais-je tous vous remercier ? Vous êtes merveilleux. Vous m’avez supporté au quotidien avec ma présence et mes humeurs plus ou moins variables au cours du temps. Merci. Amis relecteurs, merci à vous aussi pour l’investissement et le soin dont vous avez fait preuve.
Joyce, pour ton amour généreux.
Mon jardin pour tous ces moments de repos.
Et la vie plus généralement pour tout ce qu’elle permet. “Le naturel est miraculeux” 1.
Contents
Résumé en français 13
1 Introduction 19
1.1 General Context . . . 19
1.2 Research Problem and Objectives . . . 20
1.3 Contributions . . . 22
1.4 Organization of the Manuscript . . . 23
2 State of the Art on Energy in Cloud Systems 25 2.1 Introduction on Cloud Computing . . . 26
2.1.1 From Virtualization to Cloud Computing . . . 26
2.1.2 Live Migration Technique . . . 27
2.1.3 Service Models Decomposed in Three Layers . . . 28
2.1.4 Classification of Cloud Computing Applications . . . 29
2.2 Energy Footprint of Cloud Computing Systems . . . 31
2.2.1 Difference between Power and Energy . . . 32
2.2.2 Datacenters Energy Model . . . 32
2.2.3 Energy Consumption of Network Devices . . . 33
2.2.4 Energy Consumption of Physical Machines . . . 34
2.2.5 Modeling Energy of Cloud User Tasks . . . 34
2.2.6 Metrics on Energy and Performance . . . 35
2.3 Physical Machine Techniques to Save Energy . . . 37
2.3.1 Shutting Down Techniques . . . 38
2.3.2 Processor-level Energy Saving Techniques . . . 38
2.3.3 Energy-proportionality . . . 39
2.3.4 Other Physical Machine Energy Saving Techniques . . . 40
2.4 Energy Optimizations at Datacenter Level . . . 40
2.4.1 Efficient Location Selection for Virtual Machine Initial Placement . . . 41
2.4.2 More Efficiency with Resource Consolidation . . . 43
2.4.3 Adapting Resources to Load with Elasticity . . . 44
2.4.4 Shifting Virtual Machines in Time to Save Energy . . . 44
2.5 Energy Optimizations Involving Cloud Users . . . 45
2.5.1 Eco-friendly Motivation Systems . . . 45
2.5.2 Cloud Business Model . . . 46
2.5.3 SLA: Beyond Performance, Toward Energy . . . 47
2.5.4 Energy-related User Parameters . . . 48
2.6 Conclusions . . . 49
3 Including IaaS Users in the Energy Saving Quest 51 3.1 Problem Definition . . . 52
3.2 Objectives and Proposition . . . 53
3.3 Helping Users to Select a Datacenter with an Eco-friendly Metric . . . 54
3.3.1 Definition of the GLENDA Metric . . . 54
3.3.2 Functional Soundness . . . 55
3.4 Providing an Easy-to-use Means of Action . . . 61
3.4.1 Context and Motivation . . . 61
3.4.2 Our Approach . . . 62
3.5 Experimental Validation . . . 66
3.5.1 Experimental Setup for Experiments based on a Real Infrastructure . . . . 66
3.5.2 Benefit of the IaaS Users inclusion in a Real Cloud Environment . . . 67
3.5.3 Experimental Setup for Simulation-based Experiments . . . 69
3.5.4 Impact of the User Profile Distribution on Energy Saving . . . 74
3.6 Discussions . . . 76
3.6.1 Assessing Environmental Awareness Evolution by Providers . . . 76
3.6.2 Consideration of the Infrastructure Knob for Users . . . 77
3.7 Conclusions . . . 77
4 Involving PaaS Users in an Energy-efficient Cloud Design 79 4.1 Context and Assumptions . . . 79
4.2 Proposition . . . 81
4.2.1 System Architecture Overview . . . 82
4.2.2 Resource Availability Management . . . 85
4.2.3 Execution Contract Energy Estimation . . . 86
4.3 Experimental Validation . . . 87
4.3.1 Experimental Setup . . . 87
4.3.2 Result Analysis . . . 88
4.4 Discussions . . . 91
4.5 Conclusions . . . 92
5 Understanding the Impact of PaaS Parameters on Energy 95 5.1 Context and Motivation . . . 95
5.2 Experimental Study . . . 97
5.2.1 Experimental Setup . . . 97
5.2.2 Experimental Results . . . 101
5.3 Discussions . . . 105
5.4 Conclusions . . . 106
6 Conclusions and Perspectives 109 6.1 Conclusions . . . 109
6.2 Future Directions . . . 110
6.2.1 Grey Box Conceptual Model for Cloud Applications . . . 110
6.2.2 Energy-related Metrics Dedicated to Cloud Applications Users . . . 111
6.2.3 Energy Optimizations Launched by Cloud Applications Users . . . 112
Author’s Publications List 113
List of Figures
1 Comparée avec la consommation en électricité des pays (en milliard de kWh), le secteur des TICs était le 3`eme consommateur d’électricité au niveau mondial en
2012 [1]. . . 13 2 Dans cette thèse, l’utilisateur du cloud est inclus dans les systèmes d’optimisation
énergétique en fournissant à la fois une information liée à l’énergie et un moyen d’action. Le but de cette inclusion est d’améliorer les optimisations afin de réduire l’énergie consommée par les centres de calcul. . . 15 1.1 Compared with the electricity consumption of countries (in billion kWh), the ICT
sector was the 3rd world wide electricity consumer in 2012 [1]. . . 20 1.2 In this thesis, the cloud user is included in energy optimization systems by providing
both energy-related information and means of action. The goal of this inclusion is to enhance optimizations in order to reduce the energy consumed by datacenters. 21 2.1 Virtualized resources are managed by an hypervisor that runs on top of the operating
system of a physical machine. Actions taken by the hypervisor, such as the creation of a guest OS, are based on instructions sent by the upper cloud management layer according to user requests. . . 27 2.2 Cloud computing is composed of three service layers, each responding to a different
objective. Example of Microsoft and Google solutions are given next to each layer. 28 2.3 A three-tier web application architecture is composed of a presentation tier (web
server), an application tier (application server) and a data tier (database server). 30 2.4 Montage [48] workflow (left side) and Blast [49] workflow (right side) are two
exam-ples of scientific workflows, respectively network/data intensive and CPU/memory intensive. . . 31 2.5 Distribution of the energy consumed in a given datacenter at the building level, the
IT room level, and the PMs level. The data used in this figure is from the most recent papers we found on this subject in the literature, [60] and [59], published respectively in 2012 and 2017. . . 33 2.6 Energy proportionality is computed as 1 minus area A divided by area B ; area A
is defined as the area between the PM curve and ideal curve, and area B is defined as the area below the ideal curve [72]. . . 40 2.7 Scheduling algorithms are classified in three categories, each of them with
differ-ent computation costs. Only exact approaches can guarantee an optimal solution. However, they have exponential time complexity and thus are impractical for large problem sizes. . . 41 2.8 Examples of ecological labeling systems targeting HPC and ICT industries. . . 46 3.1 Problematic on energy efficiency and environmental impact of IaaS datacenters
de-fined at three levels: use of renewable energy, datacenter energy loss and IT equip-ment energy efficiency. . . 52
3.2 Big picture of our cloud system where IaaS providers deliver the value of a new met-ric that assesses their environmental impact, thus enabling environmentally aware users to select their providers. Additionally, users can involve themselves in sav-ing energy thanks to a new IaaS knob. This parameter allow users to indicate an energy/performance trade-off. . . 53 3.3 Representation of the power consumption of a typical PM (baseline) and a fully
power-proportional PM (PP). . . 54 3.4 Definition of the total energy consumption and dynamic energy consumption of a
PM. . . 54 3.5 Per-hour GEC variation of the 1st of November 2015. . . . 57
3.6 Variation of GLENDA, power consumption and usage ratio from November 2015 in the baseline scenario. . . 58 3.7 GLENDA comparison with scenarios where the infrastructure uses power-proportional
PMs and full resource usage users’ applications. . . 59 3.8 GLENDA comparison of a varying PUE with the baseline and PP scenarios. . . . 59 3.9 GLENDA comparison of a varying GEC with the baseline and PP scenarios. . . . 60 3.10 The ecolabels are distributed to each scenario according to their monthly average
value of GLENDA. . . 60 3.11 Definition of the terms step and task in a workflow. . . 61 3.12 IaaS system architecture where the user sends her application workflow definition
and chooses an execution mode that has the ability to impact the overall consolida-tion of resources. . . 62 3.13 Flavor selection mechanism . . . 64 3.14 Details on the selection of the PM on which the requested VM should be deployed. 65 3.15 Montage workflow has 3 parallel tasks for the 1st step and 1 task for the 2ndone. 66 3.16 Output image of the execution of Montage when configured on the Pleiades space
location. . . 66 3.17 Results of an execution of two workflows in parallel (Montage 1 and Montage 2 ),
both in Medium execution mode. . . 68 3.18 Energy consumption and total duration averages and standard deviations of 5
exe-cutions of both Montage applications in each execution mode. . . 69 3.19 Simulator architecture with its inputs and outputs. . . 69 3.20 UML diagram representation of the Python simulator. . . 70 3.21 Workloads based on a real trace from the utilization logs of the MetaCentrum Czech
National Grid. . . 71 3.22 Blast workflow has 4 parallel tasks for its 1st step. . . 71 3.23 Palmtree workflow has 2 parallel tasks for its 1st step. . . 71 3.24 Power measurement of a PM running the Blast workflow in Little mode and with 2
additional VMs in order to completely load the machine. Each vertical dashed line indicates a VM finishing its execution. . . 73 3.25 Energy consumption and execution time of each workflow in each execution mode. 73 3.26 EC2 hourly pricing and the prorated pricing of each workflow in each execution
mode. . . 74 3.27 Percentage of energy saved in a datacenter according to the percentage of
applica-tions running with the Little mode (Medium mode kept at 0%) in comparison with a scenario not powering down idle machines. . . 76 4.1 Example of the Resource Availability of a PM that fluctuates according to the arrival
and departure of resource reservations. . . 81 4.2 Possible scheduling (execution contracts) of an 8 vCPUs application in an
infras-tructure with 2 PMs and 3 VMs. Starting the application at submission time (C1) requires to turn on PM 2. Delaying (C2) or changing the size (C3) can avoid the need of PM 2, thus saving energy. . . 81 4.3 Detailed system architecture with the components of both cloud layers and the
LIST OF FIGURES 7
4.4 The best contract is a contract within the Pareto frontier that has the shortest Euclidean distance with the origin. . . 84 4.5 The contract filtering component filters the ECs received for each ER using the
Shortest Euclidean Distance (SED) calculation and only keeps a total of 3 different contracts. . . 84 4.6 Execution time, hourly price and prorated price of Montage in all possible VM sizes. 88 4.7 Energy saving percentage and total monetary cost of all PaaS applications according
to the distribution of the contract selection made by PaaS users. . . 89 4.8 Percentage of energy saving with C2 contracts according to the allowed time window. 90 4.9 CDF of application delays according to the number of IaaS providers when all
ap-plications execute with contract C2. . . 90 4.10 The projection of the execution contracts considers the GLENDA dimension and the
best contract within the 3D Pareto frontier is the one with the shortest Euclidean distance with the origin. . . 92 5.1 Architecture of the RUBiS benchmark. . . 98 5.2 Definition of the total energy consumption and dynamic energy consumption. The
graph represents the power consumption of a PM hosting the application tier VM for the PHP5 version of RUBiS. The VM has 2 vCPUs. . . 100 5.3 Dynamic energy consumption of application tier and database tier VMs, alongside
with the response time for each application scenario with 2 vCPUs VMs. . . 101 5.4 Dynamic energy consumption of application tier and database tier VMs, alongside
with the response time for the two database scenarios with 2 vCPUs VMs. . . 102 5.5 CPU usage of both database tier VMs when processing 200 SQL requests in parallel.
Each request is a SELECT of 100,000 entries from the users table. . . 102 5.6 Dynamic energy consumption and performance of each scenario with an increasing
number of vCPUs during 30 minutes. The two first scenarios stand for the PHP5 and PHP7 versions. The remaining Tx Jy scenarios are for the Tomcat and Java versions where x and y equal to either 7 or 8. . . 104 5.7 Dynamic energy consumption of application tier and database tier VMs, alongside
with the response time of PHP7 and T7J7 scenario with two different VM configu-rations. . . 105
List of Tables
2.1 Definition of the Amazon EC2 M5 instances with their EU Paris price. . . 29
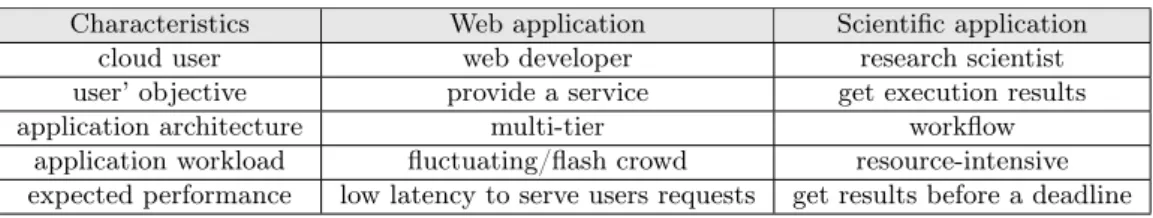
2.2 Details on the differences between web and scientific applications using cloud infras-tructures. . . 32
3.1 GLENDA classes . . . 55
3.2 Classification of energy sources between renewable or not. ROR* stands for run-of-the-river hydroelectricity equipped with storage reservoir. . . 57
3.3 Details of the VM flavors used in the system with their Amazon EC2 instance equivalent and their US East hourly pricing. . . 63
3.4 Flavors used for each step of the Montage workflow in the three different execution modes. . . 67
3.5 Flavors used for each step of Blast and Palmtree workflows in the three different execution modes. . . 72
3.6 Details of the execution of all the workflows on the three execution modes with the type and number of instances used, the required number of PMs, the execution time and the amount of energy consumed. . . 74
3.7 The simulation results give the energy consumption of a whole cluster used during 24h from 2AM to 2AM the next day and the maximum number of hosts used with various profiles of job execution modes. The table at the top is with workload A and the second one is with workload B. . . 75
4.1 List of VM flavors considered in the simulator with their Amazon EC2 hourly pricing for the EU Paris region. . . 87
4.2 Details of the cloud layers. . . 88
5.1 Two categories of PaaS parameters are taken into account. . . 97
5.2 List of application scenarios with their software definition. . . 99
5.3 List of database scenarios with their software definition. . . 99
Acronyms
ACO Ant Colony Optimization.ACPI Advanced Configuration and Power Interface. BF Best Fit.
BIOS Basic Input Output System. CDF Cumulative Distribution Function.
CMOS Complementary Metal-Oxide Semiconductor. CP Constraint Programming.
DCEM Data Center Energy Management. DCiE Data Center Infrastructure Efficiency. DVFS Dynamic Voltage and Frequency Scaling. ERF Energy Reuse Factor.
ETSI European Telecommunications Standards Institute. FF First Fit.
FLOPS Floating-Point Operations per Second. GA Genetic Algorithm.
GEC Green Energy Coefficient. GHG GreenHouse Gas.
HDD Hard Disk Drive.
HPC High-Performance Computing. IaaS Infrastructure-as-a-Service.
ICT Information and Communications Technology. ILP Integer Linear Programming.
KPI Key Performance Indicator. LP Linear Programming.
OS Operating System. PaaS Platform-as-a-Service. PDO PHP Data Objects. PDU Power Distribution Unit.
PHES Pumped Heat Electrical Storage. PM Physical Machine.
PMC Performance Monitoring Counter. PUE Power Usage Effectiveness. QoS Quality of Service.
RAPL Running Average Power Limit. ROR Run-Of-the-River.
RTE Réseau de Transport d’Électricité (French Electricity Transmission Network). SaaS Software-as-a-Service.
SLA Service Level Agreement. SLO Service Level Objective. SSD Solid State Drive.
TIC Technologies de l’Information et de la Communication. TUE Total-power Usage Effectiveness.
USB Universal Serial Bus. vCPU virtual CPU. VM Virtual Machine.
VMM Virtual Machine Monitor. VO/VO Vary-On/Vary-Off.
Résumé en français
Contexte général
En décembre 1997, 1.7% de la population mondiale avait accès à Internet. Vingt ans plus tard, il y a plus de 4157 millions d’internautes, représentant 54.4% de la population. Personne ne peut nier que l’espèce humaine est en train de vivre la révolution numérique. Alors que nous entrons dans l’ère du numérique, le secteur des Technologies de l’Information et de la Communication (TIC) doit en permanance s’adapter pour supporter cette adoption mondiale croissante pour les technologies numériques. De plus en plus de centres de calcul sont construits partout dans le monde pour surpasser la demande grandissante pour les services Internet, surtout que nous nous attendons à une adoption plus rapide des TICs à l’avenir.
Est-ce que cette évolution est écologiquement durable ?
Malheureusement, les centres de calcul sont connus pour leur impact environmental sur dif-férents aspects : la construction du bâtiment, le recyclage des appareils électroniques, l’énergie consommée pendant la phase d’usage, etc. En 2011, les TICs représentaient 1.9% des émissions globales de gaz à effet de serre, un niveau d’émission similaire au secteur mondial de l’aviation. L’année suivante, il a été montré que la demande totale en électricité de ce secteur, comparée avec la demande en électricité des pays, a placé le secteur des TICs à la 3eme` position des plus importants consommateurs d’électricité. Malheureusement, il n’y a pas de figure avec des chiffres plus récents que ceux de la Figure 1.
Figure 1: Comparée avec la consommation en électricité des pays (en milliard de kWh), le secteur des TICs était le 3`emeconsommateur d’électricité au niveau mondial en 2012 [1].
La réduction de l’empreinte environnementale des centres de calcul est devenue un sujet de recherche majeur qui a suscité un intérêt considérable de la part des scientifiques ces dernières années. De nombreux efforts de recherche ont déjà permis de réduire la consommation d’énergie des centres de calcul en augmentant leur efficacité énergétique. Cependant, en raison du para-doxe de Jevons, seulement augmenter l’efficacité énergétique peut engendrer une augmentation de l’utilisation en raison d’un accès moins coûteux aux ressources. Ci-après un exemple qui illustre
ce paradoxe : une personne qui conduit une voiture économique peut partiellement compenser l’économie de la technologie en conduisant simplement plus, car la conduite est à présent moins coûteuse. Diminuer la consommation d’énergie des centres de calcul réduit leur coût monétaire. Ainsi, les utilisateurs ont un accès moins coûteux aux services des TICs, ce qui pourrait entraîner une demande d’utilisation accrue. Cet effet contreproductif peut aboutir à une augmentation glob-ale de la consommation d’énergie, là où l’on s’attendrait à l’inverse. Les propositions de recherche ne prenant en compte que l’efficacité pour réduire la consommation d’énergie des centres de cal-cul pourraient ne pas être exemptes d’effets secondaires futurs. Le comportement des utilisateurs devrait aussi être pris en compte.
Dans le cas général, il a été démontré que l’augmentation des connaissances des utilisateurs a le potentiel de changer le comportement des consommateurs. Par exemple, le retour d’information énergétique aux utilisateurs est suffisant pour promouvoir la conservation de l’électricité. Aussi, les conseils et les récompenses, l’accès facile aux informations sur l’énergie via une application mobile et le suivi de l’énergie consommée accompagné de systèmes d’incitation ont la capacité de changer les comportements et de réaliser des économies d’énergie. Cependant, une bonne conception de la métrique délivrée est une condition essentielle pour que les consommateurs comprennent leur consommation.
Problème de recherche et objectifs
L’impact environnemental des centres de calcul est un problème de recherche extrêmement vaste. Leur impact est influencé par de nombreux critères tels que la construction du bâtiment, la pro-duction et le recyclage des équipements informatiques et l’efficacité globale du centre de calcul, qui peut s’avérer très faible en raison d’anciennes technologies de refroidissement. Compte tenu de leur énorme consommation d’énergie, leur localisation géographique suffit à influencer de manière sig-nificative leur impact sur l’environnement (e.g. la disponibilité de sources d’énergie renouvelables). Et la liste continue. Dans cette thèse, nous avons limité notre problématique pour ne cibler que l’énergie électrique consommée par les centres de calcul cloud pendant leur phase d’usage.
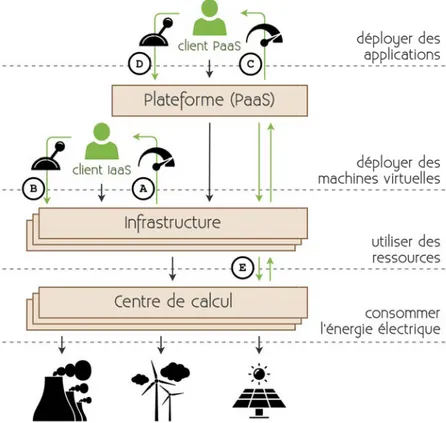
Le cloud computing est un modèle de système qui offre des services pratiques à leurs util-isateurs. Ces services, fondés sur des technologies de virtualisation, sont décomposés en trois couches différentes : infrastructure (IaaS), plateforme (PaaS) et application (SaaS). Dans les clouds d’infrastructure (IaaS), les utilisateurs demandent l’accès à une ou plusieurs machines virtuelles de tailles différentes qui s’exécutent sur des serveurs. Au niveau plateforme (PaaS), les développeurs y déploient leurs applications tandis que la plateforme se charge de la gestion et du maintien de leur bonne exécution. Enfin, la couche application (SaaS) donne aux utilisateurs un accès clé en main aux applications cloud.
Jusqu’à présent, de nombreuses études ont été menées pour fournir des solutions visant à réduire l’énergie consommée par les clouds. Ces solutions se concentrent principalement sur l’augmentation de l’efficacité énergétique des centres de calcul. Cependant, ces optimisations énergétiques sont mises en place par les fournisseurs de services sans tenir compte des utilisateurs finaux. Comme expliqué précédemment, il a été montré dans d’autres domaines que l’inclusion des utilisateurs dans les systèmes d’optimisation peut aider à réaliser de plus grandes économies d’énergie.
C’est pourquoi l’objectif de cette thèse est d’étudier les moyens de réduire l’énergie consommée par les centres de calcul des clouds à l’aide d’optimisations considérant les utilisateurs finaux comme un compromis entre énergie et performance. Par conséquent, seule la phase d’utilisation des centres de calcul est prise en compte et l’utilisateur ciblé est une personne utilisant un service cloud de type infrastructure ou plateforme pour répondre à un besoin, tel que l’obtention d’un résultat d’exécution d’une application. Les utilisateurs de la couche application (SaaS) ne sont pas concernés par cette thèse. L’idée générale est de sensibiliser les utilisateurs sur des aspects environnementaux avec des informations liées à l’énergie afin de les inciter à adopter des pratiques plus durables. Nous pensons que l’inclusion des utilisateurs dans les systèmes d’optimisation énergétique peut fournir des possibilités supplémentaires d’économie d’énergie. Cet objectif comprend 2 objectifs principaux qui sont illustrés sur la Figure 2. D’une part, nous fournissons une information liée à l’énergie, représentée par les flèches vertes montantes, afin d’informer les utilisateurs. D’autre part, nous fournissons des moyens d’action, représentés par les flèches vertes descendantes, pour leur
RÉSUMÉ EN FRANÇAIS 15
Figure 2: Dans cette thèse, l’utilisateur du cloud est inclus dans les systèmes d’optimisation én-ergétique en fournissant à la fois une information liée à l’énergie et un moyen d’action. Le but de cette inclusion est d’améliorer les optimisations afin de réduire l’énergie consommée par les centres de calcul.
permettre d’entreprendre des actions écologiques. Les flèches noires représentent le comportement habituel qui existe entre les différentes couches de service du cloud. En guise de première étape vers le changement de comportement des utilisateurs, il est nécessaire de correctement concevoir une métrique qui permettra d’augmenter les connaissances des utilisateurs, ce qui nous donne la première question de recherche.
Question 1 : Quelle métrique devrait être délivrée aux utilisateurs afin d’accroître leur sensibili-sation envers l’environnement ?
Comme expliqué ci-dessus, le cloud est constitué d’un système sophistiqué composé de plusieurs couches de services. Comme le montre la Figure 2, la distance entre les utilisateurs et les pé-riphériques informatiques révèle à quel point il est complexe d’inclure les utilisateurs dans les systèmes d’optimisation énergétique. Un système de sensibilisation à l’environnement fondé sur les informations liées à l’énergie doit être capable de récupérer des données depuis les appareils qui consomment l’énergie. Malheureusement, la distance importante rend difficile le passage de l’information à travers les couches du cloud. La difficulté à récupérer les données requises pour con-cevoir une telle métrique à partir des équipements qui consomment l’énergie jusqu’aux utilisateurs nous donne deux questions de recherche supplémentaires.
Question 2 : Comment les données requises pour concevoir une telle métrique peuvent-elles être obtenues ?
Question 3 : Comment ces données devraient-elles traverser les couches du cloud pour atteindre les utilisateurs finaux ?
Les utilisateurs des clouds informés de leur impact environnemental pourraient avoir tendance à modifier leur comportement. Pour ceux qui sont prêts à entreprendre des actions en faveur
de la préservation de l’environnement, des moyens d’action écologiques spécifiques doivent être conçus. Cependant, il existe différents profils d’utilisateurs, et chacun d’eux peut être prêt à accepter différents types d’implication. Par exemple, certains utilisateurs ont des délais stricts pour obtenir les résultats de leurs applications qui empêchent la dégradation des performances. Bien que les utilisateurs puissent déjà bénéficier de la disponibilité de certains paramètres clouds (e.g. la taille des machines virtuelles), ces paramètres ne sont pas liés à la consommation d’énergie. Ainsi, il est difficile pour les utilisateurs qui ont la volonté de réduire leur empreinte énergétique de comprendre l’impact sur l’énergie que peut avoir leurs choix sur ces paramètres. De plus, de nouveaux paramètres spécialisés (e.g. un levier cloud écologique) devraient être conçus pour proposer de nouvelles manières d’impliquer les utilisateurs. Ceci nous amène à la question de recherche suivante.
Question 4 : Quels types de paramètres écologiques devraient être donnés aux utilisateurs des clouds ?
Grâce à ces paramètres, les utilisateurs seraient en mesure de définir leur compromis en termes d’énergie et performances d’exécution, ce qui peut être considéré comme un nouveau paramètre d’entrée des systèmes d’optimisation énergétique. Par conséquent, ces informations sur les com-promis des utilisateurs doivent être liées aux systèmes d’optimisation sous-jacents afin d’aider ces systèmes à réaliser des économies d’énergie plus importantes. De même que pour le système d’information, il est difficile de fournir un paramètre écologique au système d’optimisation én-ergétique à cause de la distance créée par les couches du cloud. De plus, plusieurs optimisations énergétiques peuvent être trouvées à la fois sur les couches infrastructure et plateforme et la né-gociation entre les couches peut s’avérer nécessaire pour obtenir une solution plus favorable. Les systèmes de cloud manquent actuellement d’une telle interaction entre les utilisateurs et les couches du cloud. Cela nous donne une dernière question de recherche.
Question 5 : A quels systèmes d’optimisation devraient être reliés les leviers verts fournis aux utilisateurs ?
Contributions
L’objectif principal de cette thèse est d’analyser les économies d’énergie possibles dans les clouds en prenant en compte les utilisateurs finaux. Sur la base de cet objectif, nous présentons les contributions suivantes qui sont liées aux étiquettes de la Figure 2 :
1. En partant du bas de la pile du cloud, nous améliorons la couche IaaS pour inclure les util-isateurs dans la sauvegarde d’énergie. Comme expliqué précédemment, les informations liées à l’énergie peuvent motiver les utilisateurs à entreprendre des actions écologiques. Suiv-ant ce raisonnement, l’inclusion de l’utilisateur est double. D’un côté, nous informons les utilisateurs sur la conscience environnementale des fournisseurs IaaS qu’ils peuvent choisir (label A). L’objectif est de les motiver à sélectionner le fournisseur ayant le plus faible im-pact environnemental. Pour atteindre cet objectif, nous avons conçu une métrique appelée GLENDA qui prend en compte le mix électrique, l’efficacité énergétique du centre de calcul et si les ressources informatiques sont correctement utilisées. D’un autre côté, les utilisa-teurs IaaS informés peuvent entreprendre des actions écologiques. En plus de la sélection d’un fournisseur en fonction de son engagement envers l’environnement, les utilisateurs pour-raient avoir accès à un paramètre pour exprimer leur volonté de performance et d’économies d’énergie. C’est pourquoi nous proposons un paramètre IaaS facile à utiliser (label B) qui permet aux utilisateurs de choisir entre trois modes d’exécution différents. Ces modes ont un contrôle sur la taille de leurs machines virtuelles. Par conséquent, le paramètre proposé est lié à l’algorithme de placement qui peut réaliser une plus grande économie d’énergie en fonction du mode d’exécution sélectionné. Une validation en deux étapes, avec un prototype puis une simulation, a montré que l’énergie peut être économisée lorsque le mode le moins énergivore est sélectionné, mais l’économie d’énergie totale dépend toujours de la distribution des profils utilisateurs. Cette contribution, présentée dans le chapitre 3, donne des éléments de réponse aux questions 1, 2, 4 et 5.
RÉSUMÉ EN FRANÇAIS 17
2. La seconde contribution cible la couche PaaS et son impact sur la consommation d’énergie des centres de calcul IaaS sous-jacents. Notre motivation est que les applications PaaS peuvent avoir une grande flexibilité, permettant le décalage dans le temps de l’exécution et le redimen-sionnement des ressources afin de réduire la consommation d’énergie des centres de calcul. Notre proposition est de fournir aux utilisateurs PaaS un choix entre 3 contrats pour exé-cuter leurs applications (label D). Ces contrats résultent d’une négociation entre le fournisseur PaaS et plusieurs fournisseurs IaaS. Un contrat représente une exécution possible sur un four-nisseur IaaS avec plus ou moins de flexibilité sur l’exécution de l’application, comme changer la taille de la ressource (qui est fondée sur la contribution précédente) et retarder l’exécution de l’application. Pour motiver les utilisateurs à aller vers des exécutions économes en énergie, chaque contrat affiche une information (label C) sur l’impact énergétique de son exécution ainsi que sur la conscience environnementale de l’IaaS lié au contrat (i.e. GLENDA). Dans un contexte où les fournisseurs IaaS sont capables de prédire leur charge de travail entrante et où les utilisateurs de PaaS déploient des applications scientifiques, notre solution est capable d’économiser de l’énergie tant que les utilisateurs permettent une exécution flexible de leurs applications. Cette contribution, présentée dans le chapitre 4, donne des éléments de réponse aux questions 1, 2, 3, 4 et 5.
3. Pour terminer, les utilisateurs PaaS ont accès à des paramètres pour configurer l’exécution de leurs applications. Cependant, aucune information n’est donnée pour évaluer un possible impact énergétique variable entre différentes configurations PaaS. Dans ce dernier travail de recherche, nous fournissons une meilleure compréhension du lien entre les configurations PaaS et la consommation d’énergie dynamique des applications (label E). Dans une analyse expéri-mentale, nous mesurons la consommation d’énergie d’une application Web classique 2-tiers en faisant varier les paramètres PaaS existants. Ces paramètres définissent la configuration logicielle ainsi que la configuration des ressources virtuelles. Les résultats des expériences montrent que la variation de la valeur des paramètres est suffisante pour influer sur la quan-tité d’énergie consommée par les applications PaaS. Avec des informations adéquates liées à l’énergie, les utilisateurs PaaS pourraient déjà réduire l’énergie consommée par leurs applica-tions en ajustant correctement les paramètres PaaS existants. Cette contribution, présentée dans le chapitre 5, contribue à apporter une réponse aux questions 2 et 4.
Conclusions
Dans cette thèse, nous proposons aux utilisateurs cloud de participer dans l’optimisation énergé-tique des centres de calcul. Il a été montré aux travers d’évaluations expérimentales et par simu-lation que l’énergie sauvée dépend de l’implication des utilisateurs. Plus ces derniers offrent une flexibilité importante sur l’exécution de leurs applications, plus il est possible de réduire l’énergie consommée par les centres de calcul. Cette flexibilité se présente sous la forme d’adaptation de la quantité de ressources allouées aux applications ainsi que par la tolérance au retardement de leur exécution. Ces compromis utilisateurs ont permis d’améliorer l’utilisation des ressources in-formatiques. Cette optimisation permet de réduire le nombre de machines requises et d’éteindre celles qui ne sont plus utilisées, par la même occasion réduisant la consommation d’énergie des centres de calcul. De plus, nous avons montré que les paramètres cloud déjà existants se révèlent suffisant pour impacter la consommation d’énergie des applications cloud. Cependant, de futurs travaux de recherche sont nécessaires pour permettre aux utilisateurs de la couche application (SaaS) de participer à l’amélioration des optimisations énergétiques. D’un côté, il faudra délivrer une information sur l’énergie consommée quand on utilise un service SaaS. D’un autre côté, il sera important d’apporter aux utilisateurs sensibilisés par cette information des moyens pour participer à la sauvegarde de l’énergie.
Chapter 1
Introduction
Contents
1.1 General Context . . . 19 1.2 Research Problem and Objectives . . . 20 1.3 Contributions . . . 22 1.4 Organization of the Manuscript . . . 23
1.1
General Context
In December 1997, 1.7% of the world’s population had Internet access. Twenty years later, there are more than 4,157 millions Internet users, representing 54.4% of the total population [2]. No one can deny that human kind is experiencing the digital revolution. As we enter the digital age, the Information and Communications Technology (ICT) sector has to constantly evolve to pull through this growing worldwide adoption for digital technologies. More and more datacenters are built all around the globe in order to overcome the increasing demand for Internet services, especially as we expect even faster adoption of ICT in the future [3].
Is such an evolution environmentally sustainable?
Unfortunately, datacenters are known to impact the environment in many different aspects: construction of the building, recycling of electronics, energy consumed during cycle of usage, etc. In 2011, the ICT sector represented 1.9% of the global emission of GreenHouse Gas (GHG), a level of emissions similar to the global aviation sector [3, 4]. The following year, it has been shown that the total electricity demand of this sector compared with the electricity demand of countries made the ICT sector the 3rd world wide electricity consumer [1]. Unfortunately, there is no figure more
recent about this than Figure 1.1.
The reduction of the energy footprint of datacenters has become an important research topic and has gained a significant interest from scientists over past years. Many research efforts have already succeeded at reducing the energy consumption of datacenters by increasing their energy efficiency. However, because of the Jevons paradox [5, 6, 7], only increasing energy efficiency can increase usage because of cheaper access to the resources. Hereafter an example taken from [8] that illustrates this paradox: a person driving a fuel economic car might partly compensate the savings of the technology by simply driving more, because it is now cheaper. Reducing datacenter energy consumption reduces their monetary cost. Thus, users have a cheaper access to ICT services and it might result in an increased utilization demand. This counterproductive effect can end up in an overall increase of the energy consumption where we would expect the opposite [9]. Research propositions only taking efficiency into consideration to reduce the energy consumption of datacenters might not be free of future side effects. Users’ behavior should also be taken into consideration.
In the general case, it has been shown that increasing users’ knowledge has the potential to change consumer behavior [10]. On the topic of energy, Fischer [11] presents a body of evidences
Figure 1.1: Compared with the electricity consumption of countries (in billion kWh), the ICT sector was the 3rdworld wide electricity consumer in 2012 [1].
that reveals the usefulness of feedback for promoting electricity conservation. Other studies showed that tips and rewards [12], easy access to energy information with a mobile application [8] and cost-effective energy monitoring along with incentive systems [13] have the ability to change behaviors and result in energy savings. However, a well-designed metric is a key condition for consumers to understand their consumption [14].
1.2
Research Problem and Objectives
The environmental impact of datacenters is an extremely wide research problem. Their impact is influenced by many criteria such as the construction of the building, the production and recycling of IT devices and the overall datacenter efficiency which can be severely poor because of bygone cooling technologies. Considering their enormous energy consumption, their mere geographic location is sufficient to significantly influence their environmental impact (e.g. availability of renewable energy sources). And the list goes on. In this thesis, we restricted this wide problem to only target the electrical energy consumed by cloud computing datacenters during their use phase.
Cloud computing is a system model that offers convenient services to their users. These ser-vices, which are based on virtualization technologies, are decomposed in three different layers: Infrastructure-as-a-Service (IaaS), Platform-as-a-Service (PaaS) and Software-as-a-Service (SaaS). In IaaS clouds, users request access to one or several Virtual Machines (VMs) of different sizes that execute on Physical Machines (PMs)1. At the PaaS level, developers deploy their applications on a
platform that handles and maintains their proper execution. Finally, the SaaS layer gives to users an access to ready to be used cloud applications.
Up to now, many research studies have been conducted to provide solutions to reduce the energy consumed by cloud computing systems. These solutions mainly focus on increasing the energy efficiency of datacenters. However, these energy optimizations are executed by providers without considering end-users. As explained before, it has been shown in other topics that including end-users into optimization systems can help to achieve higher energy savings.
This is why the objective of this thesis is to investigate means to reduce the energy consumed by cloud datacenters through optimizations considering end-users as an energy and performance trade-off. Therefore, only the use phase of datacenters is considered and the targeted end-user is a person using either an IaaS or a PaaS cloud service to meet a need, such as getting the results of an application execution. SaaS users are not in the scope of this thesis. The general idea is to raise users environmental awareness with energy-related information in order to incite them to adopt more sustainable practices. We believe that including users in the loop of energy optimization systems can provide additional energy saving possibilities. This objective includes 2 main goals that are depicted in Figure 1.2. On one hand we provide an energy-related information, represented
1.2. RESEARCH PROBLEM AND OBJECTIVES 21
Figure 1.2: In this thesis, the cloud user is included in energy optimization systems by providing both energy-related information and means of action. The goal of this inclusion is to enhance optimizations in order to reduce the energy consumed by datacenters.
by the rising green arrows, in order to inform cloud users. On the other hand we deliver means of action, represented by the descending green arrows, to allow them to undertake green actions. Black arrows represent the usual cloud behavior across the service layers. Thus, as a first step towards users behavioral change, a well-designed metric to increase knowledge is required, which gives the first research question.
Question 1: What metric should be given to users to increase their environmental awareness? As explained above, Cloud computing has a sophisticated system model composed of several service layers. As shown in Figure 1.2, the distance between cloud users and IT devices reveals how sophisticated it is to include users in energy optimization systems. A system to raise environmen-tal awareness based on energy-related information needs to retrieve information from the energy consuming devices. The important distance makes it difficult for the information to go through the cloud layers. The difficulty to retrieve the required data to design such a metric from the energy consuming equipment to cloud users gives these two additional research questions.
Question 2: How can the data required to design such a metric be obtained?
Question 3: How should this data transit through the cloud layers to reach end-users?
Cloud users informed on their environmental impact might tend to change their behavior. For those who are ready to undertake actions in favor of the preservation of the environment, specific ecological means of action have to be designed. However, it exists many different profiles of users, and each of them might be ready to accept different kinds of implication. For instance, some users have strict deadlines to obtain results from their applications that prevent from degrading performance. Although users can already benefit from the availability of cloud parameters (e.g. size of VMs), they are not related to energy consumption. Thus, it is difficult for cloud users with the will to reduce their energy consumption to understand the impact on the energy that
their parameters choice can have. Additionally, new specialized parameters (e.g. a green cloud lever) should be designed to propose new kinds of user implication. It gives the following research question.
Question 4: What kind of green parameters should be given to cloud users?
Through these parameters, cloud users would be able to define their energy and performance ex-ecution trade-off, which can be seen as a new input parameter in the energy optimization equation. Therefore, this user information needs to be linked with the underlying optimization systems in order to help these systems to achieve higher energy savings. Similarly to the information system, it is difficult to provide a green parameter a few layers away from where the optimization is applied. Moreover, several energy optimizations can be found at both IaaS and PaaS layers and negotiation between layers might be required to get a more favorable solution. Cloud systems currently lack of such an interaction between users and cloud layers. It gives the following last research question. Question 5: Which optimization systems should be linked to the green parameters delivered to
cloud users?
1.3
Contributions
The main goal of this thesis is to analyze the possible energy savings in cloud computing systems by taking end-users into consideration. Based on this objective, we present the following contributions that are linked with the labels of Figure 1.2:
1. Starting from the bottom of the cloud stack, we enhance the IaaS layer to include users in the energy saving quest. As explained before, energy-related information can motivate users to undertake green actions. Following this reasoning, the user inclusion is two-fold. On one side, we inform IaaS users on the environmental awareness of IaaS providers they can choose (label A). The goal is to motivate them to select the provider with the lowest environmental impact. To reach this goal, we design a metric called GLENDA that takes into consideration the electricity mix, the energy efficiency of the datacenter and if the computing resources are correctly used. On the other side, informed IaaS users can undertake green actions. In addition to the selection of an environmentally aware provider, users could be given a parameter to express their willingness towards performance and energy savings. This is why we propose an easy-to-use IaaS parameter (label B) that allows users to choose between three different execution modes. These modes have a control over the size of their VMs. Therefore, the proposed parameter is linked with the placement algorithm that can achieve higher energy saving depending on the selected execution mode. A two-step validation, with a prototype and then by simulation, showed that energy can be saved when the less energy consuming mode is selected. However, the total energy saving still depends on the distribution of user profiles. This contribution, presented in Chapter 3, provides some answers to Questions 1, 2, 4 and 5.
2. Our second contribution targets the PaaS layer and its impact on the energy consumption of the underlying IaaS datacenters. Our motivation is that PaaS applications can have high flexibility, allowing execution shifting and resources resizing in order to lower the energy consumption of datacenters. Our proposition is to deliver to PaaS users a choice between 3 contracts to execute their applications (label D). These contracts result from a negotiation between the PaaS provider and several IaaS providers. A contract represents a possible execution on an IaaS provider with more or less flexibility on the application execution such as changing the resource size (which is based on the previous contribution) and delaying the application execution. As a motivation for users to move towards the most energy efficient execution, each contract displays an information (label C) about the energy impact of its execution as well as the environmental awareness of the IaaS linked with the contract (i.e. GLENDA). In a context where IaaS providers are able to predict their incoming workload and where PaaS users deploy scientific applications, our solution is able to save energy as long as users allow flexible execution of their applications. This contribution, presented in Chapter 4, provides some answers to Questions 1, 2, 3, 4 and 5.
1.4. ORGANIZATION OF THE MANUSCRIPT 23
3. Finally, PaaS users have access to parameters to configure the execution of their applications. However, no information is given to assess a varying energy impact between different PaaS configurations. In this final work, we provide a better understanding of the link between PaaS configurations and applications dynamic energy consumption (label E). In an experi-mental analysis, we measure the energy consumption of a typical two-tier web application while varying the PaaS parameters. These parameters define the software configuration as well as the virtual resource configuration. Results from experiments show that varying pa-rameters’ value is enough to impact the amount of energy consumed by PaaS applications. With the adequate energy-related information, PaaS users could already reduce the energy consumed by their applications with the proper tuning of the existing PaaS parameters. This contribution, presented in Chapter 5, provides some answers to Questions 2 and 4.
1.4
Organization of the Manuscript
The reminder of this thesis is structured as follows. In Chapter 2, we present the state of the art on cloud computing and the existing studies on the reduction of the energy consumed by datacenters. A focus is made on consolidation algorithms as it is the optimization solution we decided to use in this thesis. Chapter 3 presents a two-step users inclusion at the IaaS level that allows cloud users to reduce their environmental footprint. The first step uses an eco-friendly metric to motivate users to select the greenest provider. The second step enables users to get involved in the placement of their virtual resources in order to reduce energy consumption. In Chapter 4, the same objective of reducing IaaS datacenters energy consumption is tackled but the contribution targets PaaS users. This work benefits from the propositions of the previous chapter along with an additional flexibility lever that, all together, allows PaaS users to favor the reduction of the energy footprint of cloud datacenters. Finally, Chapter 5 focuses on the energy consumed by the application that executes on virtual resources and how the application configuration affects its energy consumption. More specifically, this work provides a better understanding of the impact of on-hand PaaS parameters on the energy consumed by PaaS applications. Chapter 6 summarizes the contributions of this thesis and presents our propositions of future research directions.
Chapter 2
State of the Art on Energy in Cloud
Computing Systems
Contents
2.1 Introduction on Cloud Computing . . . 26 2.1.1 From Virtualization to Cloud Computing . . . 26 2.1.2 Live Migration Technique . . . 27 2.1.3 Service Models Decomposed in Three Layers . . . 28 2.1.4 Classification of Cloud Computing Applications . . . 29 2.2 Energy Footprint of Cloud Computing Systems . . . 31 2.2.1 Difference between Power and Energy . . . 32 2.2.2 Datacenters Energy Model . . . 32 2.2.3 Energy Consumption of Network Devices . . . 33 2.2.4 Energy Consumption of Physical Machines . . . 34 2.2.5 Modeling Energy of Cloud User Tasks . . . 34 2.2.6 Metrics on Energy and Performance . . . 35 2.3 Physical Machine Techniques to Save Energy . . . 37 2.3.1 Shutting Down Techniques . . . 38 2.3.2 Processor-level Energy Saving Techniques . . . 38 2.3.3 Energy-proportionality . . . 39 2.3.4 Other Physical Machine Energy Saving Techniques . . . 40 2.4 Energy Optimizations at Datacenter Level . . . 40 2.4.1 Efficient Location Selection for Virtual Machine Initial Placement . . . 41 2.4.2 More Efficiency with Resource Consolidation . . . 43 2.4.3 Adapting Resources to Load with Elasticity . . . 44 2.4.4 Shifting Virtual Machines in Time to Save Energy . . . 44 2.5 Energy Optimizations Involving Cloud Users . . . 45 2.5.1 Eco-friendly Motivation Systems . . . 45 2.5.2 Cloud Business Model . . . 46 2.5.3 SLA: Beyond Performance, Toward Energy . . . 47 2.5.4 Energy-related User Parameters . . . 48 2.6 Conclusions . . . 49 To provide the necessary background of our work, this chapter presents the state of the art in related fields including user cloud applications, datacenter energy consumption, energy optimiza-tion at hardware and virtual levels, and the place of cloud users in energy preservaoptimiza-tion. First, we introduce the concept of cloud computing and the virtualization technology. Then, details are given on the composition of cloud systems and what types of user applications are usually submitted for execution. Physical Machines (PMs) used to execute these applications are grouped in datacenters
consuming large amounts of energy. We describe how datacenter energy consumption is distributed at the building level, at the IT room level, and at the PM level. Next, we put forward efforts that have been made at the PM level in optimizing their use of energy. Embedded hardware features of PMs and software techniques enable optimizations that can reduce their energy consumption. Vir-tualization allows additional energy savings by efficiently managing the virtual resources. Energy optimization techniques, such as VM placement and consolidation, VM elasticity, and temporal placement, are presented. Finally, we discuss the place of users in cloud computing systems. More specifically, related work on their inclusion in the preservation of datacenters energy is presented.
2.1
Introduction on Cloud Computing
Among others, cloud computing is a solution leveraging virtualization to manage datacenters com-puting resources. In this section, we briefly present the history behind virtualization and cloud computing concepts. Then, a detailed presentation of the cloud computing model is given. The de-composition in three service layers is described and a detailed presentation is given on applications that execute on these cloud layers.
2.1.1
From Virtualization to Cloud Computing
Virtualizing physical resources to benefit from resource sharing and increased utilization is a well-established concept that goes back to the 70s [15]. However, it was not until the early 2000s that the virtualization technology became widespread as x86 processors started to support hard-ware instructions dedicated to virtualization [16]. Both Intel and AMD processors have their own embedded virtualization extension: Intel VT-x and AMD-V.
The principle behind virtualization is structured as follows. As shown in Figure 2.1, above the Operating System (OS) running on a given PM executes a software layer known as the Virtual Machine Monitor (VMM) or hypervisor. The goal of the hypervisor is to provide guest OSs. From the PM’s OS point of view, these guests are seen as processes. From users point of view, they are seen like genuine OSs with computing resources. These guest OSs are the so-called Virtual Machines (VMs). The hypervisor arbitrates accesses to physical resources (e.g. memory) so that these resources can be shared among multiple OSs that are “guests” of the VMM. The key aspect of this layer is that it enables a single PM to host multiple VMs in parallel, thus favoring increased resources utilization. Xen [17] and KVM [18] are two widely used hypervisors. Whereas both of them show comparable hardware performance, Xen has better scalability properties while KVM is shown to be extremely lightweight [19]. Figure 2.1 depicts the architecture of a virtualized PM based on the KVM virtualization technology. To summarize, a virtualized PM (sometimes referred as a compute node) delivers virtual resources to users through VM instances. To manage a large pool of virtual resources on top of multiple PMs, an additional layer is required. This layer is the cloud management layer, which is on top of all PMs. Its role is to create the link between users and the virtual resources. Details on this layer are given in Section 2.1.3.
In recent years, virtualization, networking, storage and distributed systems management expe-rienced rapid developments. While cloud computing is the natural evolution of traditional data-centers, it is distinguished by exposing a pool of computing and storage resources accessible via standard protocols (i.e. Internet) and following a pricing model where clients are charged based on their resources utilization [20]. Virtual resources are provided by infrastructures deployed in extremely large datacenters. For instance, Amazon’s datacenters are estimated to contain between 50,000 to 80,000 PMs per site [21]. These extremely large datacenters give users the illusion of hav-ing access to an infinite pool of resources. Cloud computhav-ing is a convenient solution for enterprises for several reasons. It reduces time to market and monetary cost as enterprises can outsource their services instead of having to maintain their own infrastructure, especially since access to resources are usually charged in a pay-as-you-go manner. Minimal or no IT skills are required since the tech-nical complexity is hidden from users. Back-ups of users instances can be easily executed which provides quick recovery and fault-tolerance to their users. Security is also an important aspect due to sensitive and private data that might be processed in the virtualized resources. Replicas and back-ups minimize the risk of data loss, while security certificates are here to guarantee that users
2.1. INTRODUCTION ON CLOUD COMPUTING 27
Figure 2.1: Virtualized resources are managed by an hypervisor that runs on top of the operating system of a physical machine. Actions taken by the hypervisor, such as the creation of a guest OS, are based on instructions sent by the upper cloud management layer according to user requests.
data should not be leaked.
The quality of a given cloud service (so-called Quality of Service (QoS)) can be assessed based on the following aspects: elasticity, availability, reliability and agility [22]. Elasticity refers to the ability of a system to provision an amount of resources that matches the consumer’s need. This provisioning can be achieved horizontally by changing the amount of VMs, or vertically by changing the size of the VMs. Adding and removing resources are called scaling up and scaling down, respectively. A more complete discussion on elasticity is given later in the state of the art. Availability defines the QoS performances, such as response time and throughput, that must be guaranteed. The reliability is a particular QoS requirement that ensures business continuity, disaster recovery, and prevention of lost. Finally, agility is a basic requirement for cloud computing that refers to the capability to react rapidly to changes in resource demand and environmental conditions.
2.1.2
Live Migration Technique
In cloud computing, live migration is a feature that is largely used for resource management and to adapt applications performance. Later in the state of the art, studies on energy-efficient management based on live migration are presented. Indeed, this specific cloud feature offers a way to consolidate VMs and favors the use of fewer PMs. Mixed with an adequate power management strategy, it can significantly reduce datacenters energy footprint. This section provides details on the live migration feature.
Live migration of VMs consists in moving a VM from its current PM to another one by copying all of its memory pages from source to destination over the network [23]. This cloud feature provides a way to adjust the VM layout and exists for several reasons, such as load balancing (e.g. reduce the load on a too highly used PM) and maintenance (e.g. freeing a PM from its VMs to allow administrators to manipulate the hardware). Live migration techniques have two main goals. First, they try to minimize as much as possible the interruption of the application running inside the VM. Here, we distinguish the downtime that corresponds to the time when the service is not running, with the total migration time that starts when migration is initiated and finishes when the original VM can be discarded. Second, the migration should happen without degradation of service on the other VMs. Indeed, migrating a VM uses resources that can interfere with active traffic and processing. Migration of VMs can be executed in different manners. Pure stop-and-copy involves halting the VM, copying all pages to destination, and then resuming the VM on destination PM. Despite its simplicity, this solution is impractical with VM running a live service because of the consequent downtime. Pure demand-migration starts by executing a short stop-and-copy to transfer essential kernel data structures to destination. Destination VM is then
started, and other pages are transferred on first use. Although downtime is much shorter with this approach, it produces a much longer total migration time and degrades VM performance after migration. As its name suggests, pre-copy pre-copies the memory pages in rounds while the VM is still running. However, every VM has a set of dirty pages that it updates very frequently (based on VM workload), so-called Writable Working Set [23]. When it remains only dirty pages to transfer, the VM is halted, remaining pages are transferred and execution restarts on the destination PM. This solution has the advantage of having short interruption of service. For instance, the migration of a VM running the Quake 3 game server, using the pre-copy technology, induces only 60 ms of downtime which is not perceptible to the players [23]. In the case of intense workloads writing on memory faster than can be transferred across the network (worse case scenario), it results in a downtime of 3.5 seconds [23]. VM migration costs can be estimated using a performance model [24]. In their proposition, the authors of [24] show that parameters such as VM memory size, network speed and memory dirtying rate are the major factors impacting migration performance.
2.1.3
Service Models Decomposed in Three Layers
The classic cloud computing model is composed of three main service layers [25]: IaaS, PaaS and SaaS. This stack of cloud services is represented in Figure 2.2 alongside with examples of cloud solutions from Microsoft and Google, two major cloud players. The IaaS layer is the closest to hardware devices and is responsible in delivering VMs to its users. On top of it, the PaaS allows its users to program their cloud applications and is in charge of deploying and maintaining their execution. Finally, the SaaS layer provides an access to ready-to-use applications run by the SaaS operator. The remainder of this section details each of these three layers.
Figure 2.2: Cloud computing is composed of three service layers, each responding to a different objective. Example of Microsoft and Google solutions are given next to each layer.
Infrastructure-as-a-Service
This first service model is the cloud management layer, which is responsible for managing virtualized resources. It allows IaaS users to request a specific amount of virtual resources. Their virtual resources are packed into VMs that are accessible through a telecommunication network. Thus, each VM has a size, which is called flavor, and it exists a very large variety of flavors that differs between providers. Some of them provide specialized selections of flavor, such as compute intensive or storage intensive. As an example, Table 2.1 presents the latest generation of general purpose Amazon EC2 M5 instances [26].
As for the business model, users usually pay in a pay-as-you-go manner to access the requested resources, which means that they pay their access until they release the resources. In the case of Amazon EC2, users pay in an hourly basis (see last column in Table 2.1).
Examples of IaaS solutions are Amazon EC2 [27] from Amazon Web Service, Compute En-gine [28] from Google Cloud Platform and Virtual Machines [29] from Microsoft Azure. It also exists several open-source solutions, such as OpenStack, Eucalyptus and OpenNebula [30], that can be deployed on top of a cluster of PMs.
2.1. INTRODUCTION ON CLOUD COMPUTING 29
Table 2.1: Definition of the Amazon EC2 M5 instances with their EU Paris price. Flavor name vCPU Memory (GB) Bandwidth (Mbps) EU Paris price
m5.large 2 8 Up to 2,120 $0.112 per Hour
m5.xlarge 4 16 Up to 2,120 $0.224 per Hour
m5.2xlarge 8 32 Up to 2,120 $0.448 per Hour
m5.4xlarge 16 64 2,120 $0.896 per Hour
m5.12xlarge 48 192 5,000 $2.688 per Hour
m5.24xlarge 96 384 10,000 $5.376 per Hour
Platform-as-a-Service
Despite the fact that the exact definition of PaaS is still an open debate, Giessmann and Stanoevska give the following definition [31]:
“Platform as a Service refers to an execution environment, wherein external developers deploy and run their complementary components.”.
This type of cloud is dedicated to application developers because it provides online resources to build and run their applications without the need to download or install anything [32]. Although this layer can run on top of dedicated machines, in a full cloud PaaS, users applications run in VMs delivered by an IaaS provider that are then managed by the PaaS provider. This management includes the maintenance of the operating system and installed software stack. The PaaS also configures the amount of virtual resources dedicated to the execution of an application.
When the PaaS application is ready to execute, the PaaS provider delivers an environment for running the application. Concretely, an environment corresponds to a set of VMs where a software stack is already installed. This stack depends on the details of the software project given by the developer, such as the programming language, the version of the language interpreter, the database management system and the packages requirement of her application.
Each PaaS provider has its own way to implement the software management system. Some providers prefer to have a single large VM image with the whole software stack installed on it to ease its maintenance. In the open-source solution ConPaaS [33], the provider manages many VM images, each one for a specific type of environment. In this type of architecture, a VM image is dedicated to handle the execution of PHP applications for instance, while another VM image is only used to execute Java Servlet applications. A more detailed presentation of PaaS cloud providers can be found in [34].
Google Cloud Platform proposes its App Engine solution [35] and it exists several other PaaS providers, such as Clever Cloud [36], Heroku [37] and Engine Yard [38].
Software-as-a-Service
The SaaS cloud layer allows users to directly interact with running applications [20]. Services provided by this layer are usually accessed by end-users through web portals. Thus, a user only needs to have a network connection with the application and does not require to install anything. Such applications are either managed by an underlying PaaS provider or running in VM instances delivered by an IaaS provider.
It exists thousands of SaaS solutions. To name a few, Google provides a panel of cloud applica-tions for writing and editing numerical documents, such as Google Docs [39] where users have access to an on-line text editor without knowing the platform or the infrastructure used in background. Microsoft provides a very similar collection of SaaSs called Office 365 [40].
2.1.4
Classification of Cloud Computing Applications
Regardless of the deployment method used by a cloud user (directly in VMs delivered by an IaaS provider or by using the deployment system given by an PaaS provider), different types of applications are requested to be executed on virtualized resources. Each type of application has its own resource usage pattern. Hereafter, we present two common types of cloud applications that present different resource usage patterns and are used in this thesis.


![Figure 2.4: Montage [48] workflow (left side) and Blast [49] workflow (right side) are two examples of scientific workflows, respectively network/data intensive and CPU/memory intensive.](https://thumb-eu.123doks.com/thumbv2/123doknet/11534846.295576/36.893.282.658.224.380/montage-workflow-workflow-scientific-workflows-respectively-intensive-intensive.webp)