HAL Id: tel-00932796
https://tel.archives-ouvertes.fr/tel-00932796
Submitted on 17 Jan 2014
HAL is a multi-disciplinary open access archive for the deposit and dissemination of sci-entific research documents, whether they are pub-lished or not. The documents may come from teaching and research institutions in France or abroad, or from public or private research centers.
L’archive ouverte pluridisciplinaire HAL, est destinée au dépôt et à la diffusion de documents scientifiques de niveau recherche, publiés ou non, émanant des établissements d’enseignement et de recherche français ou étrangers, des laboratoires publics ou privés.
Constrained Devices
Nikolaos Papoulias
To cite this version:
Nikolaos Papoulias. Remote Debugging and Reflection in Resource Constrained Devices. Program-ming Languages [cs.PL]. Université des Sciences et Technologie de Lille - Lille I, 2013. English. �tel-00932796�
N° d’ordre :
41342THESE
présentée en vue
d’obtenir le grade de
DOCTEUR
en
Spécialité : informatique
par
Nikolaos Papoulias
DOCTORAT DELIVRE CONJOINTEMENT PAR MINES DOUAI ET L’UNIVERSITE DE LILLE 1
Titre de la thèse :
Remote Debugging and Reflection in Resource Constrained Devices
Soutenue le 19/12/2013 à 10h devant le jury d’examen :
Président Roel WUYTS (Professeur – Université de Leuven)
Directeur de thèse Stéphane DUCASSE (Directeur de recherche – INRIA Lille)
Rapporteur Marianne HUCHARD (Professeur – Université Montpellier 2)
Rapporteur Alain PLANTEC (Maître-Conf-HDR – Université de Bretagne Occ.)
Examinateur Serge STINCKWICH (Maître-Conf – Université de Caen)
co-Encadrant Noury BOURAQADI (Maître-Assistant – Mines de Douai)
co-Encadrant Marcus DENKER (Chargé de recherche – INRIA Lille)
co-Encadrant Luc FABRESSE (Maître-Assistant – Mines de Douai)
Laboratoire(s) d’accueil : Dépt. IA, Mines Douai + RMoD INRIA Lille Nord de France Ecole Doctorale SPI 072 (Lille I, Lille III, Artois, ULCO, UVHC, Centrale Lille)
iii
The contents of this dissertation are protected under Creative Commons Attribution-ShareAlike 3.0 Unported license.
You are free:
to Share — to copy, distribute and transmit the work to Remix — to adapt the work
Under the following conditions:
Attribution. You must attribute the work in the manner specified by the author or licensor (but not in any way that suggests that they endorse you or your use of the work). Share Alike. If you alter, transform, or build upon this work, you may distribute the
re-sulting work only under the same, similar or a compatible license.
• For any reuse or distribution, you must make clear to others the license terms of this work. The best way to do this is with a link to this web page: creativecommons.org/ licenses/by-sa/3.0/
• Any of the above conditions can be waived if you get permission from the copyright holder.
• Nothing in this license impairs or restricts the author’s moral rights.
Your fair dealing and other rights are in no way affected by the above. This is a human-readable summary of the Legal Code (the full license):
creativecommons.org/licenses/by-sa/3.0/legalcode
Contents
Acknowledgments ix
Abstract xiii
Résumé xv
1 Introduction 17
1.1 Context: The programming cycle for resource constraint devices . . . 18
1.2 Problem: Debugging a resource constraint device . . . 18
1.3 Shortcomings of Existing Approaches . . . 18
1.4 Our Solution in a Nutshell . . . 19
1.5 Contributions . . . 20
1.6 Structure of the Dissertation . . . 20
2 Remote Debugging 23 2.1 Debugging . . . 24
2.2 Remote Debugging . . . 26
2.2.1 Remote Debugging Through Logging . . . 27
2.2.2 Using a Remote Debugger . . . 28
2.3 Requirements for Remote Debugging Solutions . . . 30
2.3.1 Interactiveness . . . 30
2.3.2 Instrumentation . . . 31
2.3.3 Distribution . . . 32
2.3.4 Security . . . 33
2.4 Evaluation of Existing Solutions . . . 33
2.4.1 JPDA . . . 33
2.4.2 JRebel and DCE . . . 34
2.4.3 .NET . . . 34 2.4.4 GDB . . . 34 2.4.5 Smalltalk . . . 35 2.4.6 Bifrost . . . 35 2.4.7 Comparison . . . 35 2.5 Summary . . . 38
3 Reflection for Remote Debugging: Architectural Alternatives 39 3.1 Reflection . . . 40
3.2 Reflection for Remote Debugging . . . 43
3.3 Architectural Alternatives for Remote Reflection . . . 44
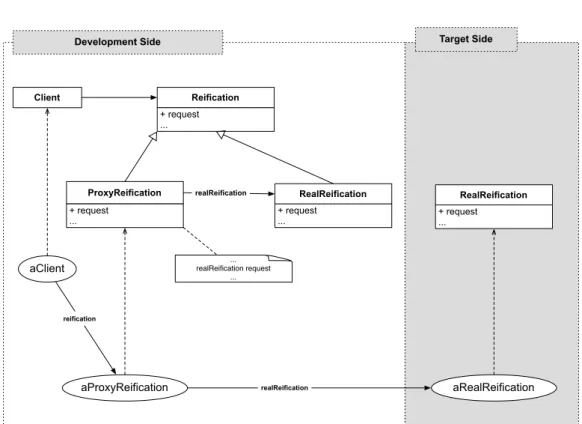
3.3.1 Remote Proxy Overview . . . 44
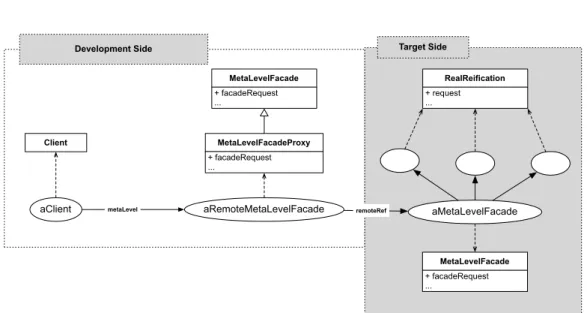
3.3.3 Remote Facade Overview . . . 49
3.3.4 Remote Facade Design Challenges . . . 49
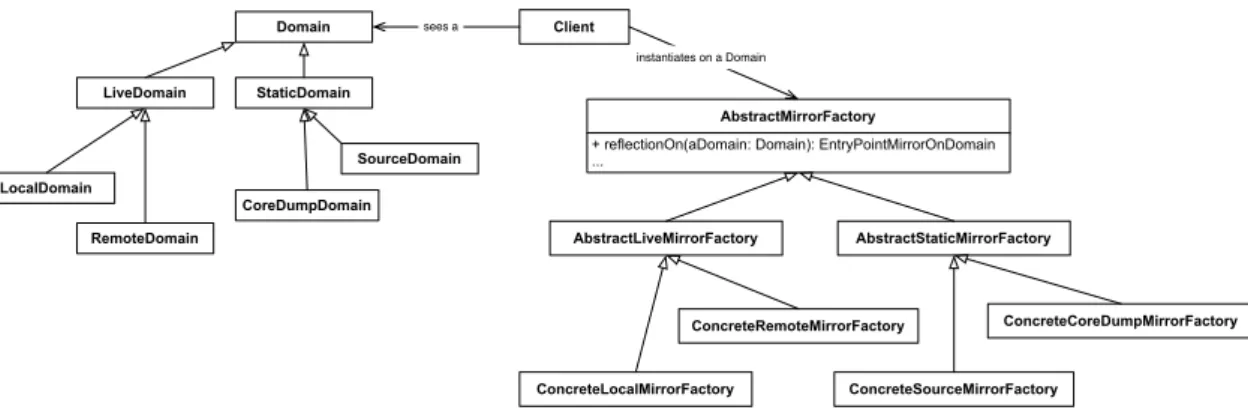
3.3.5 Mirrors Overview . . . 50
3.3.6 Design patterns behind Mirrors . . . 52
3.3.7 Mirrors Design Challenges . . . 54
3.4 Summary . . . 55
4 MetaTalk: A Mirror extension supporting Structural Decomposition 57 4.1 Cohesive Language-Kernels . . . 58
4.2 Mirrors as meta-objects . . . 59
4.3 Pluggable and state-full meta-objects . . . 60
4.4 Extending mirrors to support Structural Decomposition . . . 60
4.5 Reference Model for the Structural Decomposition of Reflection . . . 62
4.6 Implementation and Validation . . . 64
4.6.1 Implementation . . . 64
4.6.2 Example: Structural decomposition of core meta-information . . . 64
4.6.3 Validation . . . 65
4.7 Summary . . . 68
5 Mercury: A Model for Remote Debugging in Reflective Languages 69 5.1 Introduction . . . 70
5.2 The Core Meta-Level . . . 70
5.3 Supporting Interactiveness . . . 72
5.4 Supporting Instrumentation . . . 74
5.5 Supporting Distribution . . . 74
5.6 Supporting Security . . . 76
5.7 Comparison with State Of The Art . . . 77
5.7.1 Interactiveness . . . 77 5.7.2 Instrumentation . . . 78 5.7.3 Distribution . . . 79 5.7.4 Security . . . 79 5.7.5 Comparison overview . . . 80 5.8 Summary . . . 80
6 Mercury: Implementation Details 81 6.1 Implementation Overview . . . 82
6.2 MetaStackVM: Low-level Instrumentation support . . . 82
6.2.1 Extending the Stack VM . . . 83
6.2.2 Implementation of Meta-Level Control . . . 83
6.3 Seamless: a Framework for Adaptable Distribution . . . 87
6.3.1 Low-level communication infrastructure . . . 88
6.3.2 High-level communication orchestration . . . 89
6.4 Mercury-Core: Meta-level and Run-Time support . . . 90
Contents vii
6.6 Discussion: Implementation trade-offs . . . 94
6.6.1 Supporting Interactiveness . . . 94
6.6.2 Supporting Instrumentation . . . 95
6.7 Summary . . . 95
7 Mercury At Work 97 7.1 Mercury Examples . . . 98
7.1.1 Inspecting remote environments and accessing objects . . . 98
7.1.2 Handling remote exceptions . . . 98
7.1.3 Changing variables and controlling execution flow . . . 99
7.1.4 Incrementally changing the target’s code and state . . . 99
7.1.5 Introducing breakpoints on execution events . . . 100
7.1.6 Distribution . . . 100
7.1.7 Security . . . 100
7.2 Mercury Validation: Experimental Setting . . . 101
7.2.1 Debugging Targets Set-Up . . . 101
7.2.2 Remote Applications . . . 102
7.2.3 Debugging Front-End Walkthrough . . . 106
7.3 Case Study I: Remote Agile Debugging . . . 108
7.3.1 Introduction . . . 108
7.3.2 The Suffix Defect in a Remote Setting . . . 108
7.3.3 Remote Agile Debugging through Interactiveness . . . 111
7.3.4 Results . . . 114
7.4 Case Study II: Remote Object Instrumentation . . . 115
7.4.1 Introduction . . . 115
7.4.2 The Hidden Path Hypothesis . . . 116
7.4.3 Combining Object and Stack Debugging in a Remote Setting . . . . 117
7.4.4 Results . . . 120
7.5 Summary . . . 120
8 Conclusion 123 8.1 Summary and Contributions . . . 124
8.2 Future Work . . . 126
8.2.1 Language and Virtual-Machine Debugging in the Same Model . . . 126
8.2.2 Automated Debugging Techniques . . . 127
List of Figures 129
List of Tables 131
Acknowledgments
I would like to thank my supervisors for their support throughout the duration of my thesis. I truly believe that computer scientists should always remain - not only children - but also engineers at heart. This is the main reason why it has always been a pleasure working with you. Thank you Stef, thank you Noury, thank you Luc, thank you Marcus. This three-year adventure would also have not been possible without the kind support of the Nord-Pas-De-Calais region and EMD who funded my research. I am really greatfull Ch’ti, thank you.
Working at EMD and INRIA was such a full-feeling experience partly due to numerous colleagues and friends in both institutions with whom I shared many brainstrorming ses-sions and a lot of caffeine. Most notably: Mariano, Guillermo, Santiago, Ben and Nico but also Martin, Esteban, Igor, Damien, Jean-Baptiste and Camillo. I owe a lot of gratitude to Antoine Chammas who was always eager to help me in my numerous adventures with the french public sector ;) I am also deeply grateful to my family and friends back in Greece, who were constantly supportive and - as always - offered valuable advice in times of stress. Finally I’ d like to thank the miners of Douai for their rich history of struggle against social injustice. The goddess Europa, from whom a well known continent takes its name. But above all Adamantia - lord Byron’s daughter - for her Bernouli sequence algorithm.
Abstract
Building software for devices that cannot locally support development tools can be chal-lenging. These devices have either limited computing power to run an IDE (e.g., smart-phones), lack appropriate input/output interfaces (display, keyboard, mouse) for program-ming (e.g., mobile robots) or are simply unreachable for local development (e.g., cloud-servers). In these situations developers need appropriate infrastructure to remotely develop and debug applications.
Yet remote debugging solutions can prove awkward to use due to their distributed na-ture. Empirical studies show us that on average 10.5 minutes per coding hour (over five 40-hour work weeks per year) are spend for re-deploying applications while fixing bugs or improving functionality [ZeroTurnAround 2011]. Moreover current solutions lack facili-ties that would otherwise be available in a local setting because its difficult to reproduce them remotely (e.g., object-centric debugging [Ressia 2012b]). This fact can impact the amount of experimentation during a remote debugging session - compared to a local set-ting.
In this dissertation in order to overcome these issues we first identify four desirable properties that an ideal solution for remote debugging should exhibit, namely: interactive-ness, instrumentation, distribution and security. Interactiveness is the ability of a remote debugging solution to incrementally update all parts of a remote application without losing the running context (i.e., without stopping the application). Instrumentation is the ability of a debugging solution to alter the semantics of a running process in order to assist de-bugging. Distribution is the ability of a debugging solution to adapt its framework while debugging a remote target. Finally security refers to the availability of prerequisites for authentication and access restriction.
Given these properties we propose Mercury, a remote debugging model and architec-ture for reflective OO languages. Mercury supports interactiveness through a mirror-based remote meta-level that is causally connected to its target, instrumentation through reflec-tive intercession by reifying the underlying execution environment, distribution through an adaptable middleware and security by decomposing and authenticating access to reflec-tive facilities. We validate our proposal through a prototype implementation in the Pharo programming language using a diverse experimental setting of multiple constraint devices. We exemplify remote debugging techniques supported by Mercury’s properties, such as remote agile debuggingand remote object instrumentation and show how these can solve in practice the problems we have identified.
Keywords: Remote Debugging, Reflection, Mirrors, Interactiveness, Instrumenta-tion, DistribuInstrumenta-tion, Security, Agile Development
Résumé
La construction de logiciels pour des appareils qui ne peuvent pas accueillir localement des outils de développement peut être difficile. Ces appareils soit ont une puissance de calcul trop limitée pour exécuter un IDE (par exemple, smartphones), ou manquent d’ interfaces d’entrée / sortie appropriées (écran, clavier , souris) pour la programmation (par exemple, les robots mobiles) ou sont tout simplement inaccessibles pour des développements locaux (par exemple cloud - serveurs). Dans ces situations, les développeurs ont besoin d’une infrastructure appropriée pour développer et déboguer des applications distantes.
Des solutions de débogage à distance sont parfois délicates à utiliser en raison de leur nature distribuée. Les études empiriques nous montrent que, en moyenne 10,5 minutes par heure de codage (plus de cinq semaines de travail de 40 heures par an) sont passées pour le re-déploiement d’applications pour corriger les bugs ou améliorer leur fonctionnalité [Ze-roTurnAround 2011]. En plus, les solutions courantes manquent des aménagements qui seraient autrement disponibles dans un contexte local, car c’est difficile de les reproduire à distance (par exemple débogage objet-centré [Ressia 2012b]). Cet état influe sur la quan-tité d’ expérimentation au cours d’une session de débogage à distance - par rapport à un contexte local.
Dans cette thèse, afin de surmonter ces problèmes, nous identifions d’abord quatre propriétés désirables qu’une solution idéale pour le débogage à distance doit présenter : l’interactivité, l’instrumentation, la distribution et la sécurité. L’interactivité est la capac-ité d’une solution de débogage à distance de mise à jour incrémentale de toutes les par-ties d’une application sans perdre le contexte de d’exécution (sans arrêter l’application). L’instrumentation est l’aptitude d’une solution de modifier la sémantique d’un processus en cours en vue d’aider le débogage. La distribution est la capacité d’une solution de débo-gage à adapter son cadre alors que le débodébo-gage d’une cible à distance. Enfin la sécurité fait référence à la disponibilité de conditions préalables pour l’authentification et la restriction d’accès.
Compte tenu de ces propriétés, nous proposons Mercury, un modèle de débogage à distance et une architecture pour des langues réflexifs à objets. Mercury ouvre (1) l’interactivité grâce à un méta-niveau à distance miroir basé sur un lien de causalité avec sa cible, (2) l’instrumentation à travers une intercession réflective basée sur la réifica-tion de l’environnement d’exécuréifica-tion sous-jacent, (3) la distriburéifica-tion grâce à un middleware adaptable et (4) la sécurité par la décomposition et l’authentification de l’accès aux as-pects réflexifs. Nous validons notre proposition à travers un prototype dans le langage de programmation Pharo à l’aide d’un cadre expérimental diversifié de multiples dispositifs contraints. Nous illustrons des techniques de débogage à distance supportées par les pro-priétés de Mercury, tels que le débogage agile distant et l’instrumentation objet à distance et montrons comment ils peuvent résoudre dans la pratique, les problèmes que nous avons identifiés.
Mots clés: Débogage à distance, Reflexion, Miroirs, Interactivité, Instrumentation, Distribution, Sécurité, Développement Agile
C
HAPTER1
Introduction
Contents
1.1 Context: The programming cycle for resource constraint devices . . . . 18
1.2 Problem: Debugging a resource constraint device . . . 18
1.3 Shortcomings of Existing Approaches . . . 18
1.4 Our Solution in a Nutshell . . . 19
1.5 Contributions . . . 20
1.6 Structure of the Dissertation . . . 20
At a Glance
This chapter introduces the domain and the context of our research. We explain the prob-lems regarding debugging in the context of resource constraint devices. We summarize our approach and our proposed solutions. Finally we present the main contributions of this dissertation and give an overview for its structure.
1.1
Context: The programming cycle for resource constraint
devices
Software is rarely deployed on the same machine it was written or debugged on. This is even mandatory, when building software for devices with resource constraints (e.g. smart-phones) or ones with no input/output interfaces (keyboard, mouse or screen) for develop-ment (e.g. robots). In these cases debugging can be challenging because the target machine can be very different from the development one. Although emulators can help in this case, they are not always available, and are often of limited accuracy, especially when sensory input or actuators are involved.
1.2
Problem: Debugging a resource constraint device
In these situations developers have to remotely debug the target machine. Remote debug-ging tools fall into two main categories: those that incorporate post-mortem analysis (such as logging) and those that externally observe the state and execution flow of a running process through dedicated tools (i.e remote debuggers).
In the case of post-mortem analysis and logging the developer relies on the verbosity of the log. If it is too verbose, the developer might be overwhelmed with the amount of data. Conversely, limited logging may lead to several debugging cycles just for collecting data that will hint on some specific defect. This is due to the static nature of logs. Finally the cycle of re-compilation and re-deployment is time consuming, which makes debugging even more awkward.
When using remote debuggers, having the ability to introspect and modify a live execu-tion (without loosing the context) is a major advantage compared to evaluating static logs. The hypothesis that the developer forms for a possible solution is much more informed in this case. In a lot of cases by just being able to follow execution and introspect or set vari-ables in the target itself, one can be almost certain for the validity of a possible solution. Remote debugging is the most sensible solution in situations where targeted devices (such as smartphones or cloud-based servers) have different hardware or environment settings than development machines.
1.3
Shortcomings of Existing Approaches
Ideally, in OO languages developers should be able to evolve every organizational module and properties of the target application while remote debugging. Moreover they should be able to halt and inspect the running program not only at specific locations in the source code but also on every semantical event that involves objects. The remote debugging solution should depend on middleware that is extendable and adaptable even at runtime, in order to address the different communication needs of different targets and finally it should provide security constraints for both the target and the development machine. Unfortunately there is no existing approach that meets all these criteria in a satisfactory way. Current solutions lack facilities that would otherwise be available in a local setting
1.4. Our Solution in a Nutshell 19
or suffer from re-deployment issues. This is true for debugging solutions of all major OO languages in current use today (Java (JPDA) [Oracle 2013b] [Oracle 2013a], C# (.NET Debugger) [Microsoft 2012b], C++ and Objective-C (through Gdb) [Richard Stall-man 2003]) and also true for dynamic languages with live programming support (such as Smalltalk and its debugging model [LaLonde 1990]), taking also into account bleeding-edge technological achievements [ZeroTurnAround 2012] and very recent research results [Würthinger 2010] [Ressia 2012b].
Given these shortcomings the following research questions concerning remote debug-ging are addressed in this dissertation:
1. What are the properties of an ideal remote debugging solution ?
2. Given these properties which model for remote debugging can exhibit them ? 3. What are the trade-offs between this ideal model and a real world implementation ?
1.4
Our Solution in a Nutshell
Thesis statement. An ideal remote debugging solution should support: interactiveness through a mirror-based remote meta-level that is causally connected to its target, instrumentation through reflective intercession by reifying the underlying execution environment, distribution through an adaptable middleware and security by decomposing and authenticating access to reflective facilities.
We are proposing a mirror-based model and an infrastructure for remote debugging. Our solution exhibits four desirable properties that we have identified as important for remote debugging, namely: interactiveness, instrumentation, distribution and security. In-teractiveness is the ability of a remote debugging solution to incrementally update all parts of a remote application without losing the running context (i.e without stopping the ap-plication). Instrumentation is the ability of a debugging solution to alter the semantics of a running process in order to assist debugging. Distribution is the ability of a debugging solution to adapt its framework while debugging a remote target. Finally security refers to the availability of prerequisites for security mechanisms in a remote debugging solution, such as authentication and access restriction.
We proposed the Mercury model and an architecture for remote debugging in reflec-tive languages. Mercury supports interacreflec-tiveness through a causal connection between the meta-level running on the developer machine, and the application to debug (the base-level) on the target device. The two levels are connected both computationally and structurally. It supports instrumentation through the reification of the underlying execution environment (virtual-machine) inside the run-time environment of the target (as an interpreter). Dis-tribution is supported through an adaptable middleware [David 2002]. Finally it supports security in a remote debugging setting by organizing its reflective facilities into two dif-ferent access groups for - respectively - introspection and intercession. We validated the
applicability of our proposal through a prototype implementation in the Pharo language, and we illustrated it using concrete examples and a case study.
1.5
Contributions
The main contributions of this dissertation are:
1. The identification of four desirable properties than an ideal solution for remote de-bugging should exhibit, namely: interactiveness, instrumentation, distribution and security.
2. The definition of a model for remote debugging (Mercury) that exhibits these desir-able properties.
3. A solution to the problem of Reflective-Data [Maes 1987b] in the context of mirrors [Bracha 2004] and its validation through a language prototype (MetaTalk1).
4. The reification of a previously illustrative notion (that of the reflectogram [Tan-ter 2003]) as an entity that controls the behavior of the meta-level at runtime. 5. A prototype implementation2of our model for remote debugging in the context of
reflective languages.
6. The implementation of an adaptable middleware [David 2002] for supporting distri-bution under different communication contexts (Seamless)3.
7. The implementation of a dedicated VM for Pharo (MetaStackVM)4 that supports advanced intercession facilities.
1.6
Structure of the Dissertation
The dissertation is organized as follows:
Chapter 2 studies and provides definitions for the process of debugging. It identifies major properties and sub-properties of remote debugging solutions, that an ideal solution should exhibit. By using these properties state-of-the-art debugging solutions are evaluated and compared.
Chapter 3 provides definitions for reflection and remote reflection. It studies architectural al-ternatives for remote reflection. Finally it pinpoints open-issues regarding the use of reflection in the context of debugging.
1http://www.squeaksource.com/MetaTalk/
2http://ss3.gemstone.com/ss/Mercury-Prototype.html 3http://ss3.gemstone.com/ss/Seamless.html
1.6. Structure of the Dissertation 21
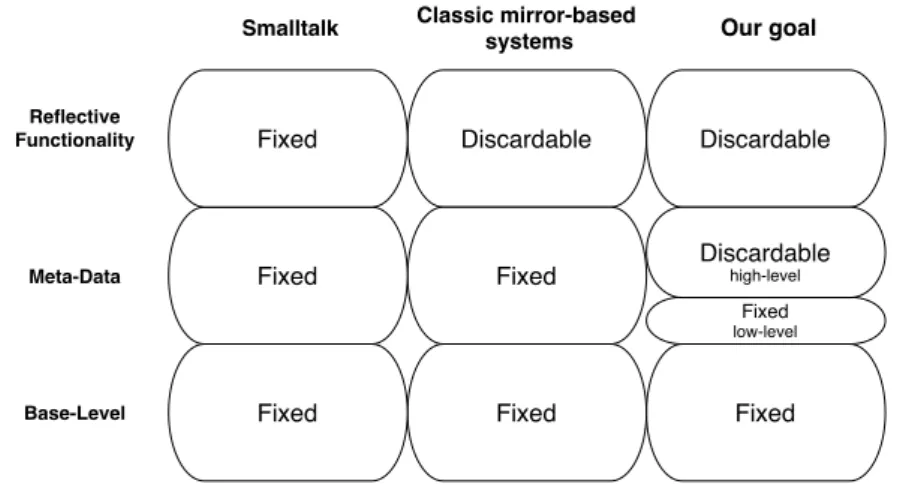
Chapter 4 describes our solution to the problem of Reflective-Data [Maes 1987b] in the context of mirrors [Bracha 2004]. The model for a pluggable and state-full meta-kernel is presented which can be discarded when it is not being used (for example in-between debugging sessions).
Chapter 5 presents our solution for remote debugging. It details one by one the parts of our pro-posal that support the remote debugging properties which were identified in Chapter 2. Finally a comprehensive comparison of our solution with state-of-the-art is given. Chapter 6 presents a prototype implementation of our proposed model for remote debugging and discusses engineering trade-offs that other implementors of our model should take into account.
Chapter 7 shows the intended usage of our model through working examples. Then two case-studies on remote agile debugging and remote object instrumentation using Mercury are presented. The case studies validate Mercury’s properties in an experimental setting of three constraint devices, running real-world applications (smart-phone, tablet and remote server).
Chapter 8 concludes the dissertation by summarizing our work and presents future perspec-tives.
C
HAPTER2
Remote Debugging
Contents
2.1 Debugging . . . 24 2.2 Remote Debugging . . . 26 2.3 Requirements for Remote Debugging Solutions . . . 30 2.4 Evaluation of Existing Solutions . . . 33 2.5 Summary . . . 38
At a Glance
In this chapter we study and provide definitions for the process of debugging. We then use these definitions to study different remote debugging approaches. Through this study we define four major properties of remote debugging so-lutions, namely: interactiveness, instrumentation, distribution and security. Finally, by using these properties we evaluate and compare existing solutions.
2.1
Debugging
While the term "debugging" itself is usually attributed to Grace Hopper creator of Cobol [Zeller 2005], debugging as a general diagnostic tool is applicable not only to programming languages but to any engineering process. The significance of debugging for software en-gineering in particular can be seen in scientific publications concerning effort estimation and project management. These studies support that on average, testing and debugging cover roughly 50 % percent of the development time [Beizer 1990] and that validation ac-tivities – such as debugging and verification – cover 50 % to 75 % of the total development cost [Brent Hailpern 2002].
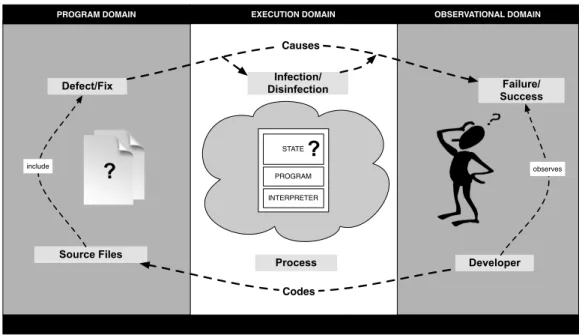
In Figure 2.1 we present the three domains and the entities involved in software de-bugging. We will describe these domains and entities to give a working definition of debugging. Our definition depends loosely on those given by Zeller [Zeller 2005] and Sommerville [Sommerville 2001] respectively.
Source Files
Process Developer
Defect/Fix DisinfectionInfection/ Failure/
Success Causes Codes STATE PROGRAM INTERPRETER
?
PROGRAM DOMAIN EXECUTION DOMAIN OBSERVATIONAL DOMAIN
observes include
?
Figure 2.1: Domains and entities involved in the debugging process
The process of debugging involves three separate domains, namely the program do-main, the execution domain and finally the observational domain.
The program domain includes program representations suitable for coding by a devel-oper. These representations are usual textual models, but other models for coding do exist, as it is the case with visual programming. We designate these representations as source files.
The execution domain includes the representation of a running program (designated as process) in memory. A running process consists of a state component which in-cludes its data and executional flow. A program component which inin-cludes the code
2.1. Debugging 25
produced through the compilation process of source files. And finally an interpreter component which designates the underlying execution mechanism of compiled code. The interpreter component can be a run-time software interpreter, a dedicated virtual-machine or an operating system scheduling virtual-machine-code.
The observational domain includes everything that is externally observable by a devel-oper while a process is running. These observations can include the process’ textual output to a standard device, messages from the operating system and in general any side-effectthe running process has on the outside world.
During the programming cycle, debugging is usually initiated through direct obser-vation by the programmer of a failure. We define a failure as an unwanted executional behaviorin the observational domain. Conversely a success is the observation of an exe-cution in the observational domain without failures.
A failure is caused by a series of infections in a process’ state. An infection [Voas 1992] is an unwanted computational state in the execution domain. Conversely a dis-infection is the absence of a previously existing infection.
Similarly to a failure an infection has also an underlying cause. An infection is caused by a defect in a program’s source files. A defect or bug [Beizer 1990, Humphrey 1999] is an unintended mistake introduced by the programmer in the source representation of a program. Conversely a fix is a change in the source representation of a program that eliminates a defect.
Given the above discussions we define debugging as follows:
Debugging is a two phases process via which a programmer: i) relates a failure in the observational domain to a defect in the program’s domain and ii) subsequently val-idates the elimination of a defect by applying a fix in the program’s domain and relating it to a success in the observational domain.
We call the first phase of debugging the inference phase where a defect or bug has to be inferred from an observed failure. While we designate the second phase as the validation phasewhere a possible fix is validated by an observed success.
Failures and defects as well as fixes and successes have a cause and effect relationship, which cannot be immediately inferred by the programmer. This is the inherent difficulty of the debugging process. For example a programmer may observe that a program crashed or misbehaved while trying to respond to a certain input. The cause though of this misbehavior may have originated several calls before the processing of the offending input itself by the program.
To infer a defect from a failure and devise a suitable fix for a success, both phases of debugging have to rely on hypotheses and experimentations. Zeller [Zeller 2005] draws the following analogy between the debugging process and the scientific method for the inference phase of debugging:
2. Invent an hypothesis as to the failure cause that is consistent with the observations. 3. Use the hypothesis to make predictions.
4. Test the hypothesis by experiments and further observations. 5. If the experiment satisfies the predictions, refine the hypothesis.
6. If the experiment does not satisfy the predictions, create an alternate hypothesis. 7. Repeat steps 3 and 4 until the hypothesis can no longer be refined.
A similar process can be devised for the validation phase of debugging where the de-veloper makes an hypothesis over a possible fix. As we can see from steps 6 and 7 of the above process, debugging is an intensive and iterative process. This is the reason why debugging tools exist to assist the programmer and facilitate experimentation during both phases.
Debugging tools fall into two main categories: a) those that incorporate post-mortem analysis and b) those that externally observe the state and execution flow of a running process. It is the debugging tools of this second category that are usually designated as debuggers. We can define a debugger as follows:
Debugger A debugger is an additional process of the execution domain used for run-time analysis. The debugger acts upon the process that is being debugged (i.e., the debuggee), making a subset of the execution domain part of the observational domain.
2.2
Remote Debugging
Software is rarely deployed on the same machine it was written or debugged on. This is even mandatory, when building software for devices with resource constraints (e.g. smart-phones) or ones with no input/output interfaces (keyboard, mouse or screen) for develop-ment (e.g. robots). In these cases debugging can be challenging because the target machine can be very different from the development one. Although emulators can help in this case, they are not always available, and are often of limited accuracy, especially when sensory input or actuators are involved. Thus, developers have to use the target machine for debug-ging.
Remote Debugger A remote debugger, is a debugger whose process runs on a different machine than that of the debuggee.
A widely used local and remote debugger is the GNU debugger [Richard Stall-man 2003] which supports the two phases of debugging (inference and validation) by pro-viding the following facilities:
2.2. Remote Debugging 27
2. Make a program stop on specified conditions.
3. Examine what has happened, when a program has stopped.
4. Change things in your program, so you can experiment with correcting the effects of one bug and go on to learn about another.
2.2.1 Remote Debugging Through Logging
Logging is the most prominent example of post-mortem analysis. Post-mortem analysis is the observation and reasoning process on a running program after its successful or failed execution. In terms of the notions that we introduced in the previous section we define logging as follows:
Logging Logging is a post-mortem analysis technique which augments the observational domain with information from the execution domain via the injection of code in the program domain.
Injecting code in the program domain can be done manually by the programmer, as in the case of printf debugging where the programmer manually intercepts program logic with logging methods that register information in the standard output. It can also be done semi-automatically through logging frameworks such as Log4j [Gupta 2007] and finally through compile-time facilities such as aspect frameworks like AspectJ [Kiczales 2001] which can hide this injection from the textual representation of a program and introduce it only in the final executable.
Concerning the debugging process logging can be used to expose infections and disin-fectionsto the observational domain. By examining the logs produced during an execution the developer can devise informed hypothesis (using the information in the logs) about the causal connection between a failure and a defect. He can subsequently through the use of those logs incrementally validate a possible fix.
Figure 2.2 shows how the remote debugging process unfolds when it is achieved through logging. In the inference phase after having observed a failure the developer needs more information concerning the process state to invent, confirm or dispute an hypothesis. In step 1 (Coding and Compilation step of Figure 2.2) he injects his logging directives into the program’s code. In step 2 the program is deployed and executed (step 3) in such a way so that the failure is reproduced. In step 4 the log is collected (from the standard output or elsewhere) and in step 5 the developer reasons upon the log and the observed execution trying to infer a defect from both the observed failure and the possible infection which is exposed through the logs.
Similarly in the validation phase after having applied a possible fix the programmer can use the logs to validate a disinfection on the program’s state or to refine his fix.
Logging is said to be the most widespread debugging technique [Zeller 2005] since in its simplest form (of printf debugging) is accessible even to inexperienced developers and can have little to zero infrastructure requirements. The content however of the execution log is determined by decisions made at the coding and compilation step (step 1). Often,
Developer's
end Target Devices
Deployment Log Collection 1 Coding / Compilation 2 Execution 3 4 5 Post-mortem analysis
Figure 2.2: Debugging with Post-Mortem Analysis
developers don’t know which information they need until the analysis stage. But, since the analysis is post-mortem, collecting missing information requires to go again through a whole cycle, after adapting the code or the compilation flags and options. On the other hand if the logging is too extensive the output will be cluttered making hard to distinguish useful information.
If the execution log is verbose enough but not cluttered the developer can form an hypothesis on what went wrong during the execution. To test this hypothesis the developer has to repeat again the process. He will develop a new version of the software, deploy it, run it on the target, and then re-collect the logs. Yet another post-mortem evaluation will confirm or refute the validity of the possible solution.
Review of this debugging solution. First, the developer relies on the verbosity of the log. If it is too verbose, the developer might be overwhelmed with the amount of data. Conversely, limited logging may lead to several debugging cycles just for collecting data that will hint on some specific defect. This is due to the static nature of logs. Finally the cycle for re-compilation and re-deployment is time consuming, which makes debugging even more awkward.
2.2.2 Using a Remote Debugger
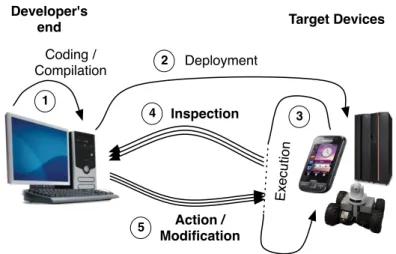
In Figure 2.3 we show the different steps of a debugging process assisted by a remote de-bugger. In the inference phase after having observed a failure the developer needs more information concerning the process state to invent, confirm or dispute an hypothesis. In or-der to do that through a remote debugger he has to set up his environment accordingly. For example when executing the process in step 2 he has to instruct the underlying execution mechanism (designated as interpreter) to allow debugging and also deploy the debugging support.
2.2. Remote Debugging 29 Deployment Inspection Coding / Compilation 2 Exe cu tio n 3 Action / Modification 1 4 5 Developer's
end Target Devices
Figure 2.3: Remote debugging and interaction with a live execution
is either user-generated (the developer chooses to freeze the execution to inspect it) or is based on pre-determined execution events, like the raise of an exception. This is in contrast with Figure 2.2 where execution proceeds uninterrupted until it is finished, at which point the execution context is lost. Steps 4 and 5 represent the debugging loop. This loop takes place at execution time and in the presence of the execution context which can be inspected and modified. Step 4 represents the inspection phase, where information about the current execution context is retrieved from the target process. While in step 5 we depict the modification phase where the developer can a) provide further user-generated interruption points (breakpoints, watchpoints etc.) b) alter execution and its state (step, proceed, change the values of variables) and finally c) incrementally update parts of the code deployed in step 2 (save-and-continue, hot-code-swapping). Several loops can occur during the execution depending on the developers’ actions (step, proceed, user-generated interruptions) and on execution events (exceptions, errors, etc.).
Similarly in the validation phase after having applied a possible fix the programmer can use this augmented observational domain (which now includes part of the execution domain that can be observed and changed through the remote debugger) to validate a disinfection on the program’s state or to incrementally refine his fix.
Review of this debugging process. Having the ability to introspect and modify a live execution (without loosing the context) is a major advantage compared to evaluating static logs. The hypothesis that the developer forms for a possible solution is much more in-formed in this case. Indeed in a lot of cases by being able to follow execution and introspect or set variables in the target itself, one can be almost certain for the validity of a possible solution.
We thus conclude that using remote debuggers is the most sensible solution in situa-tions where targeted devices (such as smartphones or cloud-based servers) have different hardware or environment settings than development machines.
2.3
Requirements for Remote Debugging Solutions
Despite their applicability for our problem domain, remote debuggers can also prove awk-ward to use due to their distributed nature. As an example, we can consider the cost of re-deployments in-between remote debugging sessions. Empirical studies show us that on average 10.5 minutes per coding hour (over five 40-hour work weeks per year) are spent for re-deploying applications while fixing bugs or improving functionality [Zero-TurnAround 2011]. This means that the specific facilities that a remote debugging solution offers (e.g. for incremental updating or experimentation) during a remote debugging ses-sion can have a huge impact on productivity.
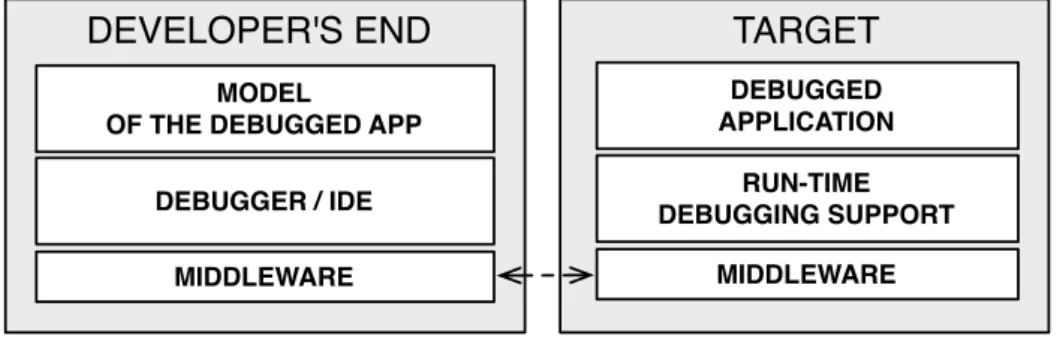
In this section, we present four desirable properties that an ideal remote debugging so-lution should exhibit. These properties are: interactiveness, instrumentation, distribution, and security. We introduce and discuss each property based on a typical software stack for supporting remote debugging, as depicted in Figure 2.4.
In Figure 2.4 we can see that the target device (on the right) that runs the debugged ap-plication must provide a middleware for communication and a run-time debugging support for examining processes, the execution stack, the system’s organization, introspection of instance and local variables, etc. On the other hand, the developer machine must provide a middleware, debugging tools, and also a model of the running application that describes the application running on the target (e.g., source code or breakpoints).
DEBUGGED APPLICATION
DEVELOPER'S END
TARGET
RUN-TIME DEBUGGING SUPPORT
MIDDLEWARE DEBUGGER / IDE
MODEL
OF THE DEBUGGED APP
MIDDLEWARE
Figure 2.4: Software Entities Involved in Remote Debugging.
2.3.1 Interactiveness
We define interactiveness as the ability to dynamically inspect and change the target ap-plication code. By dynamically we mean that inspections and changes can be performed while the application is running.
In Figure 2.4, there is an implicit relationship between the model of the debugged application (on the developer’s end), and the state of the debugged application (on the target). This relationship can be either static or dynamic, depending on whether a change in either one of them updates the other or not. When a remote debugging solution is interactive, this relationship is dynamic.
2.3. Requirements for Remote Debugging Solutions 31
The fact that the target application does not need to be restarted in order to be debugged or evolved allows developers to:
• Track the origins of bugs and fix them without losing the execution context. • Fix heisenbugs [Gray 1986], i.e., bugs that are not easily reproducible.
• Increase productivity while debugging applications. Especially in situations where a full re-deployment is involved or in applications with a long startup time.
• Fix flaws [Zeller 2005] from within the debugger. Flaws are architectural bugs that are not associated with a specific location in the source file and require an architec-tural update (removing or adding new code) in order to be addressed.
• Debug critical applications (e.g server side applications) that cannot be restarted. Ideally, in OO languages developers should be able to evolve every organizational mod-ule and properties of the target application while debugging. These changes should include: Adding/Removing Packages The ability to introduce new packages (i.e named groups of
classes) and remove existing ones.
Adding/Removing Classes The ability to introduce new classes and to remove existing ones.
Adding/Removing Superclasses The ability to edit a class hierarchy.
Adding/Removing Methods The ability to introduce new methods to a class and to edit or remove existing ones.
Adding/Removing Fields The ability to introduce new fields to a class or remove existing ones.
2.3.2 Instrumentation
With the term instrumentation we refer to the ability of a debugging solution to alter the semantics of a running process in order to assist debugging. Instrumentation is the underly-ing mechanism through which breakpoints and watchpoints are implemented. A debuggunderly-ing solution instruments the running process in order to halt at specific locations in the code, or when specific events occur (such as variable access) to either return control to the de-bugging environment or to perform predetermined checks and actions (such as breakpoint conditions).
Ideally in OO languages developers should be able to halt and inspect the running program both at specific locations in the source code and on specific semantical events that involve objects. In literature these events are referred to as dynamic reification categories [Redmond 2000]. These categories are a set of operations that can be thought of as events which are required for object execution [McAffer 1995] [Ressia 2010].
Taking into account these semantic events, instrumentation categories for debugging should at least include:
Statement Execution The ability to halt at a specific statement or line in the source code. Method Execution The ability to halt at a specific method in the source code upon entry. Class Instantiation The ability to halt at object creation of specific classes.
Class Field Read The ability to halt when a specific field of any instance of a class is read. Class Field Write The ability to halt when a specific field of any instance of a class is
written.
Object Read The ability to halt at any read attempt on a specific object. Object Write The ability to halt at any write attempt on a specific object. Object Send The ability to halt at any message send from a specific object. Object Receive The ability to halt at any message send to a specific object.
Object as Argument The ability to halt whenever a specific object is passed as an argu-ment.
Object Stored The ability to halt whenever a new reference to a specific object is stored. Object Interaction The ability to halt whenever two specific objects interact in any way.
This is a composite category as defined in [Ressia 2010]. It can be seen as a compo-sition of object receive, send and argument categories.
2.3.3 Distribution
As seen in Figure 2.4 remote debugging requires a communication middleware. Ideally a debugging solution should depend on middleware that is extendable and adaptable even at runtime, in order to address the different communication needs of different targets. For ex-ample targets with different resources (memory, processing power, bandwidth) may require different serialization policies. While others such as server applications may require differ-ent security policies when they are debugged through an open network (see also subsection 2.3.4).
We can distinguish the following four categories of distribution support for debugging solutions, in ascending order of adaptability:
No-Distribution (-) The debugging solution does not support remote debugging.
Fixed-Middleware (+) The debugging solution supports remote debugging via a dedi-cated and fixed protocol which cannot be easily extended.
Extensible Middleware (++) The debugging solution supports remote debugging via a general solution for distributed computing (such as an object request broker) which can be extended, such as CORBA or DCOM.
2.4. Evaluation of Existing Solutions 33
Adaptable Middleware (+++) The debugging solution supports remote debugging via a general solution for distributed computing which can be extended and adapted at runtime [David 2002].
2.3.4 Security
During the development phase a debugging target needs to be accessible through the net-work to be debugged. This fact raises a security concern since debugging by its very purpose is a process demanding full access on the target’s end. In cases where the tar-get is accessible through an open network even during development (as in the case of cloud computing) a debugging solution should at least support authentication on the target’s side. Moreover on the developer’s end, the debugging solution may be integrated inside an IDE with support for installing third-party plugins from possibly untrusted sources. For these cases a remote debugging solution should provide support for a security solution that is able to grant different access rights to different processes that want to use its facilities. As an example we can consider a third-party plugin in the IDE on the developer’s side that handles process inspection. There is no need for this plugin to be granted access to the incremental updating facilities of the target.
We can distinguish the following orthogonal sub-properties of security in the context of debugging:
Internal (+) The debugging solution itself has security provisions.
External (+) Other frameworks or technologies are used (or can be used) in conjunction with the debugging framework in order to secure the session.
Target-Side (+) The debugging solution supports authentication on the target side. Client-Side (+) The debugging solution supports access restrictions (for different
pro-cesses or threads) on the client side.
An ideal solution should support all four of them (++++).
2.4
Evaluation of Existing Solutions
We now study existing debugging solutions of major OO languages in current use today (Java (JPDA) [Oracle 2013b] [Oracle 2013a], C# (.NET Debugger) [Microsoft 2012b], C++ and Objective-C (through Gdb) [Richard Stallman 2003]) as well as dynamic lan-guages with live programming support (such as Smalltalk and its debugging model [LaLonde 1990]), taking also into account bleeding-edge technological achievements [Ze-roTurnAround 2012] and very recent research results [Würthinger 2010] [Ressia 2012b].
2.4.1 JPDA
Java’s debugging framework stack is JPDA [Oracle 2013b] and it consists of a mirror interface (JDI) [Oracle 2013a], [Bracha 2004], a communications protocol (JDWP) and
the debugging support on the target as part of the virtual-machine’s infrastructure (JVM TI). The application on the target machine must be specifically run with debugging support from the VM (the JVM TI) for any interaction between the client and the target to take place. JPDA does not provide facilities to interactively update the target other then the hot-swapping of pre-existing methods. The communication stress is handled by the low-level debugging communication protocol (JDWP), whose specification is statically defined. There are no security or authentication provisions in JPDA itself, but there exist general solutions for Java outside the framework for securing access to the target side (e.g., in mobile platforms such as android).
2.4.2 JRebel and DCE
The DCE VM [Würthinger 2010] and Jrebel [ZeroTurnAround 2012] are both modifica-tions for the Java virtual machine that support redefinition of loaded classes at runtime. Although these modifications of the underlying VM are not a solution for debugging them-selves, they do provide incremental updating facilities for remote targets. These mod-ifications if used in conjunction with the JPDA framework can support the property of instrumentation that we described in Section 2.3.
2.4.3 .NET
As with Java, the main remote debugging solution for .NET provided through visual stu-dio [Microsoft 2012b] pre-purposes a dedicated debugging deployment. In the developer’s end the model of the running application is again static, with the developer being respon-sible for providing the right sources and configuration files. In the case of .NET though the debugger can attach to a running remote process without loosing the context, provided that the static model for the application is available. Although the model in the developer’s end is static, a limited form of updating is provided in the form of edit-and-continue [Mi-crosoft 2012c] of pre-existing methods. There is no support for incremental updating of the target application with new packages, classes or methods. In terms of security the re-mote debugging solution for .NET integrates authentication mechanisms for both ends of the communication [Microsoft 2012a].
2.4.4 GDB
For Obj-C remote debugging is provided through the gnu-debugger [Richard Stall-man 2003]. Gdb uses a dedicated process on the target machine called the gdb-server to attach to running processes. For full debugging support though the deployed application has to be specifically compiled and deployed with debugging meta-information embed-ded on the executable which cannot be discarembed-ded without re-deployment and loss of the running context. The model for the application on the developer’s end is static and de-pends on the availability of source files. Gdb supports a limited form of updating through an edit-and-continue process of pre-existing methods by patching the executable on mem-ory [Richard Stallman 2003]. There are no built-in provisions for security on the debugging
2.4. Evaluation of Existing Solutions 35
solution itself. The communication scheme is statically defined through the gdb/mi (gdb machine interface) [Richard Stallman 2003].
2.4.5 Smalltalk
The most prominent example of an interactive debugger is the Smalltalk debugger [LaLonde 1990]. In Smalltalk the execution context after a failure is never lost since through reflection the debugger can readily be spawned as a separate process and access the environments’ reifications for: processes, exceptions, contexts etc. Moreover it supports in-cremental updating in such a way that introducing new behavior through the debugger is not only possible but is actually advised [Black 2009]. Indeed incremental updating through debugging encourages and supports agile development processes, and more specifically Test Driven Development (TDD) [Abacus 2005]. In addition both the debugging and the reflecting facilities of Smalltalk are extensible. On the one hand the debugger model is written itself in Smalltalk. On the other hand the Smalltalk MOP is readily editable from within the system itself. Illustrative examples of MOP extensions in Smalltalk are given from Rivard in [Rivard 1996].
2.4.6 Bifrost
Finally in Smalltalk supporting advanced debugging techniques through instrumentation is illustrated in the Bifrost reflection framework [Ressia 2010] and through object-centric de-bugging [Ressia 2012b]. Bifrost is an extension to the Smalltalk MOP that relies on explicit meta-objects to provide sub-method [Denker 2007] and partial behavioral reflection [Tan-ter 2003]. Bifrost is implemented through dynamic re-compilation of methods. Method invocations are intercepted using the reflective method abstraction [Marschall 2006] and are subsequently recompiled using AST meta-objects that control the generated bytecode. With Bifrost intercession techniques such as the explicit interception of variable access, is made available at the instance level.
2.4.7 Comparison
In this Section we compare state-of-the-art debugging solutions in terms of interactiveness, instrumentation, distribution and security.
2.4.7.1 Interactiveness
In Table 2.1 we do a comparison in terms of interactiveness and its sub-properties as there were defined in Section 2.3:
As we see in Table 2.1 debugging environments of mainstream OO languages (JPDA, .Net Debugger, Gdb) do not support interactiveness with the exception of a save-and-continue facility for pre-existing methods. In the case of Gdb method hotswapping can lead to inconsistencies [Zeller 2005] since it is supported through memory patching, which is a blind process that replaces execution instructions in memory, without knowledge of the underlying semantics of the language. In the Java world recent developments (through
JPDA .NET GDB DCE JREBEL ST-80 BIFROST
Add/Rem Packages × × × X X X X
Add/Rem Classes × × × X X X X
Add/Rem IVs × × × X X X X
Add/Rem Methods × × × X X X X
Method (Body) HotSwapping X X X X X X X
Hierarchy Editing × × × X X X X
Table 2.1: Interactiveness evaluation on state-of-the-art debugging solutions Jrebel and DCE) provide full support for interactiveness as does Smalltalk and its extension Bifrost.
2.4.7.2 Instrumentation
In Table 2.2 we do a comparison in terms of instrumentation and its sub-properties as they were defined in Section 2.3. We have also included a last category marked as condition/ac-tionthat describes whether in all instrumentation events the debugging solution can support user-generated checks and code in order to provide a more fine-grain control. As an exam-ple we can consider a conditional breakpoint that is able to execute user specified actions when triggered.
JPDA .NET GDB DCE JREBEL ST80 BIFROST
Method Execution X X X X X X X Statement Execution X X X X X X X Field Read X × × X X × X Field Write X × × X X × X Object Read × X X × × × X Object Write × X X × × × X Object Send × × × × × × X Object Receive × × × × × × X Object as Argument × × × × × × X Object Creation × × × × × × X Object Interaction × × × × × × X Object Stored × × × × × × × Condition/Action × × X × × X X
Table 2.2: Instrumentation evaluation on state-of-the-art debugging solutions As we can see from our comparison, Bifrost is the front-runner of instrumentation with all other solutions supporting only plain breakpoints and watchpoints. Bifrost lacks an Object Stored event which is useful for following an object’s reference propagation and counting. Finally both Bifrost and Gdb provide support for both conditions and actions on instrumentation events.
2.4.7.3 Distribution
In Table 2.3 we do a comparison in terms of distribution. Solutions are marked with - for not supporting distribution, + for supporting distribution through a fixed-middleware, ++ for an extensible middleware and +++ for an adaptable middleware.
2.4. Evaluation of Existing Solutions 37
JPDA .NET GDB DCE JREBEL ST80 BIFROST
Distribution + ++ + + + -
-Table 2.3: Distribution evaluation on state-of-the-art debugging solutions
As we can see in Table 5.4 no solution supports an adaptable middleware. The .NET debugging framework leads the comparison using a general purpose and extensible com-munication solution (DCOM) [Microsoft 2013]. We should note here that in the case of Smalltalk (which does not support the property of distribution), there were some efforts in the past to support remote development (including debugging) in Cincom Smalltalk, which were discontinued.
2.4.7.4 Security
In Table 2.4 we do a comparison in terms of security support while debugging as was described in Section 2.3:
JPDA .NET GDB DCE JREBEL ST80 BIFROST
Built-in × X × × × × ×
External X X X X X × ×
Target-Side X X X X X × ×
Developer-Side X X × X X × ×
Table 2.4: Security evaluation on state-of-the-art debugging solutions
As we can see in Table 2.4 only the .NET debugging framework has build-in provi-sions for security [Microsoft 2012a] for both the target and the developer side. In the Java world though (JPDA, DCE, JREBEL) there are other frameworks that are used in con-junction with JPDA in order to secure the debugging session such as the Java Security Manager [Oracle 2013c]. Gdb specifically warns developers not to use its remote debug-ging facilities in public networks [Richard Stallman 2003] and has no built-in provisions for access restrictions in the client side either. In this case the developer can only resort to external solutions such as a firewall or a VPN. For Smalltalk as far as the local debugging scenario is concerned (i.e no support for distribution) there are no security provisions. 2.4.7.5 Comparison overview
In Table 2.5 we present an overview of our comparison in terms of all properties that were described in Section 2.3:
Property JPDA .NET GDB DCE JREBEL SMALLTALK BIFROST
Interactiveness + (1/6) + (1/6) + (1/6) +++ (6/6) +++ (6/6) +++ (6/6) +++ (6/6) Instrumentation + (4/13) + (4/13) + (5/13) + (4/13) + (4/13) + (3/13) +++ (12/13)
Distribution + (fixed) ++ (extensible) + (fixed) + (fixed) + (fixed) - (no) - (no) Security +++ (3/4) ++++ (4/4) ++ (2/4) +++ (3/4) +++ (3/4) - (0/4) - (0/4)
As we can see from Table 2.5 debugging solutions based on reflection (such as Smalltalk and Bifrost in the local scenario) offer the most complete solutions in terms of interactiveness and instrumentation, but lack support for distribution and security. On the other hand solutions that do support these properties such as debugging environments of mainstream OO languages (JPDA, .Net Debugger, Gdb) and their extensions (Jrebel, DCE) lack support for either interactiveness or instrumentation (or in some cases both). There is no solution that meets all our criteria in a satisfactory way.
2.5
Summary
In this chapter we provided definitions for the processes of debugging and remote debug-ging as well as the notions that they involve. We distinguished remote debugdebug-ging ap-proaches into those that incorporate post-mortem analysis (such as logging) and those that make use of dedicated remote debugging frameworks that allow live inspection of the run-ning process. We concluded that using remote debuggers is the most sensible solution in situations where targeted devices (such as smartphones or cloud-based servers) have dif-ferent hardware or environment settings than development machines. We then defined four major properties of remote debugging solutions, namely: interactiveness, instrumentation, distributionand security as well as their sub-properties. Interactiveness is the ability of a remote debugging solution to incrementally update all parts of a remote application with-out losing the running context (i.e withwith-out stopping the application). Instrumentation is the ability of a debugging solution to alter the semantics of a running process in order to assist debugging. Distribution is the ability of a debugging solution to adapt its framework while debugging a remote target. Finally security refers to the availability of prerequisites for security mechanisms in a remote debugging solution, such as authentication and ac-cess restriction. Then by using these properties we evaluated and compared state-of-the-art debugging solutions and concluded that none of them meets all of our criteria.
C
HAPTER3
Reflection for Remote Debugging:
Architectural Alternatives
Contents
3.1 Reflection . . . 40 3.2 Reflection for Remote Debugging . . . 43 3.3 Architectural Alternatives for Remote Reflection . . . 44 3.4 Summary . . . 55
At a Glance
In this chapter we study and provide definitions for reflection and remote re-flection. We use these definitions in order to assess the use of reflection for remote debugging. We study different design patterns that facilitate remote reflection, namely: the remote proxy, the remote facade and mirrors and dis-cuss their strengths and shortcomings. Finally we pinpoint some open-issues regarding reflection in the context of debugging.
3.1
Reflection
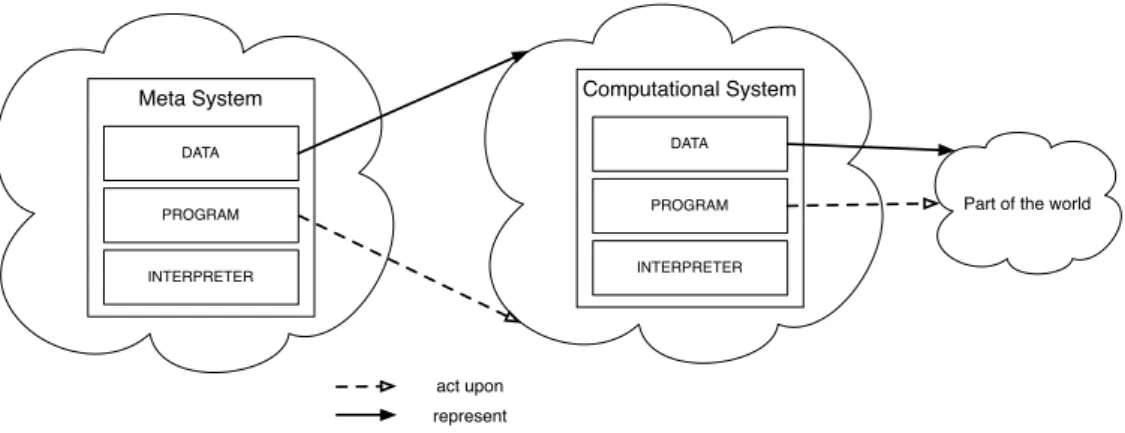
P. Maes has proposed in the first chapter of her thesis [Maes 1987a], precise definitions to clearly characterize meta-programming and reflection. We refer here to these definitions and illustrate them in Figures 3.1 and 3.2:
• A computational system is something that reasons about and acts upon some part of the world, called the domain of the system.
• A computational system may also be causally connected to its domain. This means that the system and its domain are linked in such a way that if one of the two changes, this leads to an effect upon the other.
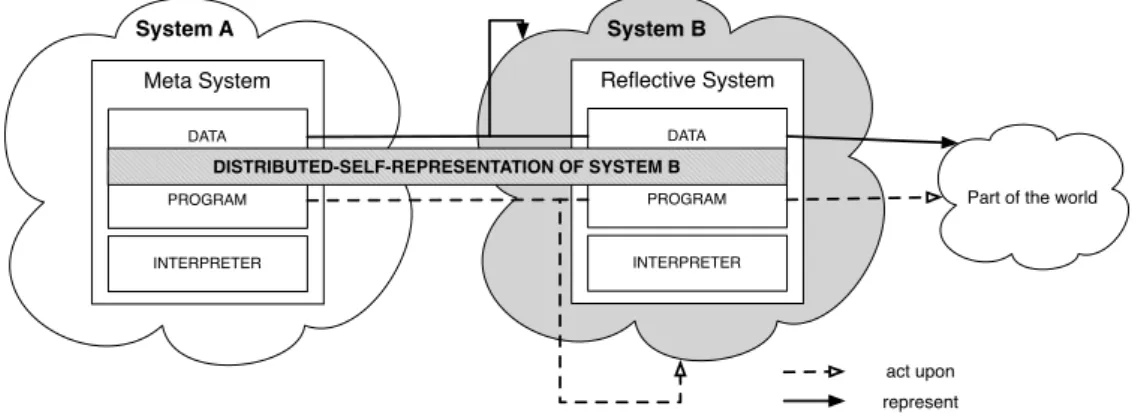
• A meta-system is a computational system that has as its domain another computa-tional system, called its object-system. [...] A meta-system has a representation of its system in its data. Its program specifies meta-computation about the object-system and is therefore called a meta-program.
Part of the world DATA PROGRAM Computational System INTERPRETER act upon represent DATA PROGRAM Meta System INTERPRETER
Figure 3.1: Relationships between a meta-system, a computational system and its domain Reflection describes the ability of a system to reason and act upon itself. P. Maes [Maes 1987a] defines reflection in terms of meta-systems as follows:
• A reflective system is a causally connected meta-system that has as object-system itself. The data of a reflective system contain, besides the representation of some part of the external world, also a causally connected representation of itself, called self-representation of the system. [...] When a system is reasoning or acting upon itself, we speak of reflective computation. (see Figure 3.2).
It can be argued [Bracha 2010] that reflection is an inherited ability of the Von Neuman model of computation [von Neumann 1945]. This is a direct consequence of the fact that both code and data are being stored in computer memory as data (code/data duality). This gives the ability to a running process to manipulate its own code.
3.1. Reflection 41 Part of the world DATA PROGRAM Reflective System INTERPRETER act upon represent
Figure 3.2: A reflective system
The notion itself however of reflection was formally introduced to programming lan-guage literature by Brian Cantwell Smith in 1982 (by means of the programming lanlan-guage 3-LISP [Smith 1982]). Smalltalk was to follow incorporating reflection to its design [In-galls 1983].
Reflective facilities We now provide definitions and examples for different aspects of reflective systems combining compatible but different approaches in related literature: [Maes 1987b], [Ferber 1989], [Bracha 2004].
In OO reflective systems, reflection is concretized using a MOP (Meta-Object Proto-col). A meta-object is a regular object that describes, reflects or defines the behavior of a notion of the language in question. The process of materialization of a notion of a language (such as an object, a class, a context or a method) as an object inside the language itself is called reification. The Smalltalk MOP which we will use to illustrate our definitions, is thoroughly described in [Rivard 1996].
Structural Reflection refers to the ability of a program to explicitly query and alter its internal state. Depending on which of the two operations (read or write) we are using we can further distinguish structural reflection into introspection and self-modification.
Introspection Query/Read e.g.
Object>>instVarAt:"answer an indexed variable value"
Object>>class"answer the receiver’s class"
Object>>identityHash"answer the receiver’s identity"
ProtoObject>>pointersTo"answer all objects in the system that hold a pointer to the receiver"
Behaviour>>allSelectors"answer all selectors understood by the receiver"
Object>>instVarAt:put:"store a value into an indexed variable in the receiver"
Object>>become:"swap the pointer between the receiver and the argument"
Behaviour>>addSelectorSilently:withMethod:"add a method to the receiver"
Behaviour>>superclass:"change the superclass of the receiver"
Behaviour>>adoptInstance:"change the class of the argument to the receiver"
Behavioral Reflection refers to the ability of a program to dynamically execute code, al-ter its compilation process, and implicitly (on specific executional events) alal-ter its semantics. Behavioral reflection can be sub-categorized into dynamic-execution fa-cilities and intercession fafa-cilities. The latter can be further sub-divided into syntactic intercession (also known as compile-time reflection) and semantic intercession.
Dynamic Execution Execute e.g.
ProtoObject>>withArgs:executeMethod:"execute a method against the receiver"
Compiler>>evaluate:"compile and evaluate a string"
Object>>perform:withArguments:"send a message with a specific selector to the receiver"
Intercession
Syntactic Intercession
Compiler>>compile:in:notifying:ifFail:"compile a string" "through overriding, example use: domain specific languages"
Semantic Intercession
Object>>doesNotUnderstand:"handle a message not understood by the receiver"
ProtoObject>>cannotInterpret:"handle a message when a nil method dictionary is encountered"
We summarize these definitions on Figure 3.3 where we present reflection in two di-mensions. The horizontal dimension is the invocation dimension (i.e whether reflection is invoked explicitly in the program code, or implicitly by the execution environment) and the second is the action dimension (i.e distinguishing between different categories of reflective actions: read, write, execute and compile).
We also show that other definitions for reflection can be expressed in terms of those two. Such as the distinction between structural (white cells) and behavioral (grey cells) reflection, as well as the temporal characterization of reflection (run-time versus compile-time reflection).
Reflective systems can also be characterized according to: Abstraction, Scoping and Pluggability:
Abstraction: Low-level/High-level Reflection
Low-level reflection has as domain a program’s representation in memory (ob-ject representation) and the semantics of the underlying execution mechanism (e.g