HAL Id: hal-02464997
https://hal.archives-ouvertes.fr/hal-02464997
Submitted on 6 Feb 2020
HAL is a multi-disciplinary open access
archive for the deposit and dissemination of
sci-entific research documents, whether they are
pub-lished or not. The documents may come from
teaching and research institutions in France or
abroad, or from public or private research centers.
L’archive ouverte pluridisciplinaire HAL, est
destinée au dépôt et à la diffusion de documents
scientifiques de niveau recherche, publiés ou non,
émanant des établissements d’enseignement et de
recherche français ou étrangers, des laboratoires
publics ou privés.
Performance of Mesoporous Carbon/Sn-Based
Nanocomposites in Li-Ion Batteries
Cristina Nita, Julien Fullenwarth, Laure Monconduit, Jean-Marc Le Meins,
Julien Parmentier, Moulay Tahar Sougrati, Camélia Matei ghimbeu
To cite this version:
Cristina Nita, Julien Fullenwarth, Laure Monconduit, Jean-Marc Le Meins, Julien Parmentier, et al..
Understanding the Sn Loading Impact on the Performance of Mesoporous Carbon/Sn-Based
Nanocom-posites in Li-Ion Batteries. ChemElectroChem, Weinheim : Wiley-VCH, 2018, 5 (21), pp.3249-3257.
�10.1002/celc.201800835�. �hal-02464997�
Understanding the Sn loading impact on the performances of
mesoporous carbon/Sn based nanocomposites in Li-ion batteries
Cristina Nita
[a],[b], Julien Fullenwarth
[c],[d], Laure Monconduit
[c],[d], Jean-Marc Le Meins
[a], Julien
Parmentier
[a], Moulay Tahar Sougrati
[c],[d], Camélia Matei Ghimbeu
[a],[d],*Abstract: Herein, we report a systematic study on the understanding of the influence of tin metal precursor salt amount on the formation of carbon/tin hybrid materials and their performances as anode in Li-ion batteries. Small Sn metallic particles (≈ 5 nm) covered by a SnO2 layer were uniformly dispersed in a mesoporous
carbon for low loading of tin, while for higher Sn loading the formation of Sn-based particles aggregates (~200 nm) is promoted as well. By increasing the Sn loading from 20 to 80%, the irreversible capacity was successfully reduced and the reversible capacity improved. This could be mainly related to the decrease of the C/Sn hybrids specific surface area and the increase of the Sn active species. For long term cycling, capacity fading was observed particularly for high Sn loadings and assigned to the Sn nanoparticles placed outside the carbon network which upon lithiation witness large volume expansion leading to severe particle growth and agglomeration.Therefore, similar reversible capacities at long cycling are reached no matter the Sn loading. For optimal electrochemical performances, it appears that a balance between the amount of Sn and uniform small Sn-based particles dispersion within carbon matrix must be assured in order to design high performance anode for Li-ion batteries.
Introduction
During the last years, the interest for environmentally friendly processes and alternative sources dedicated to energy generation and storage has significantly increased. For electrical vehicles and portable electronics applications, the Li-ion batteries have been considered the most important power
sources due to their high energy density, operating voltages and lightweight design [1]. However, the fast development of the
technology demands high performing batteries, but in the same time safety and low-cost.
A Li-ion battery contains several components, each of these contributing in different ways to the improvement of the battery performances, the anode inducing a significant impact [2].
Nowadays, graphite is the most used anode in Li-ion batteries, with a theoretical capacity limited to 372 mAh g-1, because of the
limited Li storage capacity (one Li atom for six carbon atoms) [3].
In order to improve the capacity as compared to graphite an increasing interest was focused on other anode materials. For such purposes, the Sn or Sn-based materials have been considered among the best candidates, especially due their higher theoretical capacity (781 mAh g-1 for SnO
2 [4] and 990
mAh g-1 for Sn [5]). However, such metals suffer an important
volume expansion during lithiation step and therefore, particles agglomeration and electrode pulverization occurs along with the loss of electrochemical performances. These drawbacks could be overcome by downsizing the Sn particle size [6] and by using
different carbon materials (carbon nanotubes [7],[8], carbon fibers [9], carbon nanospheres [10], graphenes [11], graphite [12],
mesoporous carbon [3],[13]) as supports for Sn-based hybrid
materials. This allow to alleviate the macroscopic volume expansion of the composite material and, in the same time, increase its electrical conductivity and provide efficient pathways for electrolyte diffusion as demonstrated by several works
[14],[15],[16],[17].
Wu et al. [18] reported the preparation of SnO
2-CNTs using
glucose through a hydrothermal approach, followed by a carbonization at 500oC in nitrogen atmosphere. The materials
present a discharge capacity of 400 mAh g-1 at current density of
100 mAg-1, after 50 cycles, slightly higher than that of graphite,
but lower than the theoretical capacity of the composite because of the solid-electrolyte interphase (SEI) formation. Cui et al. [17]
reported the preparation of Sn/onion-like carbon nanocapsules by arc discharge method with a reversible capacity of 585 mAh g-1 after 100 cycles at very low current rate, 100 mA g-1, while
Han et al. [16] succeeded to increase the capacity up to 902 mAh
g-1 (at 100 mA g-1 after 1000 cycles) by introducing nitrogen (N)
atoms in the carbon framework. The high capacity and the stable cycling could be promoted by the very low current rate used. Another limitation is the complexity of the synthesis procedure which involves specific pressure and temperature conditions. Guo et al. [10] prepared Sn nanoparticles embedded
in N-doped hollow nanosphere which delivered 500 mAh g-1 at
5C after 500 cycles. Nano size tin particles embedded in porous multichannel carbon microtubes were synthesized by electrospinning and provided a capacity of 350 mAh g-1, at 2 C
rate after 600 cycles [19]. Liu et al. [20] repported capacities up to
520 mAh g-1 at 500 mA g-1, after 1000 cycles,for Sn/N-doped
carbon nanospherers prepared by arc discharge method. Jahel
et al. [21],[3] pointed out that the confinement of electrochemically
active SnO2 nanoparticles (ca. 2 nm in diameter) in the pores of
a mesoporous carbon is the key parameter to avoid the particle growth and agglomeration, affording high capacity and long
[a] Dr. C Nita, Dr. J-M Le Meins, Dr. J Parmentier, Dr. C. Matei Ghimbeu
Université de Strasbourg, Université de Haute-Alsace, Institut de Science des Matériaux de Mulhouse, UMR 7361, CNRS Address : 15 rue Jean Starcky, BP 2488, 68057 Mulhouse Cedex, France
E-mail: camelia.ghimbeu@uha.fr [b] Dr. C Nita
Center for Advanced Laser Technologies (CETAL), National Institute for Lasers, Plasma and Radiation Physics, Atomistilor 409 bis, RO-77125, Magurele, Romania
[c] J Fullenwarth, Dr. L Monconduit, Dr. M T Sougrati
CG/AIME (UMR 5253 CNRS), Université Montpellier II CC 15-02 Place E. Bataillon, 34095 Montpellier Cedex, France
[d] J Fullenwarth, Dr. L Monconduit, Dr. M T Sougrati, Dr. C Matei Ghimbeu
Réseau sur le Stockage Electrochimique de l'Energie (RS2E) CNRS FR3459
33 Rue Saint Leu, 80039 Amiens Cedex, France
Supporting information for this article is given via a link at the end of the document.
stable cycling life (up to 2000 cycles). The improvement of the C/SnO2 anode materials performances was achieved, with a
reversible charge capacity up to 443 mAh g-1 at 1C current rate
after 2000 cycles. However, the irreversible capacity of the first charge-discharge cycle was still high, the later one remaining still an important problem of such materials and is mainly related to several factors as enumerate next: (i) solid electrolyte formation due to the reactions of the electrolyte with the high surface area of the porous carbon support, ii) the electrolyte consumption due to the reduction of tin oxide species to Sn metallic phase, according to the reaction described in [3] and iii)
the small amount of active phase (40 wt.% SnO2, corresponding
to 31 wt.% Sn) in the composite, and therefore, the high amount of carbon (with a low electrochemical activity after the first discharge).
In order to overcome these drawbacks, the present study aims to systematically investigate the influence of Sn-based nanoparticles loading on the irreversible capacity, the reversible capacity and the cycle stability of carbon/Sn hybrids. As far as we know and highlighted by the literature review gathered in Table 1, no systematic study have been performed until now for Sn/C hybrids to evaluate how the Sn/SnO2 loadings can
influence the formation of Sn/C hybrid materials (particle size, surface chemistry and porosity) and further impact their electrochemical performances in Li-ion batteries. In addition, the contribution of each component (carbon and Sn) to the irreversible/reversible capacity and the long term cycling is not addressed either to our knowledge.The improvement of irreversible and reversible capacity in the first cycles compared to the commercial graphite anode by adding high amounts of Sn, as well as the capacity fading behavior with further cycling is discussed in the light of material characteristics (nanoparticle dispersion/confinement in the carbon mesopores, amount of SnO2 present in the nanoparticles and specific surface area).
Table 1. Carbon/Sn-based materials for lithium-ion battery.
Carbonaceous /Sn-based material Preparation method of composite Electrochemical performances vs. Li Refs Curren t density (mAg-1) Rever sible capac ity (mAh g-1) Cycle s numb er Onion-like carbon NCs/Sn NPs Arc-discharge method 100 585 100 [17] Sn nanocapsules/ N-doped onion-like carbon Arc-discharge method 100 902 1000 [16] Sn nanowires/Car bon nanotubes Chemical vapor deposition (CVD) 100 420-630 30 [8] Sn/Carbon core-shell Hydrothermal method, Heat treatment 100 400 50 [22] Sn nanoparticles/N -doped hollow nanosphere Solvothermal method 0.2 C 1070 200 [10] 5 C 500 500 Sn/carbon nanotubes composite Acid-etching treatment 30 413 100 [15] Sn NPs/Carbon nanotubes nanocapsules Direct current (DC) arc-discharge method 100 600 10 [14] SnO2 nanocrystals/ carbon nanotubes Solvothermal method 200 497 300 [23] SnO2/carbon nanotubes Solvothermal method 100 709 100 [7] SnO2/Carbon nanotubes Hydrothermal approach 100 400 50 [18] Sn/N-doped carbon nanospherers Arc-discharge method 500 520 1000 [20] Sn NPs/ carbon microtubes Electrospinnin g, carbonization 2C 350 600 [19] Sn particles/ Carbon fibers Impregnation/ heat treatment 0.1 C 740 160 [9] Sn/graphite Electrocatalysi s C/15 433 35 [12] Sn NPs /carbon/ graphene Hydrothermal process 100 662 100 [11] Sn/carbon nanocomposite Sol-gel carbothermal reduction 20 588 200 [5] Sn/porous carbon 100 788 300 [24] Sn/ mesoporous carbon Sol-gel polymerization 20 400 15 [13] SnO2/Mesopor ous carbon Impregnation Heat Treatments 1 C 511 500 [3] 200 367 2000
Results and Discussion
Material characterizationMesoporous carbon materials with embedded Sn nanoparticles were synthesized and characterized in order to study the influence of Sn loading on the C/Sn hybrid material characteristics and performances. The idea of using carbons with tunable pore size was motivated by our previous work [3],[21]
where we have shown that the confinement of small SnO2
nanoparticles inside the pores is the key parameter to avoid NPs agglomeration and to ensure long and stable cycle life in the battery.
The XRD pattern of mesoporous carbon exhibits three diffraction peaks, corresponding to the hexagonal graphite structure (Figure S1a, Supporting Information). The presence of broad peaks indicates a low degree of graphitization. SAXS patterns (Figure S1b, Supporting Information) display an intense peak at 0.97o (2 theta) sign of the presence of a mesoporous
structure which is confirmed by TEM images reveling a worm-like structure with mesopores having relatively uniform size (Figure S1c, Supporting Information).
For C/Sn hybrid materials, the XRD patterns exhibit several intense peaks which were all indexed to the tetragonal Sn phase (pdf 00-004-0673) (Figure 1). A small quantity of SnO2 is also
formed as evidenced by the small and large (211) peak at 51o
(2theta), noted ♦ [19].This oxide is probably present as a layer
formed around the Sn nanoparticles and it could be formed during the “exposure” of the sample in air, since it is well known that smaller the nanoparticles are, easier their oxidization is [25]
but also can be due to incomplete reduction of the Sn-based precursor. The nature and amount of such oxide layer is worth to be investigated in more detail since it is electrochemically active in the battery and contributes to the active mass of the samples.
Figure 1. XRD patterns for C/Sn hybrid materials with different Sn loading (x%
Sn@C, x=20/40/60/70/80).
If the structure of the materials was not changed by varying Sn loading, the size of the Sn crystallites seems to be significant influenced. Particle size information was extracted by two complementary experiments: TEM and powder XRD. For this last one, the crystallite sizes which are related to size of domains over which diffraction is coherent (later called "apparent size") were extracted from the FWHM (full width at half maximum) of individual diffraction line profile via WinPlotr [26],
DIFFRAC.EVA [27] and then using the Scherrer formula [28]. Main
objective is to obtain a trend for the same family of compounds. Instrumental resolution function of the diffractometer was taken into account for the calculation because of the rather low FWHM values but let us keep in mind the limitation of the method according to the different hypothesis it involves (Gaussian peak profiles, size distribution not too large, etc…). The selected Sn reflection for this study is (200) which is the most intense, not too affected by asymmetric profile and with no peak overlap. Anisotropic line broadening is not observed for all these hybrid materials. This study allows to see the variation of the apparent size of the Sn crystallites as a function of the Sn loading (Table 2). For materials with different Sn loading, the apparent crystallite size increases with the Sn content from 67 nm for 20 wt.% of Sn to 148 nm for 80 wt.% of Sn. This tendency is in agreement with Oswald ripening mechanisms and in line with our previous work [29],[30].
Insights in the structure and morphology of the different materials were assessed by STEM (Figure 2). All the composites display small particles, uniformly distributed in the carbon matrix, but also bigger particles are present as aggregates. The HRTEM images allow to estimate a size of primary particles of about ~5nm (Figure S2e, Supporting Informations). The homogeneous distribution of the smallest particles suggest that the wet impregnation/reduction protocols allow a good diffusion of Sn4+ and BH
4- species in the porous
carbon framework. Few aggregates with diameters ranging between 50 to 200 nm can be distinguished, especially for materials with high Sn loading (70%Sn@Cand 80%Sn@C). For the larger particles, their size increases with the loading as shown previously [29],[30] and also observed by XRD
microstructural analysis (Table 2). The large size of the agglomerated particles justifies also the high and very sharp XRD peaks (Figure 1).
In addition to TEM, the energy dispersive X-ray (EDX) mapping of the C/Sn-based materials confirms the uniform dispersion of Sn in the carbon support as well as the presence of aggregates (Figure S2, Supporting Information).
Figure 2. STEM images for carbon/Sn-based hybrid materials having different
loadings corresponding to 20 wt.% Sn (a), 60 wt.% Sn (b); 80 wt.% Sn (c).
The most encountered problem, and rarely evaluated in the literature was related to the quantification of the Sn particles loading in the carbon framework and usually this problem is not addressed in many works. By considering the XRD results, it was demonstrated that the materials contains carbon, metallic Sn and SnO2. The composition and thermal/chemical stability of
C/Sn-based hybrid materials were determined by TGA in air (Figure S3a, Supporting Information), which allows the combustion of carbon and determination of final SnO2 quantity,
coming both from the initial SnO2 content, but also from the
oxidation of metallic Sn during TGA under air (Table 2). The amounts of SnO2 obtained varies between 14 and 89 wt.%.
However, only the TGA results do not allow to discriminate between the initial Sn and SnO2 in the hybrid materials.
Therefore, complementary experiments to determine Sn/SnO2
ratios of the materials were performed by Mössbauer spectroscopy (Figure 3, Table 2).
0.97 0.98 0.99 1.00 0.92 0.94 0.96 0.98 1.00 -6 -4 -2 0 2 4 6 0.88 0.90 0.92 0.94 0.96 0.98 1.00 0.85 0.90 0.95 1.00 -6 -4 -2 0 2 4 6 0.80 0.85 0.90 0.95 1.00 (a) 20% (b) 40% Tr ans mi ss ion Tr ans mi ss ion Velocity (mm s-1) Exp. Fit SnO2 -Sn (c) 60% (d) 70% (e) 80% Velocity (mm/s)
Figure 3. Room temperature Mössbauer spectra for carbon/Sn-based
materials having different Sn loadings x%Sn@C (x=20/40/60/70/80).
Spectra obtained with different Sn loadings and carbon supports were fitted with 2 unresolved doublets corresponding to SnO2 (green) and metallic tin (blue). SnO2 has an isomer shift of
0.0-0.01 mm/s and a quadrupole splitting of 0.51-0.57 mm/s, while tetragonal Sn (β-Sn) has an isomer shift of 2.51-2.53 mm s-1 and a quadrupole splitting of 0.14-0.26 mm s-1. The results
confirm the presence of both compounds: Sn and SnO2. The
Sn/SnO2 ratio measured by Mössbauer spectroscopy increases
in the increase of Sn loading in the composite (ratio from 31.6/68.4 to 60.5/39.5 Sn/SnO2 for Sn loading ranging from 40%
to 60% wt, Table 2). For high loadings (samples with 70 and 80 wt.% Sn), increase of the Sn loading does not induce a significant evolution of the Sn/SnO2 ratios.
The amount of formed SnO2 may be explained by two
factors, i.e, the particle size and particle location in the carbon network.On one hand, the Sn crystallites size increases from 67 nm to 148 nm (Table 2) when increasing the loading from 20 to 80% and the oxidation tendency generally increases with the decrease of the particle/crystallite size [25],[31]. However, starting
with 60% of loading, a slight increase of SnO2 amount is
observed (Table 2) and this may be probably related to the higher amount of agglomerated Sn particles situated on the carbon surface, therefore, not confined in carbon pores (Figure 2) and more exposed to oxidation.
For 20%Sn@C sample, the metallic Sn quantity is so low (limit of detection) that it can hardly be detected by Mössbauer, especially because of the Lamb-Mössbauer factor which is ten times smaller for Sn than for SnO2 [32]. So, for the future
calculations and experiments it will be assumed that the 20%Sn@C sample contains only SnO2.
Based on Mössbauer results which provided the Sn to SnO2
ratio in each composite, the amounts of Sn and SnO2 could be
determined taking into consideration the TGA results and further used to correctly asses the electrochemical performances (Table 2).
Table 2. Crystallite size determined by XRD and quantification of Sn and SnO2
amounts contained in the Sn/C materials, based on Mössbauer spectroscopy and TGA analysis.
The composition and chemical oxidation state of Sn on the surface of the materials (<10 nm thickness) were determined by XPS measurements (Figure S3b, Supporting Information and Table 3). Thus, the C1s, O1s and Sn3d peaks were detected. For all materials, two peaks are observed on the Sn 3d spectra and the separation binding energy between them is always 8.4 eV, which is in good agreement with the energy splitting of Sn and SnO2 [21]. The shift of the peak positions for 20%Sn@C
material could be induced by the high amount of SnO2,
confirmed also by Mössbauer spectroscopy (Table 2), which is less conductive than the metallic Sn. The Sn amount increases by increasing the loading from 26.7 wt.% for 20%Sn@C to 72.1 wt.% for 80%Sn@C, while the atomic ratio O/Sn is comprised between 1.66 and 1.9 which confirms the presence of a SnO2
layer in the surface of the material (Table 3).
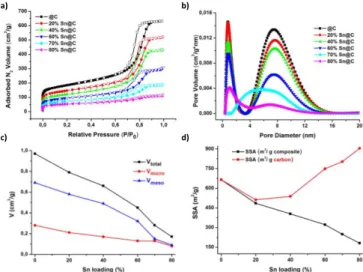
The textural properties of the carbon and composite materials (specific surface area, porous volume and pore size) were evaluated by N2 physisorption technique (77K). A mixture
of type I/IV isotherms characteristic to micro/mesoporous materials [3] were observed in all cases (Figure 4a). The low relative pressure up-takes evidence the presence of micropores (size < 2 nm). The microporous volume (Vmicro) of the carbon
support is about 0.28 cm3 g-1, with a high BET specific surface
area (SSA) of 665 m2 g-1 (Table 4).
Table 3. The chemical composition of the carbon/Sn-based materials obtained
by XPS analysis.
Material Composition, wt % Repartition of oxygen, wt%
C Sn O O-(C) O-(Sn) O-(Sn)/Sn
20%Sn@C 61.8 26.7 11.5 4.7 6.8 1.90
40%Sn@C 45.3 41.2 13.5 3.1 10.4 1.88
60%Sn@C 11.8 69.9 18.2 2.6 15.6 1.66
80%Sn@C 8.8 72.1 19.2 2.7 16.5 1.69
The total porous volume (VT) for carbon is 0.97 cm3 g-1,
indicating a mesoporosity size of 0.69 cm3 g-1 which could allow
the accomodation of the Sn-based nanoparticles. The Sn addition induces a decrease of the N2 adsorbed volume
proportional with the Sn loading (Figure 4a). The evolution of the porous volume and SSA with the Sn loading are presented in the Figure 4c, d and Table 4. The Vmicro decreases from 0.21
cm3 g-1 for 20%Sn@C to 0.07 cm3 g-1 for 80%Sn@C, while the
SSA go down to 181 m2 g-1. The V
T presents the same
decreasing trend from 0.79 cm3 g-1 for 20%Sn@C to 0.17 cm3 g-1
for 80%Sn@C, inducing the same behavior for the Vmeso values. Material Crystal lites Size (nm) Sn and SnO2 relative quantities by Mössbauer (% ) SnO2 by TGA (wt.%) Initial quantities by TGA and Mössbauer (wt. %) SnO2 (Sn (IV)) Sn (β – Sn) SnO2 Sn 20%Sn@C 67 100 0 14 14 0 40%Sn@C 78 68.4 31.6 21 14.4 6.6 60%Sn@C 107 39.6 60.4 56 22.1 33.7 70%Sn@C 110 44.8 55.2 66 29.7 36.6 80%Sn@C 148 46.9 53.1 89 41.7 47.3
As can be noticed (Fig. 4c), the mesoporous volume decrease more than microporous volume when increasing the Sn loading, suggesting a more preferential location of the particles in larger pore. This is rather related to the size of the Sn particle ~5 nm which can be better accommodated in moesopores having sizes of about 8 nm as will be discuss latter than in micropore having size < 1nm.
The pore size distribution (PSD) was obtained from the adsorption branch of the N2 isotherms using 2D NLDFT model.
The results show the presence of two types of pores: micropores ( 0.8 nm) and mesopores ( 8 nm) (Figure 4b). In contrast with the SSA and porous volumes, the pore size distribution before and after Sn/SnO2 impregnation remains constant no matter the
Sn loading. The presence of both types of pore are important, since they allow the diffusion of the electrolyte through the material and particularly the larger pores may accommodate the Sn particles and avoid their expansion/agglomeration during cycling.
Therefore, the incorporation of the Sn/SnO2 nanoparticles
induces a decrease in the surface area and porous volume. This may be explained mainly by two factors: i) higher density of metallic Sn-based particles than carbon, ii) confinement of the particles in the carbon pores (pore blockage with the particles). To discriminate between these two effects, the textural values were calculated per gram of carbon based on Sn and SnO2
contents determined in Table 2. For low loadings ranging from 20 to 40%, the SSA and porous volume calculated per gram of carbon are similar to that of pristine carbon (C), while for high loadings i.e., 60 to 80 %, surprisingly these values gradually increases (Figure 4d). Two hypotheses may be proposed for this behavior: modification of carbon during the Sn4+
infiltration/reduction/drying steps or the existence of some porosity induced by Sn aggregates.
To check the first hypothesis, the composite was washed with HCl to remove the Sn/SnO2 particles followed by several
analytical characterizations to confirm the efficiency of such treatment (Figure S4, Supporting Information). XRD pattern of the material after washing (60%Sn/C@HCl) reveals the absence of Sn peaks and the presence of specific phase of carbon with low degree of graphitization.
Table 4. Textural values of carbon support and x% Sn@C materials
(x=20/40/60/70/80).
In addition, the TGA analysis in air indicates as well the complete removal of Sn-based nanoparticles since no SnO2
residue was observed after thermal treatment, the curve of 60%Sn/C@HCl is overlapped to that of carbon one. The N2
adsorption/desorption isotherms, present similar profiles to the pristine carbon support, suggesting that the carbon texture was not either modified by the synthesis procedure. Therefore, all these characterization point out that the carbon matrix texture, structure and thermal stability is not affected by the Sn nanoparticles synthesis procedure. However, for other metallic systems confined in microporous carbon, the modification of
carbon porosity (specific surface area and pore size) could be observed due to the synthesis procedure [29].
The second hypothesis assumes some porosity coming from the small size of Sn particles or between the Sn-particles. The Sn/SnO2 can be considered non-porous, with no intrinsic
porosity. However, due to their nanometric size, the SSA may increase and an inter-particle porosity cannot be excluded as well. This porosity increases due to the fact that, by increasing the particle loading, more Sn particles are formed outside the carbon network and they may contribute to the SSA increase. In the same time, a part of particles can be confined in the pores of carbon leading to lower SSA and pore volume.
a) b)
c) d)
Figure 4. Textural properties for carbon and carbon/hybrid materials. N2
adsorption/desorption isotherms (77K) (a) and pore size distribution (b). The evolution of the porous volume (c) and SSA (d) with the Sn loading.
Electrochemical performances
From the physico-chemical analyses on the C/Sn-based materials, we observed that the modification of the Sn loading produces changes regarding the size and dispersion of the Sn-based particles, their tendency to form agglomerates by increasing the Sn loading being highlighted. The Sn nanoparticles were found to be partially oxidized, and such oxide may play a role on the irreversible capacity. The textural properties such as SSA and porous volumes decreased with increasing of the Sn loading. All these characteristics may influence on the Li-ion batteries performances will be discussed in the following part.
The electrochemical tests for carbon and carbon/Sn-based materials were performed at constant (C/5) and variable current rate (between C/10 and 3C) in the voltage range of 0.01-1.5 V (vs Li/Li+). Figure 5 presents the galvanostatic and derivative
curves for 60%Sn@C for the specified cycles. The first discharge profile show a rapid voltage drop to 1.5 V, followed by a gradually decrease down to 0.01 V, delivering a discharge capacity of 1480 mAh g-1. The subsequent discharge curves are
very different compared to the first one because of the formation of SEI on the surface of the anode during the first discharge. In the same time, the following curves are almost overlapped, indicating the good reversibility of the chemical reactions in the electrode and a good cycling stability. The initial charge capacity is 646 mAh g-1, corresponding to a coulombic efficiency of 89%.
The derivative curves (Figure 5b) for the first discharge present three peaks badly defined at 0.63, 0.0.50 and 0.38 V, the first one being shifted to 0.42 starting for the second cycle. During charge three better defined derivative peaks are at 0.60, 0.72 and 0.80 V, in good agreement with those assigned to the reversible lithiation of Sn into Li Li2Sn5, LiSn and Li2.5Sn,
respectively (Eq. 2) [2]. Material BET SSA
m2 g-1 VT cm3 g-1 Vmicro cm3 g-1 Vmeso cm3 g-1 C 665 0.97 0.28 0.69 20%Sn@C 485 0.79 0.21 0.58 40%Sn@C 404 0.66 0.17 0.49 60%Sn@C 322 0.45 0.13 0.32 70%Sn@C 249 0.28 0.12 0.16 80%Sn@C 181 0.17 0.07 0.11
Figure 5. Galvanostatic (a) and derivative curves (b) for carbon/Sn
composites 60%Sn@C at C/5 current rate in the voltage range of 0.01–1.5 V (vs. Li/Li).
Note that no clear peak appears around 1 V in discharge which would have been ascribed to the conversion reaction (Eq. 1)
[33],[2] and this may be due to the nanometric size of Sn particles.
After 50 cycles the peaks are no more visible.
SnO2 + 4Li+ + 4e- → Sn + 2Li2O (Eq. 1)
Sn + xLi+ + xe- ↔ Li
xSn (Eq. 2)
To evidence the contribution of the carbon support on the electrochemical results of C/Sn hybrid materials, the carbon support, was tested in the same conditions as the composite materials (Figure 6). The reversible capacity of carbon support after 100 cycles was 204 mAh g-1, but a high irreversible
capacity of 776 mAh g-1 was observed during the first
charge-discharge cycle, representing 78% from the first charge capacity (Table S1a, Supporting Informations). The coulombic efficiency is quite low in the first cycle (≈16%), but from the second one, it strongly increases to 80% and after 25 cycling reaching 100% (Figure 6a). The high irreversible capacity and the low columbic efficiency in the first cycles are related to the high surface area of carbon materials which induces the electrolyte decomposition with the formation of a solid electrolyte interphase.
The electrochemical performances of the hybrid materials were evaluated at constant and variable current rate and compared with their theoretical capacities (Figure 6). The theoretical capacity for each material was calculated by taking into account the real amount of each compound (Sn/SnO2/C)
(Table 2), with the theoretical capacities for Sn and SnO2 (990
mAh g-1 [5] and 781 mAh g-1 [4], respectively) and the
experimental reversible capacity obtained for the carbon which was used as support.
The irreversible capacity of C@Sn composite materials is even higher than the carbon one, suggesting a contribution of Sn-based nanoparticles to the irreversible capacity (Figure 6b). In order to determine the impact of Sn-particles on the irreversible capacity, we calculated its contribution by taking into account the experimental irreversible capacities obtained for the carbons support.
As can be noticed a decrease of the irreversible capacity with the decrease of the carbon content in the C@Sn composites is clearly observed. The 20%Sn@C presents an irreversible capacity of 1323 mAh g-1, from which 667 mAh g-1
due to the carbon while by increasing the Sn loading to 80%, the irreversible capacity was reduced to 653 mAh g-1 (43%). These
values are lower than those of Sn powder, where an irreversible capacity around 1350 mAh g-1 representing 93% from the initial
capacity was reported in the literature [34]. The significant
decrease of the irreversible capacity for 80%Sn/C compare to that of Sn powder (93%) and, in the same time, to the irreversible capacity of the carbon support (78%) indicates the importance of carbon matrix.
This decrease tendency of irreversible capacity may be related to the decrease of the specific surface area of the C@Sn materials, as demonstrated by the rather linear correlation of
irreversible capacity with the specific surface area (Figure 6c). The presence of a smaller fraction of porous carbon limits the electrolyte decomposition and the solid electrolyte interphase (SEI) formation.
Figure 6. Specific discharge capacity and coulombic efficiency for the carbon
and carbon/Sn materials as a function of cycle number at constant current rates C/5 C rate in the voltage range of 0.01–1.5 V (vs. Li/Li+) (a). The
irreversible capacity after the first discharge (b). The correlation between the irreversible capacity and BET specific surface area (c) and oxygen amount in Sn/SnO2 nanoparticles as determined by XPS (d); The reversible capacity
after 2 cycles, 40 cycles and 350 cycles, respectively (e). Specific discharge capacity as a function of cycle number at variable current rates between C/10 and 3C (f).
Despite the strong decrease of irreversible capacity by decreasing the carbon fraction and the specific surface area, an important irreversible capacity is still coming from the Sn-contribution. This is often assigned to the electrolyte consumption due to the conversion reaction of SnO2 into metallic
Sn and Li2O (Eq. 1). If we represent the evolution of the
irreversible capacity versus the oxygen amount in the Sn/SnO2
particles (Figure 6d), one can be noticed that the irreversible capacity decreases with the increase of the oxygen amount in the materials, therefore, with the increase of the quantity of SnO2.
At a first glance, this result seems rather unexpected since a higher amount of SnO2 in the composites is supposed to induce
a higher irreversible capacity due to the reaction (1). However, some authors found also that the presence of SnO2 in Sn/SnO2
materials is beneficial to limit the SEI formation, to improve the CE and also to provide long term cycling stability [35],[36],[37].
Therefore, the conversion reaction is not the only factor which may affect the irreversible capacity of Sn/SnO2 materials. The
electrolyte decomposition on the surface of small and reactive Sn/SnO2 nanoparticles, with the formation of SEI layer or the
modification of the particle size/morphology during Li+ insertion
may account as well for the observed irreversible capacity
[38],[39],[35].
Concerning the reversible capacity (Figure 6e), this was also significantly improved by increasing the Sn loading from 397 mAh g-1 for 20 wt.% Sn to 871 mAh g-1 for 80 wt.% Sn,
respectively. The values are even higher than the theoretical capacities for these materials (Table S1b, Supporting Information) due probably to some synergetic effects between the Sn nanoparticles and the carbon matrix. For high loadings (60, 70 and 80 wt.%) after a drastically decrease of the capacity during the first 20 cycles (≈ 40%), stable capacities of 524, 430,
326 mAh g-1 is maintained up to 80th cycle, respectively. For
lower Sn loadings, after the first cycles, the capacity is directly extremely low (~300 mAh g-1), but not so far from the theoretical
values (285 and 340 for 20 wt.% Sn and 40% Sn respectively). Another decrease of the capacity occurs after 100 cycles for the higher loadings, which finally present almost the same capacity (≈ 300 mAh g-1) after 350 cycles (Figure 6e). The fading of
capacity for the higher loadings could be a consequence of the large amount of agglomerated particles situated outside of the carbon pores, confirmed by STEM (Figure 2). These particles were not properly in contact with the conductive carbon network and non-confined as well in corbon pores to limit their volume expansion/strain during lithiation/delithiation. STEM analysis after cycling were performed for materials with 60 and 80 wt.% of Sn to see how the Sn-based particles were affected during the cycling (Figure 7). Compared to the materials before cycling (Figure 2b, c), the STEM images at this stage indicate that the 60%Sn@C composite better conserves the particles size and dispersion (Figure 7a), while for 80%Sn@C material the agglomerated particles are more present than before cycling (Figure 7b). These post-mortem investigations confirm that a moderate amount of Sn in the porous carbon frameworks is required to balance the particle aggregation, the material conductivity and electrolyte diffusion.
The evolution of the capacity for long cycling could indicate a similar maximal electrochemical potential no matter the Sn NPs loading. Therefore, to choose the most promising material which could be used as anode, we should consider the irreversible capacity, as well as the reversible capacity but not only during the first cycles which presents the highest value for the material with 80 wt.% of Sn, but also the long-term cycling stability behavior, which seems to be influenced, especially, by the dispersion of the particles in the carbon matrix.
The coulombic efficiency of the C/Sn composite materials reaches fast 100% (after 10 cycles), which means that no parasitic reactions take place because of the electrolyte degradation is disappeared after first cycles.
Figure 7. STEM images after 350 cycles for 60%Sn@C (a) and 80%Sn@C
(b).
Figure 6f shows the cycling performances of the C/Sn-based materials at different current rates. The reversible discharge capacities of the composites strongly depend on the C rate and thus, for Sn/C composite the values decrease to 578, 466, 314, 249 and 210 mAh g-1 at C/10, C/5, C, 2C and 3C, respectively,
and successfully regain up to 90% from the initial capacity, when the current rate is set back to its initial value.
Conclusions
Mesoporous carbon/Sn-based materials with different Sn loading were prepared by a facile and fast route based on an impregnation/reduction bottom-up approach. For all loadings, a mixture of Sn/SnO2 was formed and several complementary
techniques (Mössbauer spectroscopy, XPS and TGA) were employed to carefully asses their amount and ratio in the carbon matrix to correctly evaluate their impact on the electrochemical performances. At low Sn loadings (< 60%) the Sn NPs are very homogenous dispersed in the carbon network with particle size around 5 nm and only few aggregates observed. The increase of the Sn loading induces the formation of larger Sn particles and many Sn agglomerates (~ 200 nm), which are not embedded in the carbon porosity, as reveled by XRD and TEM. Moreover, the increase of the Sn loading in the carbon framework induces a significant decrease in the textural properties (SSA and pore volume) which could be assigned partly to the Sn density but also to the confinement of Sn particles into the carbon pores. It was evidenced also that the Sn nanoparticles may present a non negligible inter-grain porosity.
The increase of the Sn loading leads to a decrease of the irreversible capacity during the first cycle, which was mainly related to the decrease of the SSA. Improvement of the reversible capacity is achieved as well; however, the evolution of the reversible capacity for long cycling demonstrated significant fading for high loadings triggered by Sn NPs placed outside the carbon pores which undergo severe agglomeration due to volume expansion upon lithiation. Therefore, similar electrochemical performances are reached regardless the Sn NPs loading after 350 cycles. Our founding suggests that a high Sn loading combined to small and dispersed particle size in the carbon framework may be the key factor to achieve high reversible capacity and long term cycling.
Experimental Section
Material synthesisThe mesoporous carbon support was prepared by a soft-template phase separation route as previously reported in our work [21],[3], involving the dissolution of phloroglucinol (the carbon
source, 1.65g) and Pluronic F-127 (pore generation agent, 3.27 g) in a solution of ethanol (81 mL) containing small quantity of hydrochloric acid (0.6 mL), followed by the glyoxal addition (1.62 mL). The latter one is used as cross-linker to form a tridimensional phenolic resin with phloroglucinol able to self-assemble with the triblockpolymer template Pluronic F-127 via H-bonding giving rise to mesophase nano-assemblies. Thermal annealing at 900°C of organic polymer phase allows to obtain the mesoporous carbon support.
The C/Sn hybrid materials with different Sn loadings (x%Sn@C, where x=20/40/60/70/80) were prepared by liquid impregnation of the porous carbon network (C) with a SnCl4∙5H2O ethanol solution under stirring for 30 min, followed
by a chemical reduction process with NaBH4 solution in water in
order to reduce the SnCl4∙5H2O to Sn (0.6g NaBH4/1g
SnCl4∙5H2O). The reducing agent was eliminated by washing the
material with distilled water at room temperature. The final material was dried at 80°C for 12h.
The crystalline structure of the materials was characterized by X-ray powder diffraction (XRD) technique, by using a powder diffractometer D8 ADVANCE A25 from Bruker in Bragg-Brentano reflection geometry θ – θ. This diffractometer is equipped with the LynxEye XE-T high resolution energy dispersive 1-D detector (Cu Kα1,2), leading to ultra-fast X-ray
diffraction measurements. The X-ray powder diffraction data uses proprietary Bruker format which are converted into usable one via PowDLL 2.71 [26]. The Sn crystallite size was determined
using the Scherrer formula and the FWHM (Full Width at Half Maximum) was extracted via DIFFRAC.EVA [27] (CuKα
2
contribution previously removed) and also checked via WinPLOTR profile fitting procedure [40]. The material surface
morphology/structure was investigated with a JEOL ARM-200F transmission electron microscope working at 200 kV. EDX mapping was obtained with a JED 2300 detector. Thermogravimetric analyses (TGA) were conducted on a TGA 851 (Mettler-Toledo) thermogravimeter by heating the samples under air (100 ml/min), from 30oC up to 900oC with a 10 oC/min
heating rate.
119Sn Mössbauer spectra were collected with a constant
acceleration spectrometer using a Ca119mSnO
3 source in the
transmission geometry. They were fit by combinations of Lorentzian lines. The absorber used for the determination of the hyperfine parameters contained 120 mg cm2 of the Sn
composite. The velocity scale is calibrated with a 57Co source
and a pure iron foil absorber. The isomer shifts are given relative to BaSnO3 standard at room temperature. The absorption areas
were further used to calculate the quantities of Sn and SnO2
loaded in the carbon/Sn hybrid materials. Lamb-Mössbauer factors of 0.5 and 0.05 have been assumed for the conversion of absorption areas for SnO2 and Sn, respectively [32]. X-ray
photoelectron spectroscopy (XPS) was performed with a VG Scienta SES 200-2 spectrometer equipped with a monochromatized Al Ka X-ray source (1486.6 eV) and a hemispherical analyzer. The pass energy was 100 eV.
The textural properties of the carbon and carbon/Sn hybrid materials were evaluated using N2 adsorption/ desorption
isotherms measured with a Micromeritics ASAP 2420 device at 77K. The samples were out-gassed in vacuum at 80oC for 12 h
before the adsorption analysis. The specific surface area (SSA) was calculated from the linear plot in the relative pressure range of 0.01-0.05. The micropore volume (Vmicro, pore size < 2 nm)
was obtained using the Dubinin-Radushkevich (DR) equation in the relative pressure interval (P/P0) from 10-4 to 10-2. The total
pore volume (VT) was determined from the amount of nitrogen
adsorbed at a relative pressure of 0.95. The mesoporous volume (Vmeso, 2nm < pore size <50 nm) was determined by
subtracting the microporous volume form the total pore volume. The pore size distributions (PSD) were determined from the adsorption branch of nitrogen isotherms using the 2D NLDFT heterogeneous surface model for carbon materials implemented in SAIEUS (Micromeritics) [41].
Electrochemical characterization
The electrode preparation was made by mixing in a jar the synthesized materials (70%) with carbon black (10%) and vapor grown carbon fibers - VGCF-S (10%) as conductive additive, and carboxymethylcellulose - CMC (10%) as binder. A quantity of 0.4 ml distillated water was added over the materials and homogeneously mixed by ball-milling for 1h. The film with a thickness of 100µm was laid down on a copper foil, dried at room temperature for 4h and at 100oC under vacuum for other
12h. The electrochemical results were calculated based on the active mass, which was considered the mass of the carbon/Sn/SnO2 composite. The corresponding loading of the
active mass in the electrode was comprised between 0.9 and 1.9 mg/cm2.
The electrochemical performances of carbon and carbon/Sn-based materials as negative electrode for Li-ion batteries were
studied in coin cells assembled in an argon filled glove box. The electrolyte used for the coin cell preparation was LiPF6 with
ethylene carbonate (EC), propylene carbonate (PC), dimethyl carbonate (DMC) (1:1:3) as solvents and vinyl carbonate (VC)(1%) and fluoro ethylene carbonate (FEC)(5%) as additives. The galvanostatic charge and discharge measurements were carried out at room temperature on Neware battery testing system (BTS3000) at room temperature. The capacity is reported per gram of C/Sn composite.
Acknowledgements
The authors gratefully acknowledge the financial support of this work from University of Haute-Alsace, France through the Ph.D. scholarship of Cristina Nita. We thank Loic Vidal and Samar Hajjar for STEM and XPS analyses performed via the IS2M Mulhouse technical platform.
Keywords: carbon/Sn hybrids; mesoporous carbon; tin-based nanoparticles; Li-ion batteries.
References
[1] J.-M. Tarascon, M. Armand, Nature 2001, 414, 359-367. [2] H. Tavassol, M. W. Cason, R. Nuzzo, A. Gewirth, Adv Mater
Lett 2011, 5, 1400317.
[3] A. Jahel, C. Matei Ghimbeu, L. Monconduit, L. Vix-Guterl,
Adv.Energ.Mater. 2014, 4, 1400025.
[4] F. Courtel, Abu-Lebdeh, in Nanotechnology for Lithium-Ion
Batteries, Springer, Boston, MA 2012, 67-83.
[5] B. Wang, B. Luo, X. Li, L. Zhi, Mater Today 2012, 15, 544-552.
[6] C. Kim, M. Noh, M. Choi, J. Cho, B. Park, Chem Mater 2005, 17, 3297-3301.
[7] G. Du, C. Zhong, P. Zhang, Z. Guo, Z. Chen, H. Liu,
Electrochem Acta 2010, 55, 2582-2586.
[8] Y. Zhong, X. Li, R. Zhang, R. Li, M. Cai, X. Sun, Appl
Surface Science 2015, 332, 192-197.
[9] X. Bai, B. Wang, H. Wang, J. Jiang, J Alloys Compd 2015, 628, 412.
[10] G. Guo, Q. Yang, J. Liang, L. Wang, Y. Zhu, Y. Qian, Mater
Lett 2016, 184, 332-335.
[11] S. Liang, X. Zhu, P. Lian, W. Yang, H. Wang, J Solid State
Chem 2011, 184, 1400-1404.
[12] B. Veeraraghavan, A. Durairajan, B. Haran, B. Popov, R. Guidotti, J Electrochem Soc 2002, 2002, 675-681.
[13] Y. Xu, Y. Zhu, Y. Liu, C. Wang, Adv Energy Mater 2013, 3, 128-133.
[14] C. Liu, H. Huang, G. Cao, F. Xue, R. Paredes Camacho, X. dong, Electrochimica Acta 2014, 144, 376-382.
[15] M. Wu, C. Wang, J. Chen, F. Wang, B. Yi, Ionics 2013, 19, 1341-1347.
[16] S. Han, J. Xu, B. Li, G. Liu, G. Song, Z. Guo, Matter Lett 2017, 199, 93-96.
[17] C. Cui, X. Liu, N. Wu, Y. Sun, Mater Lett 2015, 143, 35-37. [18] P. Wu, N. Du, H. Zhang, J. Yu, Y. Qi, D. Yang, Nanoscale
2011, 3, 746-750.
[19] I. Meschini, F. Nobili, M. Manchini, R. Marassi, R. Tossici, A. Savoini, M. Focarete, F. Croce, J Power Sources 2013, 226, 241-248.
[20] X. Liu, X. Li, J. Yu, Y. Sun, Matter Lett 2018, 223, 203-206. [21] A. Jahel, C. Matei Ghimbeu, A. Darwiche, L. Vidal, S.
Hajiar-Garreau, C. Vix-Guterl, L. Monconduit, J Mater Chem A 2015, 3, 11960-11969.
[22] Y. Wang, Z. Ma, C. Lu, Composite Interfaces 2016, 23, 273-280.
[23] J. Ren, J. Yang, A. Abouimrane, D. Wang, K. Amine, J
Power Sources 2011, 196, 8701-8705.
[24] X. Chang, T. Wang, Z. Liu, X. Zheng, J. Zheng, X. Li, Nano
[25] C. Matei Ghimbeu, C. Zlotea, R. Gadiou, F. Cuevas, E. Leroy, M. Latroche, C. Vix-Guterl, J.Mater.Chem. 2011, 21, 17765-17775.
[26] N. Kourhoumelis, ICDD Annu.Spring Meet.Ed Lisa ONeill
Powder Diffr. 2013, 28, 137-148.
[27] P. Caussin, J. Nusinovici, D. W. Beard, Adv.X-ray Anal. 1988, 31, 423-430.
[28] P. Scherrer, Gött.Nachr. 1918, 2, 98-100.
[29] C. Zlotea, Y. Oumellal, S.-J. Hwang, C. Matei-Ghimbeu, P. Jongh, M. Latroche, J Phys Chem C 2015, 119, 18091-18098.
[30] S. Sun, C. Matei Ghimbeu, Vix-Guterl-C, M.-T. Sougrati, C. Masquelier, R. Janot, J Power Sources 2015, 284, 574-581. [31] E. Sutter, F. Ivars-Barcelo, P. Sutter, Part.Part.Syst.Charact.
2014, 31, 879-885.
[32] M. Sourgati, S. Jouen, B. Hannoyer, Hyperfine Interact 2006, 167, 815-818.
[33] S. Böhme, B. Philippe, K. Edström, L. Nyholm, J Phys Chem
C 2017, 121, 4924-4936.
[34] G. Wang, B. Wang, X. Wang, J. Park, S. Dou, H. Ahnb, K. Kimb, J Mater Chem 2009, 19, 8378-8384.
[35] M. Inaba, T. Uno, A. Tasala, J Power Sources 2005, 146, 473-477.
[36] K. Chiu, H. Lin, K. Lin, J Electrochem Soc 2006, 2006, A1038-A1042.
[37] A. Sivashanmugam, T. Kumar, N. Renganathan, S. Gopukumar, Wohlfahrt-Mehrens, J. Garche, J Power
Sources 2005, 144, 197-203.
[38] R. Hu, H. Liu, M. Zeng, J. Liu, Chin Sci Bull 2012, 57, 4119-4130.
[39] S. Beattie, T. Hatchard, A. Bonakdarpour, K. Hewitt, J. Dhan,
J Electrochem Soc 2003, 150, A701-A705.
[40] T. Roisnel, J. Rodriguez-Carvajal, Materials Science Forum,
Proceedings of the Seventh European Powder Diffraction Conference (EPDIC 7) 2000, Ed. R. Delhez and E.J.
Mittenmeijer, 2000, 118-123.
Table of Contents
Understanding the Sn loading impact on the performances of mesoporous carbon/Sn based nanocomposites in Li-ion batteries
Cristina Nita [a],[b], Julien Fullenwarth [c],[d], Laure Monconduit [c],[d], Jean-Marc Le Meins [a], Julien Parmentier [a], Moulay Sougrati [c],[d],
Camélia Matei Ghimbeu [a],[d],* Page No. – Page No.
Sn loading affects the size and dispersion of Sn nanoparticles and is the key parameter to ensure long term battery cycling performances.