RADARSAT-1 SAR Scenes for Wind Power
Mapping in Coastal Area:
Gulf of St-Lawrence case
Julien Choisnard, Monique Bernier and Gaétan Lafrance
INRS-EMT, Université du Québec, 1650 boulevard Lionel-Boulet, Varennes (Québec) J3X 1S2, Canada
Abstract - Mapping of offshore wind fields is expected to receive increasing attention within the wind power community in the near future to estimate the wind power potential on coastal areas. RADARSAT-1 satellite can be used for wind resource mapping in coastal regions at a high spatial resolution if wind direction data are available. This paper presents an approach to obtain accurate wind maps from RADARSAT-1 scenes on Gulf of St-Lawrence using collocated data (in situ and QuickSCAT measurements) and hybrid model (CMOD-IFR2 with polarization ratio). We indicate the theoretical best configuration of RADARSAT-1 products for wind retrieval using hybrid model. Based on a set of six (6) SAR scenes chosen to match the most typical wind conditions, first results are discussed. Those results already indicate accurate wind estimation close to the coast. Also wind patterns over large area are available and can help to plan more accurate wind power measurements. Specific considerations of wind power mapping are reviewed and finally, future developments of the project are presented.
I. INTRODUCTION
Wind energy has known a strong increase for the last few years. Among new issues, estimating the wind site quality and developing accurate tools of wind mapping rank at the top to the agenda for the industry, especially in a large country like Canada. In coastal areas, the gulf of St-Lawrence ranks among the best sites for wind power development in Canada. But such a coastal area corresponds to a complex environment where local atmospheric and oceanic phenomena appear. While some
in situ measurements are available and precise, wind speed
estimations are usually affected by poor spatial distribution of measurement points. In addition, wind models in such complex environment are not very accurate.
In order to improve the process for further metering programs, Synthetic Aperture Radar (SAR) approaches are gaining much interest [1], especially for off-shore analysis [2] as well as in open water conditions. However few attempts are observed for complex coastal conditions where wind patterns are strongly influenced by land topography.
We focus our investigation on the Canadian satellite RADARSAT-1, a C-band SAR HH-polarized (HH-pol) that allows a wide range of beam modes covering a range of 100 x 100 km to 500 x 500 km. The geophysical model function (GMF) used to relate normalized radar cross section (NRSC), ı0
, to wind speed is evaluated under RADARSAT-1 specification of incidence angle and radiometric accuracy.
This paper discusses the best configuration of incidence angle and beam mode to use GMF for wind resource mapping over gulf of St-Lawrence. This paper also presents results based on a first sample of six RADARSAT-1 SAR scenes. Accuracy of the approach is evaluated with in situ data
especially for offshore areas. Finally, we discuss future steps of the project as well how SAR wind map can be useful for the wind industry.
II. DATA AND REGION OF INTEREST
Canadian Space Agency (CSA) provided us six RADARSAT-1 SAR scenes in agreement with the “Data for Research Use” program. Data are selected in ascendant orbit that allows to align the Gaspesian coast with look direction and so limits problems with “Automatic Gain Control” (AGC) over water. Moreover, algorithm of correction of radiometric saturation [3] was applied by the Canadian Data Processing Facility (CDPF).
For many purposes as weather forecasts, Environment Canada (EC) has developed local wind measurements for a long time in the Gulf of St-Lawrence. There are three collocated data sources: coastal wind speed data measured at 10 meters (provided by EC, up to 2.5 km from the coast); one buoy provides wind speed at 5 meters from the sea and scatterometer QuickSCAT wind measurements on a 25 km grid. While time step collocation for SAR scenes as well as for buoy data is up to twenty minutes, the QuickSCAT collocation measurement ranges between ten and forty minutes. Collocated data available at acquisition time of each SAR scenes are listed in table 1.
TABLE I
DATA SET AND COLLOCATED INFORMATION SAR scene Beam Date Gain set Collocated data Standard (SGF) S2 28-11-96 AGC Coastal (2)
Wide (SGF) W1 06-06-02 AGC Coastal (4), one buoy, QuickSCAT (6) W2 16-06-02 AGC Coastal (4), one buoy,
QuickSCAT (7) ScanSAR (SCN) SNA 21-10-02 fixed (16) Coastal (9), one buoy,
QuickSCAT (8) SNA 28-10-02 fixed (16) Coastal (6), one buoy,
QuickSCAT (17) SNA 21-11-02 AGC Coastal (5), one buoy,
QuickSCAT (18)
0-7803-7930-6/$17.00 (C) 2003 IEEE
III. WIND RETRIEVAL METHOD
For retrieving wind speeds from SAR data, we chose GMF commonly used for ERS-1/2 data: the CMOD-IFR2 model [4]. The NRSC in VV-pol. with wind speed at 10 meters above sea level, in neutral condition (U), angle between wind direction and look (ij) and incidence angle (ș), is expressed as:
ı0VV(U,ij,ș)=A0(ș)UȖ(ș)[1+A1(ș)cos(ij)+A2(ș)cos(2ij)] (1) where A0, A1, A2 and Ȗ are function of incidence angle.
Since no similar well established model exists for HH-pol, we use a hybrid model with a polarisation ratio (PR) and (1) to link ı0
HH to wind, defined as ı0HH(U,ij,ș)= ı0VV(U,ij,ș)*PR(ș).
(2) The Kirchhoff PR limits the model, but this parameter still is the best choice for RADARSAT products processed by CDPF [4].
Before inverting (2), we have to calibrate RADARSAT-1 products and used a wind direction value at each pixel. We have used a spatially interpolated wind direction field built from all collocated data available. Our irregularly spaced wind direction points (from in situ, buoy and QuickSCAT data) are
interpolated by biharmonic spline technique.
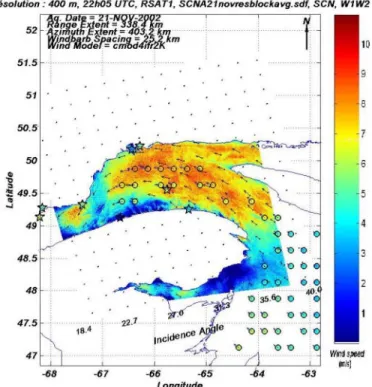
To limit speckle effects on NRSC value of sea surface, spatial resolution is degraded to 400 meters by spatial averaging. Land mask is manually created to avoid radiometric pollution by shoreline pixel. Fig. 1 is an example of RADARSAT SAR derived wind map. Spatial variability of wind field due to topographical effect in coastal area is visible.
IV. ESTIMATED RADARSAT-1 ERROR SOURCE
When we extract wind speed from RADARSAT data, the accuracy is strongly linked on the input of the model. Then, error sources can be classified in three types: radiometric error (in dB) from calibration, speckle, oceanic and atmospheric effects; direction error (wind or look direction) and incidence angle error.
Radiometric accuracy of RADARSAT is known to be around +/-0.5dB for single beam and around +/-1dB for ScanSAR images with respectively +/-1dB and +/-1.5dB in worst case [5]. Also, it appears that accuracy is slightly worst at edge angle. Moreover, speckle could affect radiometric accuracy even if we use an average value in a 400 meters pixel (average of respectively 256 and 1024 pixels on ScanSAR and single beam). Besides radiometric accuracy, we must consider other atmospheric or oceanic effect as air/sea temperature, ocean current, water surface movement and bathymetry that can disturb radiometric level of a pure Bragg backscattering. Wind direction is probably the most important error source in the wind process scheme. Horstmann [6] found a largest relative error in wind speed near wind direction of 45 and 135º (and near 225 and 315º due to symmetry of (1)) assuming an uncertainty in wind direction of +/-10º and a upwind position fixed at 0º. Incidence angle incertitude is expected to be low due to high precision on geometric methodology used in
Figure 1: RADARSAT SAR derived wind map at 400 meters resolution. Stars represent in situ wind speeds and circle QuickSCAT wind measurements.
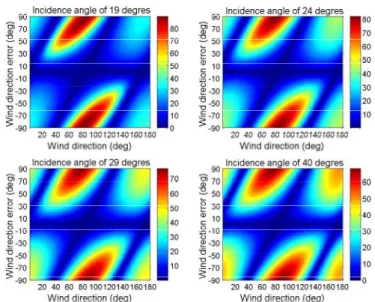
Black arrows are wind direction field spatially interpolated. algorithms. Relative error in wind speed is plotted in Fig. 2 for three wind directions (upwind, crosswind, intermediate at respectively 80º, 170º and 40º according to RADARSAT geometry in ascendant orbit) assuming a wind speed from 2 to 25 m/s and incidence angle from 19 to 40º. Firstly, incidence angle trend on wind retrieval accuracy is roughly the same for any situation, but larger errors occur for angle below 25º. Radiometric uncertainty of +/-0.5dB could have stronger effect for low wind. Secondly, larger errors due to wind direction uncertainty appear not always at same direction. As showed in Fig. 3, variable uncertainty from 0 to +/-90º is tested for 4 incidence angles assuming a constant wind speed (12 m/s) and a wind direction from 0º to 180º. Location of largest error move from 40º to 60º for increasing wind direction uncertainty from +/-10º to +/-50º. This slide is due to sinusoidal terms of (1). A 40 % error could occur when wind direction uncertainty is around +/-30º. For a huge uncertainty of +/-90º, errors increases strongly and occur for up/downwind and crosswind directions.
V. COMPARISON OF WIND SPEEDS
For evaluation of offshore wind map accuracy, we have considered 56 collocated QuickSCAT measurements on 25 x 25 km SAR cell and 5 buoy measurements on 2 x 2 km. For coastal wind accuracy we have used 22 EC coastal measurements stations and averaged value in a square cell around station locations. With QuickSCAT values, correlation for wind speed is 0.87 with a bias of 0.05 m/s and a RMS error of 1.30 m/s. For coastal wind speed, correlation is 0.69 with a bias of 0.25 m/s and a RMS error of 2.13 m/s. For the buoy point, the 0.96 correlation is very good, but limited by the low
0-7803-7930-6/$17.00 (C) 2003 IEEE
Figure 2: Simulated relative error (%) on wind speed due to +/-0.5dB uncertainty in ı0
HH (top), 10º uncertainty in wind direction (middle) and +/-0.1º uncertainty in incidence angle (bottom) for three wind direction (40º, 80º and 170º). Wind speed is from 2 to 25 m/s and incidence angle from 19 to 40º. sample (5 data) and a bias of 1.26 and a RMS error of 1.46 m/s. In this case, our interpolated speed from 5 m to 10 m seems to underestimate wind speed. In Fig. 4 winds from QuickSCAT and ground measurements are plotted versus SAR winds. The main differences in wind speed occur for coastal data where wind field is strongly affected by local topography. Land wind and SAR nearest wind value are different but close enough to be confident in SAR coastal capabilities.
VI. CONCLUSIONS
Hybrid model composed by CMOD-IFR2 algorithm and the Kirchhoff’s PR is strongly affected by input data accuracy in near range (from 19º to 25º) of RADARSAT scenes. Wind direction precision is one of the main variable to estimate accurate wind speed. Those effects imply: 1) to use RADARSAT scenes with preferred incidence angle between 25º and 35º and 2) to carefully evaluate wind direction field. Processing scheme of SAR scenes using interpolated wind direction field with both in situ and QuickSCAT wind direction
measurements can give accurate wind map near to the coast. So, SAR wind maps on St-Lawrence gulf allow showing distinct wind pattern and strong spatial differences.
In order to improve the approach, we plan to process 20 other RADARSAT scenes for more common wind conditions in term of wind direction, stability and speed. Such a sample of RADARSAT scenes should help to study spatial wind variability and to find best wind potential in gulf of St-Lawrence. Future step is a better interpretation of stability effect on vertical wind profile which is of strong interest for interpretation of retrieved neutral wind speed. Finally, some adjustments in PR would be useful with a bigger set of data to improve coastal wind speed accuracy.
Figure 3: Simulated relative error (%) on wind speed due to an uncertainty in wind direction from -90º to +90º for incidence angle of 19, 24, 29 and 40º.
Wind speed is fixed at 12 m/s and wind direction from 0 to 180º. ACKNOWLEDGMENT
We thank Dr. Paris Vachon and John Wolfe of Canadian Centre of Remote Sensing that provided algorithms and advices to analyse SAR scenes. The RADARSAT-1 SAR scenes were made available by the DRU program of Canadian Space Agency.
R
EFERENCES1. Johannessen, O.M., H. Espedal, and E. Bjorgo. "Wind energy mapping from synthetic aperture radar," in IGARSS, Hamburg, Germany, 1999.
2. Hasager, C.B., H.P. Frank, and B.R. Furevik, "On offshore wind energy mapping using satellite SAR," Can. J. of Remote Sens., 2002, vol. 28, (1),
pp. 80-89.
3. Vachon, P.W., and al. "Adaptive Compensation of RADARSAT SAR Analoque-to-Digital Converter Saturation Power Loss," in Int. Symp., Geomatics in the Era of RADARSAT (GER'97), Ottawa, Canada, 1997.
4. Vachon, P.W. and F.W. Dobson, "Wind retrieval from RADARSAT SAR images: selection of a suitable C-band HH polarization wind retrieval model," Can. J. of Remote Sens., 2000, vol. 26, (4), pp. 306-313.
5. Luscombe, A., "ADC saturation correction on RADARSATT-1 image," p. communication, 2003.
6. Horstmann, J., and al., "Wind retrieval over ocean using symthetic aperture radar with C-band HH polarization," IEEE Trans. on Geosc. and Remote Sens., 2000, vol. 38, (5), pp. 2122-2131. 0 2 4 6 8 10 12 14 16 18 0 2 46 8 10 12 1416 18 U_QuickSCAT (m/s) U_SA R ( m /s ) Corrélation = 0..87 Biais = 0.05m/s RMSE = 1.30 m/s 0 2 4 6 8 10 12 14 16 18 0 2 46 8 10 12 1416 18 U_insitu (m/s) U_SA R ( m /s ) Corrélation = 0,69 Biais = 0,25 m/s RMSE = 2,13 m/s
Figure 4: RADARSAT SAR derived wind speed and comparisons with QuickSCAT speed (left side) and coastal measurements (right side). Dashed
line is 1:1 relation and continued line is linear regression.
0-7803-7930-6/$17.00 (C) 2003 IEEE