Assessing groundwater-surface water interaction and groundwater discharge in a contaminated site in an industrial, sub-urbanized area
8
0
0
Texte intégral
(2) 2. J. Batlle-Aguilar & S. Brouyère. value approximately equal to 0.1%. The gravel alluvial aquifer, located at 8 m depth from the soil surface, is heavily contaminated by inorganic (mainly sulphates and heavy metals) and organic pollutants (mainly BTEX and PAHs) due to past industrial activities. There is still no evidence of pollutants next to the transition zone between the river and the brownfield. The major objective of the present investigation was to 1) evaluate whether an interaction exists, at the level of the mentioned brownfield, between groundwater and surface water; 2) to assess the dynamics of such interactions and to quantify groundwater fluxes as the main potential vector of mobility of contaminants offsite; and 3) to give first pieces of answers on the fact that, despite important sources of BTEX (in particular benzene) have been clearly delineated in the contaminated site, these products have never been observed in groundwater downstream from the sources, in the direction of the Meuse River.. DESCRIPTION OF FIELD EXPERIMENTS AND MONITORING Because the surroundings of the study site are highly urbanized, direct characterization of the river bank is difficult, so the dynamics and exchanges between GW - SW had to be studied indirectly, based on the one hand on a continuous monitoring of water levels in the Meuse river and at different locations in the gravel aquifer, on the other hand using single-well tracer tests. These experiments are described here after. Groundwater-surface water monitoring From September 2005 to May 2007, continuous monitoring of groundwater levels (GWL) was performed in 16 piezometers located at distances ranging from 26 to 224 m from the Meuse River (Fig. 1). Four wells were monitored for a long period (i.e. P3, U5, U8 and U3), while the others were monitored for a more limited period of one month. Groundwater monitoring was performed using LevelTroll® probes at a frequency of 1 measurement/hour.. GQ07: Securing Groundwater Quality in Urban and Industrial Environments.
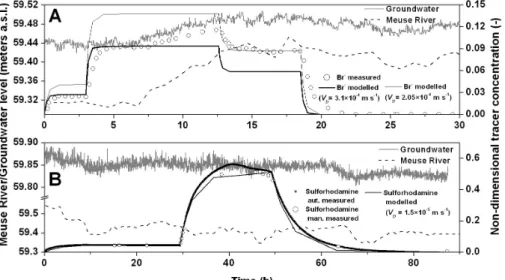
(3) Assessing groundwater-surface water interaction and discharge in an industrial area. 3. Fig. 1 Location of piezometers monitored in the site (A-A’: schematic cross section, see Figure 4).. Meuse River data (discharge, temperature and water level) were obtained from a hydroelectric plant located in the opposite river bank in front of the site. Single well tracer tests A new and original single well tracer technique, the FVPDM (Finite Volume Point Dilution Method), designed by Brouyère (2003) and recently developed by Brouyère et al. (2007), was applied to evaluate groundwater fluxes as close as possible to the GWSW interface. The FVPDM generalizes the Point Dilution Method (Havely et al., 1967). It allows estimating Darcy fluxes locally, at the injection point for any type of tracer experiment. It is based on monitoring the dilution of a tracer injected continuously, at a very low rate, in the tested observation well. The advantage over the PDM is that the FVPDM allows for an easier experimental setup and it can be used for monitoring variations with time of the Darcy fluxes. Mathematical developments and exemplifying applications of the FVPDM in the field are described in details in Brouyère et al. (2007). In the present case study, FVPDM experiments were carried out between July – September 2006 in four wells (P1, P3, P4 andU15), providing estimates of Darcy fluxes between 2.05×10⁻⁴ and 3.0×10⁻⁶ m s-1. Fig. 2 presents the calculated evolutions of tracer concentrations fitted to monitored ones in wells U15 and P3, located at 31 and 26 meters of the Meuse River respectively.. Fig. 2 Comparison between concentration evolution monitored and modelled (VD is the Darcy’s flux) and representation of the Meuse River level and GWL. (A) Well U15; (B) well P3.. The calculated evolutions of tracer concentration are very close to the measured ones. For the experiment performed in well U15 (Fig. 2A), the strong deviation of concentration observed during the second injection step, at around 7.5 hours after injection is explained by a rise of about 10 cm of the Meuse water level during the experiment. The rise of the Meuse River water level has reduced the groundwater GQ07: Securing Groundwater Quality in Urban and Industrial Environments.
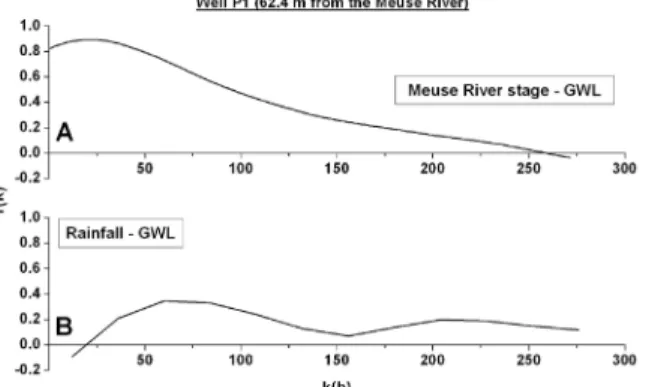
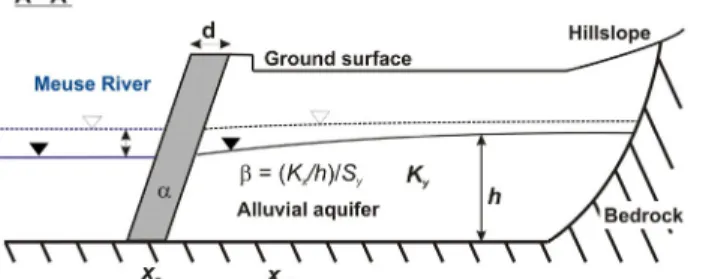
(4) 4. J. Batlle-Aguilar & S. Brouyère. gradient and thus Darcy fluxes in the gravel aquifer near the river bank (from 3.1×10⁻⁴ to 2.05×10⁻⁴ m s-1), with the consequence on the FVPDM experiment that the tracer dilution was reduced.. ANALYSIS AND MODELLING OF GW – SW DYNAMICS Cross-correlation analysis of GW – SW levels In order to determine the factors governing the dynamics of groundwater levels, a cross-correlation analysis was performed between Meuse River levels, groundwater levels and rainfall datasets. River stages and rainfall were considered as inputs of the system, while groundwater heads were used as outputs. To do so, the BRGM TEMPO® software (Pinault, 2001), designed to treat and to model hydrological and time series, was used. Fig. 3 shows cross-correlation functions between Meuse River stage and rainfall with GWL respectively. This analysis allows one to conclude that the correlation degree is much higher between river stages and GWL (r = 80%) than between rainfall and GWL (r = 20%), so that the dynamics of groundwater levels in the site are mainly controlled by river stage variations rather than by rainfall variability.. Fig. 3 Cross-correlation functions of (A) Meuse River stage and GWL and (B) rainfall and GWL (r(k): correlation degree; k(h): time lag in hours).. Analytical modelling of GW – SW interactions The spread of contaminants from the river into the aquifer, or from the aquifer into the river is a problem intimately related to the hydraulics of the aquifer-river system. Groundwater levels in alluvial aquifer fluctuate with surface water levels of the neighbouring river. These fluctuations are essentially produced as a wave propagated into the aquifer (Sophocleous, 1991). The distance of influence in the aquifer of river stages is mainly dependant on the transmissivity and porosity of the aquifer and the magnitude of river stage variations (Workman et al., 1997). Using the monitored time series of water levels in the river and in the aquifer, a computer program, STWT1 (Barlow and Moench, 1998), was used to evaluate the hydrodynamic properties of the gravel aquifer and the aquifer-river interface and to estimate the water flow rates effects of river-stage fluctuations to the adjacent aquifer. The conceptual model of the system is presented in Fig. 4. Kx is the horizontal hydraulic conductivity of the aquifer [L T-1]; Ky is the ratio of vertical to horizontal GQ07: Securing Groundwater Quality in Urban and Industrial Environments.
(5) 5. Assessing groundwater-surface water interaction and discharge in an industrial area. hydraulic conductivity of aquifer [-]; h is the saturated thickness of the aquifer [L]; xo is the distance from the middle of the river to the river-aquifer boundary [L]; Sy is the storage coefficient [-]; d is the width of the semipervious riverbank material [L]; R is the recharge to the aquifer [L T-1]; and β is the diffusivity of the aquifer (i.e. ratio of transmissivity to storage coefficient) [L2 T-1]. The groundwater flux that crosses the riverbank material is controlled by the riverbank leakance parameter α [L]. It accounts for the resistance due to riverbank material to flow (Barlow et al., 2000) and it is defined as follows:. α = ( K xd ) / Ks. (1). where Ks is the hydraulic conductivity of the semipervious riverbank material [L T-1].. Fig. 4 Conceptual model of the analytical groundwater-surface water system modelled. Not at scale.. Modelled groundwater heads are adjusted to the measured ones by playing on the hydraulic conductivity of the semipervious riverbank material Ks (equation 1) for water height and on the diffusivity α for amplitude adjustment (distance of influence in the aquifer of river stages). The aquifer was modelled as a finite-width water-table with semipervious riverbank material and the river was considered as penetrating the full thickness of the aquifer. The STWT1 programme solves an analytical solution that uses a convolution relation to calculate changes in groundwater levels in observation wells and the seepage rate and bank storage at the river-aquifer boundary. The convolution integral in a general form is: t. So = ∫ Si (τ ) Y ( t − τ ) dτ. (2). 0. where So is the system output at time t, Si the system input, Y is the system response function, t the time and τ is the time variable of integration. Convolution integrals for groundwater heads h(x,z,t) (equation 3) and time-varying riverbank seepage rates (equation 4), as solved by the program STWT1, are: t. h ( x, z , t ) = hi + ∫ F ' (τ ) hD ( x, z , t − τ ) dτ. (3). ∂h ( x , z , t − τ ) Kb Q ( t ) = x ∫ F ' (τ ) D o dτ xo 0 ∂xD. (4). 0. t. GQ07: Securing Groundwater Quality in Urban and Industrial Environments.
(6) 6. J. Batlle-Aguilar & S. Brouyère. where hD(x,z,t) is the dimensionless step-response function; F’(τ) is the time rate of change of the system stress; Q(t) is seepage rate per unit length of river from (or to) one side of the river [L3 T-1]; and xD is the dimensionless distance x/xo. Hydraulic properties of the aquifer and riverbank and calibration parameters are summarized in Table 1. Table 1 Summary of hydraulic properties of the aquifer and riverbank and calibration parameters. Hydraulic properties Calibration parameters P3 U17 P3 U17 h (m) 8 h (m) 8 Kx (m s-1) 9.4×10⁻⁴ Kx (m s-1) 1.6×10⁻³ -2 d (m) 3 d (m) 3 Ky (-) 1.0×10 Ky (-) 8.0×10⁻⁴ -1 -5 -1 xo (m) 96.1 xo (m) 108.7 Ks (m s ) 1.91×10 Ks (m s ) 1.2×10⁻⁴ -1 -1 R (mm h ) 0.016 R (mm h ) 0.068 Sy (-) 0.04 Sy (-) 0.06. Figure 5 allows comparison of measured and modelled groundwater levels for wells U17 and P3, located at 38.7 and 26.1 m from the river and at extreme sides of the site.. Fig. 5 Groundwater head measured and modelled in the observation well U17 (A); corresponding seepage rate (m3 h-1 m river reach) between the Meuse River and the aquifer (B); corresponding cumulative seepage (m3 m river reach) during the modelled period (C); groundwater head measured and modelled in the observation well P3 (D); corresponding seepage rate (m3 h-1 m river reach) between the Meuse River and the aquifer (E); corresponding cumulative seepage (m3 m river reach) during the modelled period (F).. Seepage flow rates, as calculated by the analytical solution highlights the gaining character of the river in normal conditions (water level of the Meuse River at 59.5 GQ07: Securing Groundwater Quality in Urban and Industrial Environments.
(7) Assessing groundwater-surface water interaction and discharge in an industrial area. 7. meters a.s.l.), while it becomes a losing river when its level rises of some centimetres (Fig. 5B). DISCUSSION OF RESULTS. During the period of monitoring in well P3 presented in Fig. 5D, a FVPDM experiment was carried out in well P4. The Darcy fluxes as estimated from this experiment were equal to 2.7×10⁻⁵ m s-1, which is two orders of magnitude higher than the estimation obtained using the analytical solution, which is around 1.2×10⁻⁷ m s-1. Using Darcy’s law and an average value of Kx equal to 1×10⁻⁴ m s-1, estimated using pumping test results, the estimated Darcy flux is 2.3×10⁻⁷ m s-1, closer to that obtained using the analytical model. Different reasons can probably explain such differences. First, the FVPDM provides a point estimate of Darcy fluxes, with limited integration of aquifer heterogeneity around the tested well and with a possible influence of flow field distortion in the vicinity of the injection well bore (Brouyère, 2003). Secondly, wells P3 and P4 are distant of about 40 m and lateral aquifer heterogeneity can probably explain the differences in Darcy fluxes over that distance. But above all, the analytical solution is affected by an undetermination. Multiplying the applied recharge and the hydraulic conductivity terms of the model by a same factor leads to the calculated groundwater levels, but a transiting groundwater flux that is multiplied by that factor. The combined monitoring of water levels and the analytical solution provides a very efficient, easy to deploy in the field, way of quantifying groundwater fluxes and GW – SW dynamics. However, even if the orders of magnitude of the different coefficients introduced in the analytical model are consistent with measurements and observations in the field (Table 1), it is possible that Darcy fluxes are higher, on the order of those obtained using the FVPDM. Further investigations are on the way, using a numerical model, in order to diminish the uncertainty in groundwater flux quantification resulting from this combined analysis.. CONCLUSIONS AND PERSPECTIVES. Based on field experiments and monitoring, the analysis performed in the studied brownfield confirms that there is a relationship between groundwater and the neighbouring river, with groundwater levels being strongly correlated with variations in surface water levels. The various estimates of Darcy fluxes (analytical modelling and application of Darcy’s law, FVPDM) range between 2.3×10⁻⁷ and 2.7×10⁻⁵ m s-1. This can be related to the scale at which the different estimates apply, from very local for the FVPDM to site scale for the two others. The analytical model potentially provides very useful information on GW – SW interaction dynamics and quantification of groundwater fluxes exchanged between the aquifer and the adjacent river, but it is an undetermined on groundwater fluxes. From this point of view, the FVPDM technique is a reliable candidate to restrain groundwater flux evolution calculated with the analytical solution and it is likely that a combined FVPDM – water level monitoring approach is a more reliable solution for the quantification of GW – SW GQ07: Securing Groundwater Quality in Urban and Industrial Environments.
(8) 8. J. Batlle-Aguilar & S. Brouyère. exchanges. The results of the analytical model indicate that under normal conditions seepage is from the aquifer to the river. However, because the Meuse River water levels vary continuously, there are frequent changes from gaining to losing conditions. In particular, there are periods during which surface water penetrates in the alluvial aquifer. This surface water flux is likely to be a source of oxygen contributing to the degradation of BTEX (Atteia and Guillot, 2007). This might be an explanation for the fact that BTEX compounds have never been monitored downstream from the sources of contamination. Complementary investigations and numerical modelling are on the way in order to evaluate the evolution of dissolved oxygen with the dynamics of GW – SW interactions at the border of the site and to confirm or not the proposed hypothesis for the degradation of BTEX. Acknowledgements This work was supported by the European FP6 Integrated Project AquaTerra (Project no. 505428) under the thematic priority, sustainable development, global change and ecosystems. Authors had benefit of research funds from Aquapôle ULg. Thanks to the SPAQuE, especially H. Halen and A. Lox, for access to data and to the brownfield site. Grateful acknowledgement is made for P. Theunissen (SPE-TGV) for his gracious contribution on Meuse River data time series. Thanks are due to Dr. Paul Barlow (USGS) for his comments.. REFERENCES Atteia, O. & Guillot, C. (2007) Factors controlling BTEX and chlorinated solvents plume length under natural attenuation conditions. J. Contam. Hydrol. 90, 81-104.. Barlow, P. M., DeSimone, L. A. & Moench, A. F. (2000) Aquifer response to stream-stage and recharge variations. II. Convolution method and applications. J. Hydrol. 230, 211-229. Barlow, P. M. & Moench, A. F. (1998) Analytical solutions and computer programs for hydraulic interactions of stream-aquifer systems. US Geol. Survey Open File Report 98-415A. 99 pp. Brouyère, S. (2003) Modeling tracer injection and well-aquifer interactions: a new mathematical and numerical approach. Water Resour. Res. 39(3), doi:10.1029/2002WR001813. Brouyère, S., Batlle-Aguilar, J., Goderniaux, P. & Dassargues, A. (2007) A new tracer technique for monitoring groundwater fluxes: the Finite Volume Point Dilution Method. J. Contam. Hydrol.: doi 10.1016/j.jconhyd.2007.09.001. Havely, E., Moser, H., Zellhofer, O. & Zuber, E. (1967) Borehole dilution techniques: a critical review. In Isotopes in Hydrology, I.A.E.A., Vienna, Austria, 531-564 pp. Pinault, J.-L. (2001) Manuel utilisateur de TEMPO. Logiciel de traitement et de modélisation des séries temporelles en hydrogéologie et en hydrogéochimie (In French). RP-51459-FR. 233 pp. Sophocleous, M. A. (1991) Stream-floodwave propagation through the Great Bend alluvial aquifer, Kansas: field measurements and numerical simulations. J. Hydrol. 124, 207-228. Workman, S. R., Serrano, S. E. & Liberty, K. (1997) Development and application of an analytical model of stream/aquifer interaction. J. Hydrol. 200, 149-163.. GQ07: Securing Groundwater Quality in Urban and Industrial Environments.
(9)
Figure

Documents relatifs
This is why we have not attempted to define a notion of (j, χ)-special variety; the naive approach does not seem to produce a correct definition.. and it is not immediately
commercial weight loss group, insofar as its explicit aim is to make members lose weight, is a genuine ‘people changing institution’, or more specifically a people thinning
The pressure sensor was developed to be used along with Optical Coherence Tomography (OCT) apparatus to measure the spatial pressure distribution at the
Car une analyse est toujours le résultat d’un ensemble de choix musicologiques, de l’usage de certaines technologies (ou non) et du choix d’un public visé. Nous
L’archive ouverte pluridisciplinaire HAL, est destinée au dépôt et à la diffusion de documents scientifiques de niveau recherche, publiés ou non, émanant des
fiques des colloques suivants : Association pour le développement des méthodologies d’évaluation en éducation en Europe (Lisbonne, janvier 2016) ; Association internationale
Les méthodes employées (dilatation, squelette, points nodaux entre autres) avec le logiciel dédié Micro Morph apportent différentes informations sur le nombre de nœuds,
لوالأ لصفلا تيبشاحلما ثامولعلما ماظىل ماعلا راطالإ مكر لكشلا ( 2 :) تيبشاحلما تمولعلما صئاصخ ردصلما دبك ىلك ادامخكا نيخبلاؼلا دادكإ ًم :
