C. Grelet1, J.A. Fernández Pierna1, P.Dardenne1, X. Massart2, F. Dehareng1
1 Walloon Agricultural Research Center (CRA-W), 24 Chaussée de Namur, 5030 Gembloux, Belgium ; [email protected] 2 European Milk Recording eeig, Rue des champs Elysées 4, 5590 Ciney, Belgium
Application of a standardisation procedure on an
international network of MIR instruments for milk analysis
Context and objectives
Results and discussion
Conclusion
Standardisation allows to reduce the spectral variations between instruments of the network Possibility to build common equations and use them on all MIR instruments
Walloon Agricultural Researchs Centers
Valorisation of agricultural products department
www.cra.wallonie.be
MIR equations are increasingly used in the dairy sector to obtain quick and cheap indications on milk quality or cow status (fatty acids and minerals profiles, technological properties, methane emitted by day, health of the cow…).
Due to the existing differences between each MIR instrument, there is a need of spectral standardisation to merge spectra into common database in order to create robust equations, and to be able transferring these equations on several instruments.
Montlhy an identical set of 5 milks is sent to the 83 instruments of the network, into 31 labs equipped with Delta, Bentley and Foss MIR machines.
Procedure
Using the spectra of the common milks analyzed, the instruments (the slaves) are mathematically matched on a reference instrument (the master) using Piecewise Direct Standardisation method (Grelet et al., 2015). PDS is based on the fact that response of the master at the wavenumber r1 is
highly correlated to the response in windows R2 on the slave
instrument.
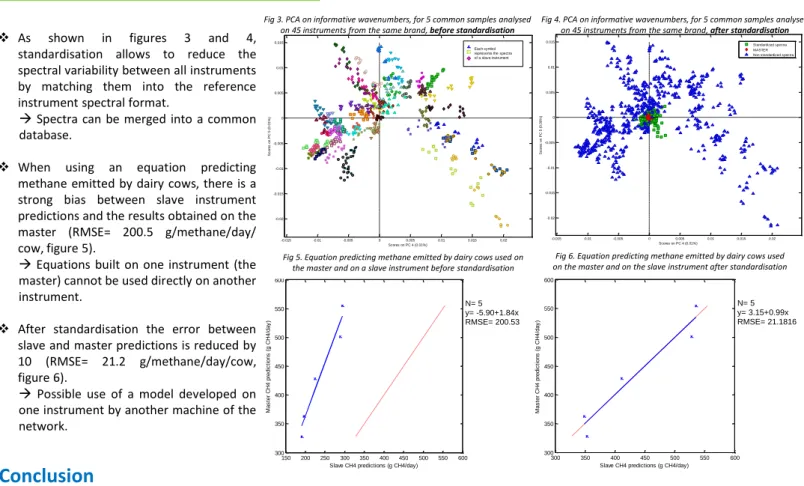
As shown in figures 3 and 4, standardisation allows to reduce the spectral variability between all instruments by matching them into the reference instrument spectral format.
Spectra can be merged into a common database.
When using an equation predicting methane emitted by dairy cows, there is a strong bias between slave instrument predictions and the results obtained on the master (RMSE= 200.5 g/methane/day/ cow, figure 5).
Equations built on one instrument (the master) cannot be used directly on another instrument.
After standardisation the error between slave and master predictions is reduced by 10 (RMSE= 21.2 g/methane/day/cow, figure 6).
Possible use of a model developed on one instrument by another machine of the network.
Use of an equation predicting methane emitted by dairy cows built in the master format (Vanlierde et al., 2015) to validate the method.
Fig 3. PCA on informative wavenumbers, for 5 common samples analysed on 45 instruments from the same brand, before standardisation
Master (FT6000) Slave r1j = R2j bj + b0j Wavenumber r1 Correlated to R2 Fig 2. Principle of PDS method
N= 5 y= 3.15+0.99x RMSE= 21.1816 300 350 400 450 500 550 600 300 350 400 450 500 550 600 CH4 Master vs. CH4 Slave
Slave CH4 predictions (g CH4/day)
M a s te r C H 4 p re d ic ti o n s ( g C H 4 /d a y ) N= 5 y= -5.90+1.84x RMSE= 200.53 150 200 250 300 350 400 450 500 550 600 300 350 400 450 500 550 600 CH4 Master vs. CH4 Slave
Slave CH4 predictions (g CH4/day)
M a s te r C H 4 p re d ic ti o n s ( g C H 4 /d a y )
Fig 5. Equation predicting methane emitted by dairy cows used on the master and on a slave instrument before standardisation
Fig 6. Equation predicting methane emitted by dairy cows used on the master and on the slave instrument after standardisation Fig 4. PCA on informative wavenumbers, for 5 common samples analysed
on 45 instruments from the same brand, after standardisation Fig 1. Milk labs participating to the standardisation
-0.015 -0.01 -0.005 0 0.005 0.01 0.015 0.02 -0.02 -0.015 -0.01 -0.005 0 0.005 0.01 0.015 Scores on PC 4 (0.01%) S c o re s o n P C 5 ( 0 .0 1 % ) Samples/Scores Plot of X212 -0.015 -0.01 -0.005 0 0.005 0.01 0.015 0.02 -0.02 -0.015 -0.01 -0.005 0 0.005 0.01 0.015 Scores on PC 4 (0.01%) S c o re s o n P C 5 ( 0 .0 0 % ) Samples/Scores Plot of X212 Standardized spectra MASTER Non standardized spectra
Each symbol represents the spectra of a slave instrument
Grelet et al., 2015. Standardization of milk mid-infrared spectra from a European dairy network. J. Dairy Sci. 98:2150–60.
Vanlierde et al., 2015. Innovative lactation-stage-dependent prediction of methane emissions from milk mid-infrared spectra. J. Dairy Sci. 98:5740–5747.