HAL Id: hal-01407640
https://hal.archives-ouvertes.fr/hal-01407640
Submitted on 2 Dec 2016
HAL is a multi-disciplinary open access
archive for the deposit and dissemination of sci-entific research documents, whether they are pub-lished or not. The documents may come from teaching and research institutions in France or abroad, or from public or private research centers.
L’archive ouverte pluridisciplinaire HAL, est destinée au dépôt et à la diffusion de documents scientifiques de niveau recherche, publiés ou non, émanant des établissements d’enseignement et de recherche français ou étrangers, des laboratoires publics ou privés.
Survey and analysis of DNS infrastructures
Guillaume Bonnoron, Damien Crémilleux, Sravani Teja Bulusu, Xiaoyang
Zhu, Guillaume Valadon
To cite this version:
Guillaume Bonnoron, Damien Crémilleux, Sravani Teja Bulusu, Xiaoyang Zhu, Guillaume Valadon. Survey and analysis of DNS infrastructures. [Research Report] CNRS. 2016. �hal-01407640�
Survey and analysis of DNS infrastructures
Authors
Guillaume Bonnoron
Damien Cr´
emilleux
Sravani Teja Bulusu
Xiaoyang Zhu
Supervisor
Guillaume Valadon
Contents
1 Introduction 5 1.1 REDOCS . . . 5 1.2 Objective . . . 5 1.3 Outline . . . 6 2 Context 7 2.1 DNS protocol . . . 72.2 RIPE Atlas project . . . 7
3 Methodology 9 3.1 Probe side . . . 9
3.2 Server side . . . 9
3.3 Retrieving the results . . . 11
4 Analysis 13 4.1 Global view . . . 13
4.2 Probes . . . 14
4.2.1 Probes around the world . . . 14
4.2.2 Queries per probe . . . 14
4.3 Probe DNS resolvers . . . 16
4.4 DNS caches . . . 16
4.4.1 Query replication . . . 18
4.4.2 Several layers of caches . . . 18
4.5 Separation between AS . . . 20
4.5.1 Probe resolver and DNS cache in different AS . . . 20
4.5.2 Probe and probe resolver in different AS . . . 20
4.6 TTL modification . . . 20
5 Focus on two AS 23 5.1 Google . . . 23
5.2 Orange . . . 23
6 Conclusion and future work 27
Chapter 1
Introduction
1.1
REDOCS
The work pusblished in this report has been accomplished during REDOCS 20161. REDOCS stands for Rencontres Entreprises DOCtorants S´ecurit´e. It is a French event, where PhD students are working together during one week to solve real life problems given by companies. This year, one of these companies was the Agence nationale de la s´ecurit´e des syst`emes d’information (ANSSI)2.
One of the mission of the ANSSI is to improve knowledge of the French Internet by studying the technologies critical to its proper functioning, with the French Internet Resilience Observatory3.
The DNS4 protocol is essential for the Internet, and one of the metrics studied by the French Internet Resilience Observatory. Having a map of the DNS infrastructure of web providers and ISPs5 is crucial. So the ANSSI suggested a study of the DNS infrastructure.
Figure 1.1: Logo of the ANSSI
1.2
Objective
The objective of this project is to discover the DNS infrastructure built by the different Internet actors. More specifically, the following points are interesting:
• the number of DNS caches, inbounds and outbounds; 1http://confiance-numerique.clermont-universite.fr/redocs2016/ 2
English: National Cybersecurity Agency of France, the French national authority for the defence and the security of information systems, http://www.ssi.gouv.fr/
3
https://www.ssi.gouv.fr/en/strategic-committee/the-french-internet-resilience-observatory/
4
Domain Name System.
5Internet Service Providers.
• the relationship betweeen the ISPs of the clients and the response from the DNS server; • the presence or absence of load balancing;
• the similarities and differences between IPSs; • the evolution of TTL6.
The analysis does not stop to theses points. The objective is also to do some data mining in order to find some specific behaviors or patterns which are relevant regarding the DNS architecture.
Finally, another goal is to map the data collected to have a global visualization of the DNS architecture.
In order to do this, the project Atlas7 from the RIPE-NCC is used. The Atlas project is a global, open, distributed Internet measurement platform, consisting of thousands of probes that measure Internet connectivity in real time. These probes are dissiminated all around the world, in nearly all ISPs. Thanks to this, it is possible to lauch queries from all over the world and compare the results.
For this project, we first developed specific tools to access these probes and launch specific DNS queries. The second step was to analyze the collected data and interpret them regarding our objective. This report contains the conclusions of our analysis.
1.3
Outline
First, we will present in more details the context of this project in Chapter 2. An explanation of the DNS protocol is given, along with the overview of the Atlas project. Chapter 3 describes our methodology to analyze the data we collected. The results are given in Chapter 4, where several patterns of communication found in the data are presented. A focus on two different Autonomous Systems, Google and Orange, is done in Chapter 5. Finally, Chapter 6 concludes and explains the future work of this project.
6
Time to live.
7
Chapter 2
Context
2.1
DNS protocol
The Domain Name System emerged with the RFC1034 1 in 1987. It is a protocol for exchang-ing information about domain names of the entities on a network. The most common use we, as users, make of it is to find the IP address of a domain we want to reach. For example, when ac-cessing http://atlas.ripe.net in your favorite browser, your computer asks: What is the IP of atlas.ripe.net? and gets an answer containing an IP, which can then be used for the actual HTTP connection to take place. DNS is much more versatile than just resolving IPs. There are several types of DNS records, for IP resolution it is a type A (IPv4) or AAAA (IPv6). In this study, we work with TXT records, since they allow any text content as the answer.
Another key feature of DNS is its decentralized, hierarchical structure. That is, the knowledge about the domain names is spread and organized in zones, with one or more authoritative servers each. In Figure 2.1 we detail the resolution for the domain 9872-42.zone-redocs.irisa.fr, assuming the resolver as no cached recoreds. It illustrates our study case.
1. The resolution process starts with a query to one of the root servers. The root servers do not answer directly, but respond with a referral to more authoritative servers, here .fr servers. 2. The resolver now queries the .fr servers referred to, and is given a referral to the irisa.fr
servers.
3. This process is repeated to have the referral servers for zone-redocs.irisa.fr. 4. Finally, the authoritative server for zone-redocs.irisa.fr gives the answer.
As DNS resolutions happen all the time, and many users make identical requests, www.google.com for example, there are ways to optimize the resolution steps with use of DNS caches. At a company level for example, there might be one DNS server handling the recursive resolution for all the internal users so that it answers the IP of www.google.com multiple times, having made only one resolution to Google authoritative servers. Similar things happen at other scales, for example at Internet Service Provider or Autonomous System (AS) level. The DNS caches organization is a main focus of our study.
2.2
RIPE Atlas project
To analyze DNS infrastructures around the world, we want to make DNS queries as legitimate users would do, worldwide. For this purpose we use Atlas2, ”the largest measurement network ever made”, initiated by RIPE NCC, the Regional Internet Registry for Europe, Middle East and Central Asia. This measurement network consists in more than 14 thousands probes and 2 hundreds anchors. The probes are small USB-powered devices with network connectivity, which can be tasked to perform
1
ftp://ftp.isi.edu/in-notes/rfc1034.txt
2
https://atlas.ripe.net
Figure 2.1: Recursive DNS resolution done by DNS resolvers (caches)
measurements (ping, traceroute, DNS queries...). The anchors are servers hosted in ISPs which perform measurements and also serve as measurement targets. Sending tasks to probes and retrieving results is done through the Atlas API, upon which are built Python frameworks (Cousteau3 and Sagan 4) that we used.
3
https://github.com/RIPE-NCC/ripe-atlas-cousteau
4
Chapter 3
Methodology
The global set-up for our experiment is illustrated in Figure 3.1. Different data are recorded on the probe side and the server side.
Figure 3.1: Experiment set-up
3.1
Probe side
On the probe side, we perform measurements where every probe is asked to request one unique domain with its default resolver. This unique domain is built as the concatenation of the timestamp, a dash and the probe ID. The necessity to ask for a unique domain is due to two reasons:
• it differentiates every query on the server side, we know exactly from which probe the query is coming;
• it bypasses the possible DNS caches since the same domain is never asked twice.
An example of response to a DNS query by a probe is given in Listing 3.1. This response is available on the Atlas API.
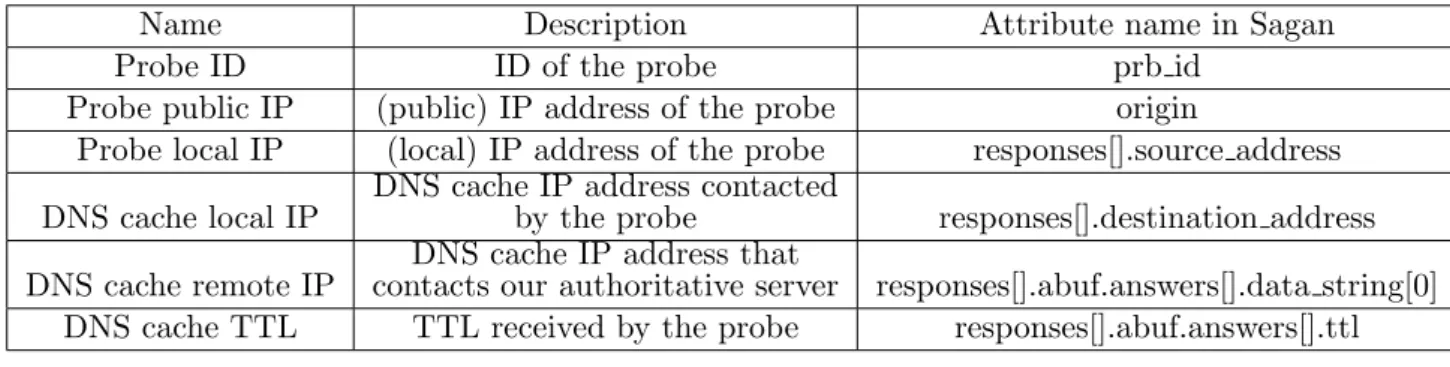
Only a few fields in this response are important regarding our objective. Using Sagan, the fields given in Table 3.1 are extracted.
3.2
Server side
For this project, we managed the authoritative server for the DNS zone zone-redocs.irisa.fr. We developed our own very small DNS server in python, using dnslib1. This personalized DNS server
gives us the ability to see the request from the server side and send a specific response. This server handles only TXT queries, because the format of the answer is free, meaning that we can send back the data we want.
1
https://bitbucket.org/paulc/dnslib/
Listing 3.1: Response for a DNS query [ { ” t y p e ” : ” dns ” , ” timestamp ” : 1 4 7 7 4 8 7 8 6 5 , ” r e s u l t s e t ” : [ { ” t i m e ” : 1 4 7 7 4 8 7 8 6 5 , ”submax ” : 1 , ” s u b i d ” : 1 , ” s r c a d d r ” : ” 1 9 2 . 1 6 8 . 1 7 9 . 2 4 ” , ” r e s u l t ” : { ” s i z e ” : 1 0 0 , ” r t ” : 6 9 . 7 5 1 , ” a n s w e r s ” : [ { ”TYPE” : ”TXT” , ”RDATA” : [ ” 8 1 . 1 7 3 . 1 9 4 . 7 7 61643 Wed27257 −29405” ] ,
”NAME” : ”Wed27257 −29405. zone−r e d o c s . i r i s a . f r ” } ] , ” a b u f ” : ”\/KWBgAABAAEAAAAADldlZDI3MjU3LTI5NDA1C3pvbmUtcmVkb . . . WQyNzI1Ny0yOTQwNQ==”, ”QDCOUNT” : 1 , ”NSCOUNT” : 0 , ”ID ” : 6 4 6 7 7 , ”ARCOUNT” : 0 , ”ANCOUNT” : 1 } , ” p r o t o ” : ”UDP” , ” l t s ” : 1 9 , ” d s t a d d r ” : ” 1 9 2 . 1 6 8 . 1 7 9 . 1 ” , ” a f ” : 4 } ] , ” p r b i d ” : 2 9 4 0 5 , ”msm name ” : ” Tdig ” , ” msm id ” : 6 9 0 6 2 0 1 , ” l t s ” : 1 9 , ” g r o u p i d ” : 6 9 0 6 2 0 1 , ” fw ” : 4 7 4 0 , ” from ” : ” 8 7 . 7 9 . 2 0 0 . 1 4 8 ” } ]
Name Description Attribute name in Sagan
Probe ID ID of the probe prb id
Probe public IP (public) IP address of the probe origin
Probe local IP (local) IP address of the probe responses[].source address DNS cache local IP
DNS cache IP address contacted
by the probe responses[].destination address DNS cache remote IP
DNS cache IP address that
contacts our authoritative server responses[].abuf.answers[].data string[0] DNS cache TTL TTL received by the probe responses[].abuf.answers[].ttl
Table 3.1: Important data fields
Location Number of available probes Approximate time needed for the measurements
France 651 1h
World 8605 7h
Table 3.2: Description of our measurements
In order to know where the origin of the request, the TXT data is the following: Remote IP, Remote Port, Domain Requested. We also log the following fields from the server side: the DNS cache remote IP, the port it uses, the probe ID (we extract it for the requested subdomain) and the TTL we set (only 120 for this study).
3.3
Retrieving the results
We launched two campaigns of measurements: first on all French probes, second on all possible probes in the world. To do this, we requested all available probes using the Atlas API. Due to the limitation of the API of Atlas, only one hundred queries can be launched at the same time. This means that we have to time the requests we made.
Chapter 4
Analysis
During our analysis, we have identified some interesting behavioral patterns. In this section, we present the patterns observed during our experiments.
4.1
Global view
We used a graphical visualization tool, Gephi1, to facilitate our analysis of DNS infrastructures. Figure 4.1 reflects a glimpse of DNS request and responses for the probes from France. The nodes in the graph represent the probes, probes resolvers, DNS cache servers and our DNS server. Using this graph we were able to quickly find new behaviors. To facilitate the understanding, we will explain some scenario by considering a small portion of this visual graph.
Figure 4.1: Visual graph for France.
1
http://gephi.org/
Figure 4.2: Distribution of the probes in the world
4.2
Probes
4.2.1 Probes around the world
At that time of our experiement (October 26th, 2016), 8605 probes were available. Figure 4.2 illustrates the geographic repartition of the probes. These probes are situated in 176 countries all around the globe. This confirms that thanks to the Atlas project, queries will be coming from the whole world. If we take a closer look, we can see that the majority of them are in Europe and North America.
Regarding the autonomous systems of the probes, there are 3187 different AS in our data. The AS with the biggest number of probes are also the european and the american operators, as we can see in Table 4.1.
4.2.2 Queries per probe
While looking at the number of queries requested by the probes in general, we observed that a single probe can explicitly send a DNS query to more than one resolver. For instance a probe can send a DNS request to a local resolver and a public DNS resolver like public Google DNS server. This is described in Figure 4.3.
We can see in Figure 4.4 that a little bit more than 80% of the probes make 1 or 2 queries, and roughly 17% make 3 queries. None made more four or more queries itself.
If we consider an example from our experimentation results, in the Figure 4.5, one can observe Align the wording
Align the wording
that probes (yellow nodes) 17096, 19762 and 17157 sent DNS queries to only single resolver. On the contrary the probes with a green frame (like the 12821) are sending queries to several DNS resolvers.
Name of the AS Number of probes
COMCAST-7922 - Comcast Cable Communications LLC US 341
LGI-UPC formerly known as UPC Broadband Holding B.V. AT 296
DTAG Internet service provider operations DE 279
PROXAD FR 175 AS3215 FR 154 ZIGGO Ziggo B.V. NL 95 XS4ALL-NL Amsterdam NL 92 NTL GB 73 KABELDEUTSCHLAND-AS DE 71
UUNET - MCI Communications Services Inc. d/b/a Verizon Business US 71
BELGACOM-SKYNET-AS BE 60
BT-UK-AS BTnet UK Regional network GB 59
ASN-IBSNAZ IT 52
Table 4.1: Top AS
Figure 4.3: A probe sending several queries.
Figure 4.5: Probes making several queries in our experimentation.
Figure 4.6: Several probes use the same resolver.
4.3
Probe DNS resolvers
A DNS resolver can be used by multiple probes. This is a typical generic DNS client-server case, where multiple DNS clients, probes in our context, are interacting with a single DNS resolver as shown in Figure 4.6.
If we consider an example from the experimentation results, in Figure 4.7, we can observe that the Writing alignment.
Writing alignment.
DNS resolver with the IP address 109.0.64.102 is serving the three probes 12821, 17096, 28784. Considering the campaign data we used for our experimentation, we observed that they are more than 700 DNS cache servers that serve multiple probes. Out of these queries to probe resolvers with public IPs, 30% were served by the google public DNS cache servers. In particular, the DNS cache server 8.8.8.8 server is the top most queried server, followed by 8.8.4.4 server. The Figure 4.8 projects the number of probes served by DNS resolvers.
4.4
DNS caches
Figure 4.7: Same DNS resolver for several probes in our experimentation.
Figure 4.9: Replications of probe query.
Probe id # probe queries # DNS cache queries
121 1 29
23857 1 26
17382 2 19
12155 2 17
3189 2 12
Table 4.2: Probe queries with most replications.
4.4.1 Query replication
We observed this scenario when one probe made one query to one probe resolver and that trigger queries from other caches, cf Figure 4.9. Unlike the case where a single probe interacts with multiple cache servers, here the probe DNS request is replicated at DNS cache server level. And therefore, from IRISA server side, we see several queries for a same probe and respond to each separately. This pattern is observed by comparing the number of DNS requests entries in the log file on at probe level with the number of DNS response entries in the IRISA server log.
In Table 4.2 we report the cases with most replications. For example, the probe 121 has originally initiated one query to its resolver and this query has triggered 29 queries from different DNS caches to IRISA DNS cache server.
This behaviour could indicate that there is a replication strategy in the ISP. More focused mea-surements would allow us to better outline entities doing this.
4.4.2 Several layers of caches
Next we identified when probe resolvers and DNS caches form a multi-layers structure. More precisely, we see several probes using the same probe resolver and from the authoritative side we see queries coming from different DNS caches, see Figure 4.10. The first case to think of is that of Google: 8.8.8.8 and 8.8.4.4 are used by many probes and on the DNS side we see queries coming from several hundreds IPs.
Overall, we found a total of 282 probe resolvers and 1024 outbound cache servers. There are certainly more resolvers and caches involved in such structure, more measurements and more analyses could extract them. Figure 4.11 provides a glimpse of inbound DNS traffic between yellow probe nodes to google DNS resolvers. And the outbound DNS traffic is observed between the DNS cache servers close to IRISA DNS server.
Figure 4.10: Multi-layer caches organization.
Figure 4.12: Probe resolver and DNS cache in different AS.
4.5
Separation between AS
In this section, we analyze the relationship between autonomous systems.
4.5.1 Probe resolver and DNS cache in different AS
In this first case we report observations on scenario where the probe resolver interacts with a DNS cache in a different ISP. This can be strange for big ISPs of which we could expect that they perform DNS recursions themselves.
Overall there are 1263 of such probe requests in our world data campaign.
4.5.2 Probe and probe resolver in different AS
In general, a probe is likely to interact with a probe resolver that is either local (private IP) or public in the same ISP as the probe. However, in some cases we observed probes interacting with probe resolvers outside its ISP. This could indicate that the probe does not get automatic IP configuration optimized for its ISP but some settings are overridden by the user for example.
Overall, we found around 2624 probes that interact with the DNS caches outside from their home AS.
4.6
TTL modification
Aside of the previous analysis on DNS caches organization, we also had a quick look at the TTL value. This field is set by the authoritative server as a validity period for the record. For DNS caches and clients it means that they need not ask again the same question to the authoritative server in this time frame. This value allow to decrease the authoritative server load, yet keeps a dynamic in the system in case of updates. Typical observed values count in minutes. So, for our experiments we set a TTL of 120 seconds at the DNS server level and made observations of the values received by the probes. We see in the Figure 4.14 below that most of the caches forward the original (or decreased) value to the probes, but some raise it to 150, 300, 600, 1800, 3600, or even 86400 (24 hours).
While this increase is understandable from a load management point of view, DNS cache providers may wish to avoid too frequent updates, it can lead to service unavailability to users. For example, in
Figure 4.13: Probe and probe resolver in different AS.
case of IP relocation, as it happens these days of IPv4 penury, a service provider would announce a new IP for his domains. But its clients behind caches which increase TTL values too much, will not update their local information for some time and thus fail to connect to the correct IP.
Further study would be interesting on this aspect. For example, what happens in the case where the authoritative server set a very high value? Do the caches lower it or further increase it? Also we could study the real time during which the cache keeps the value. Does it follow strictly the TTL of the authoritative? Does it depends on the popularity of the domains? (How often clients ask for it?).
Chapter 5
Focus on two AS
In this last section, we present our detailed study on two DNS resolver providers. The first is Google with its widely known public DNS resolvers 8.8.8.8 and 8.8.4.4 and the IPv6 counterparts. The second is Orange, the largest French ISP (in terms of number of users). The results presented here comes from extracts of our world campaign data.
5.1
At the end of 2009, Google announced the availability of its DNS service, open to everyone for free1. Setup is made very simple thanks to easy to remember IPs 8.8.8.8 and 8.8.4.4, this service is now used by large amount of users.
Out of the 8,605 probes used during our world campaign, 1,835 (21.3%) used this service, account-ing for 2,805 queries out of 15,204 total queries (18.6%). From the authoritative server view, we saw queries coming from 546 different IPs. Figure 5.1 displays the situation for IPv4 measurements.
With this picture only, we could think there are two bottlenecks in this strategy. However, as Google advertised in its dedicated FAQ2, we could confirm that regional resolvers are used and not all traffic get routed to the same two places. Below is a map 5.2 where the 546 different resolvers IPs are located. We can see there are resolvers in North and South America, Europe, East and South-East Asia.
With 546 requesters, we looked also at how well distributed the queries are. As shown in Figure 5.3, some are used for up to 40+ queries whereas 3/4 of them resolved less than 5 queries. It could be interesting to look at this data with respect to probe repartition, which might induce biases.
5.2
Orange
Orange is a French multinational telecommunications corporation. 147 probes haved used Orange resolvers in our data. From the authoritative server view, we saw 174 queries coming from 146 different IP addresses.
We also looked at how well distributed the queries are. As shown in Figure 5.4, there is way less load on the Orange DNS caches than the Google ones.
Finally, we can see that Orange has put its DNS caches in four locations in France. These locations are shown in Figure 5.5.
1
https://googleblog.blogspot.fr/2009/12/introducing-google-public-dns.html
2
https://developers.google.com/speed/public-dns/faq
Figure 5.1: Google public DNS service structure
Figure 5.3: Number of queries per DNS resolvers
Chapter 6
Conclusion and future work
The results presented here summarize the work done over 3 days during REDOCS. It is obviously not all that can be said. Nevertheless, we were able to outline some behaviours and notice some patterns in DNS caches organization at ISP/AS level, as our main objective was.
Further work could extend the results. First on the same dataset, it could be interesting to improve the pattern detection and understanding. Then, new measurements could highlight the dynamic of the DNS infrastructures: monitoring TTL compliance, discovering load-balancing elements... Also with a focus on a DNS provider we could obtained more data and more information about its configuration or strategy.