HAL Id: hal-00275334
https://hal.archives-ouvertes.fr/hal-00275334
Submitted on 23 Apr 2008
HAL is a multi-disciplinary open access
archive for the deposit and dissemination of
sci-entific research documents, whether they are
pub-lished or not. The documents may come from
teaching and research institutions in France or
abroad, or from public or private research centers.
L’archive ouverte pluridisciplinaire HAL, est
destinée au dépôt et à la diffusion de documents
scientifiques de niveau recherche, publiés ou non,
émanant des établissements d’enseignement et de
recherche français ou étrangers, des laboratoires
publics ou privés.
A new methodology to estimate the impact of H.264
artefacts on subjective video quality
Stéphane Péchard, Patrick Le Callet, Mathieu Carnec, Dominique Barba
To cite this version:
Stéphane Péchard, Patrick Le Callet, Mathieu Carnec, Dominique Barba. A new methodology to
estimate the impact of H.264 artefacts on subjective video quality. International Workshop on Video
Processing and Quality Metrics for Consumer Electronics, VPQM, Jan 2007, Scottsdale, United States.
pp.373. �hal-00275334�
A NEW METHODOLOGY TO ESTIMATE THE IMPACT
OF H.264 ARTEFACTS ON SUBJECTIVE VIDEO QUALITY
Stéphane Péchard, Patrick Le Callet, Mathieu Carnec, Dominique Barba
Université de Nantes – IRCCyN laboratory – IVC team
Polytech’Nantes, rue Christian Pauc, 44306 Nantes, France
stephane.pechard@univ-nantes.fr
ABSTRACT
The impact of H.264 artefacts on subjective quality is still under investigation [1]. Contrary to existing approaches, this paper considers the impact on perceived quality of real H.264 artefacts in HDTV videos. A method for the design of spatio-temporal classification is proposed. This classifi-cation is used to locally distort sequences with the H.264 codec. Class-generated sequences are then subjectively as-sessed in order to evaluate the importance of each spatio-temporal class. An attempt to find a relation between lo-cal and global quality loss is then presented and discussed, along with an annoyance function model.
1. INTRODUCTION
Many studies exist concerning subjective quality assessment of coding artefacts [1,2]. Most of them consider the influ-ence of several coding artefacts on subjective quality. But the strongly temporal aspect of video quality assessment is often underestimated. Farias [2] synthesizes such artefacts in order to apply them independently or combined on iso-lated regions of the sequence. This is a content-independent approach. Wolff [1] uses sequences distorted through the use of the H.264 coding scheme. Two tasks are then asked of observers. The first is to assess the global annoyance caused by all visible impairments on the entire sequence. The second is to rate the strength of each type of artefact.
Instead of considering different artefacts, H.264 is con-sidered here as producing artefacts (only due to quantiza-tion) that can lead to different perceived annoyance depend-ing on the spatio-temporal class of the content. Actually, the perception of the distortions strongly depends on the lo-cal content of each distorted spatio-temporal region. For example, applying the same quantization error gives partic-ularly visible distortions in smooth areas, whereas these dis-tortions can be fully masked in highly textured areas. In the same way, quantization produces different results on edges. Therefore, the proposed approach is to distort only selected coherent spatio-temporal regions in terms of type of content
with real coding artefacts in order to reflect common broad-casting usage. The methodology is presented in Section2.
Then, from these partly distorted sequences, a relation between the qualities of these sequences and the global qual-ity may be considered. It is also possible to study each class independently and to design an annoyance function for each one. Such models are detailed in Section3.
2. THE PROPOSED APPROACH
The human visual system has different perception of impair-ments depending on the local spatio-temporal content where they occur. Therefore, several classes of content have been defined in order to study them separately. These are five classes defined as follows:
• smooth areas with low luminance (C1) ;
• smooth areas with high luminance (C2) ;
• fine textured areas (C3) ;
• edges (C4) ;
• strong textured areas (C5).
Each class corresponds to a type of content with a cer-tain spatial activity, so to a cercer-tain impact of the H.264 coding artefacts on the perceived quality. In order to ob-tain these spatio-temporal zones from the global sequence, a segmentation of the sequence is proposed. Then a classi-fication of each spatio-temporal segment is processed. Dis-torted sequences are generated from the classification. Fi-nally, subjective tests are designed in order to assess the im-pact of artefacts on subjective quality for each class. 2.1. Segmentation
From the original uncompressed sequence, the segmenta-tion creates elementary spatio-temporal volumes. The in-terlaced video (1080i format) is separated into two fields. The first part of the segmentation is a block-based motion
Fig. 1. Tube creation process over five fields.
estimation which enables the evolution of spatial blocks to be followed over time. This is performed per group of five consecutive fields of the same parity (odd and even fields). For each group of five fileds, the center field i is divided into blocks and a motion estimation of each block is computed simultaneously using the two previous fields and the two next fields as shown in Figure1. Spatially, search windows are defined as containing the highest possible displacement in the sequence. Differences between blocks are evaluated by the mean square error (MSE) on the three YUV compo-nents. The selected motion vector is the one minimizing the MSE. The temporal tracking of each block in field i defines an elementary spatio-temporal “tube” over the five consid-ered fields. This concept of 3D tubes has been introduced by Wolf and Pinson [3] for an objective quality video metric. In Wolf’s approach, tubes are fixed in time while in the pro-posed approach, they are oriented along the local motion. Consequently, the temporal tubes are coherent in terms of motion and spatial activity. As HDTV content processing is of particular complexity, this motion estimation is per-formed on a multi-resolution representation of each field. It is first processed on the lowest resolution, then the result-ing motion vector is adjusted by takresult-ing account of the next higher resolution, and so on. The three-level hierarchical process reduces significantly the required computation. The displacement vector of a frame block is the average of the two motion vectors associated with its two fields. Finally, these spatio-temporal tubes are temporally gathered to form spatio-temporal volumes along the entire sequence. This gathering consists of giving the same label to overlapping tubes as depicted in Figure2. Some unlabelled holes may appear between tubes. They are merged with the closest ex-istent label. Thus, every pixel of the source has one and only one label.
2.2. Classification
The second part of the segmentation is the spatial process-ing. It is performed as a global tracking of moving objects over the whole sequence. Tubes are merged based on their positions which overlap over time, enabling objects to be
Fig. 2. Labelling of overlapping tubes.
followed. This merging step is based on the class of each tube. Each set of merged tubes is also classified into a few labelled classes with homogeneous content.
This step uses four spatial gradients (∆H, ∆V , ∆D45◦
and∆D135◦) computed on every pixel of each tube. Means
(∆H, ∆V , ∆D45◦ and∆D135◦) over the tube of the
abso-lute gradients are used in two spatial activity spaces P = (∆H, ∆V ) and P′ = (∆D45,∆D135) in order to label the
tube. Both spaces have the same geometric properties as shown in Figure3. Plane geometry determines the global
CP′ 5 C4 C4 C3 C1 C2 ∆H ∆V
Fig. 3. P = (∆H, ∆V ) is the plane allowing blocks classi-fication.
sequence block classification. Polar coordinates are used for content in order to get most relevant classification for each sequence. P′space is used only for data labelled as C5in P .
Depending on these features, a tube may be labeled as cor-responding to a smooth area (C1or C2in both planes), a fine
textured area (C3in both planes), a strong textured area (C5
only in P′) or an edge (C4in both planes). No directional
information is conserved about the edges. Artefact visibility in smooth areas depends on the luminance level. Therefore, two different labels have been defined: smooth areas with
Sequence HDTV Bitrates (a) Above Marathon 5 ; 8 ; 10
(b) Captain 1 ; 3 ; 5 (c) Dance in the Woods 3 ; 5 ; 6 (d) Duck Fly 4 ; 6 ; 8 (e) Fountain Man 1 ; 5 (f) Group Disorder 2 ; 4 (g) Rendezvous 6 ; 8 (h) Ulriksdals 1 ; 4
Table 1. Chosen bitrates (in Mbps) per video sequence.
low luminance (C1) and smooth areas with medium or high
luminance (C2). A threshold is defined to distinguish them.
Finally, five labels are used to classify every merged tube in every sequence.
2.3. Sequences generation
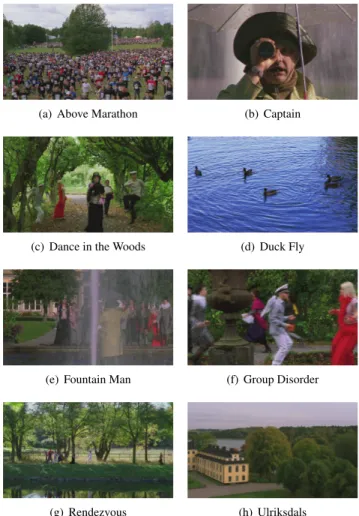
Distorted sequences are generated from the original HDTV sequence, the H.264-distorted sequences at several bitrates and the classification of the original sequence. H.264 cod-ing is performed with the H.264 reference software [4] at High Profile. Several bitrates of H.264-distorted sequences are selected in order to cover a significant range of qual-ity. Bitrates (in Mbps) used for each sequence are pre-sented in Table1. Original uncompressed sequences were provided by the swedish television broadcaster SVT. Fig-ure4 presents an example of each of the eight sequences provided.
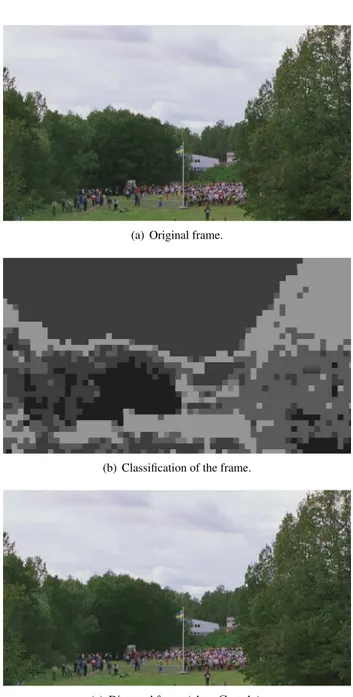
Precautions have been taken in the coding, especially for the rate control aspect which is particularly critical in the reference software. Parts of the distorted sequence cor-responding to a class are inserted in the original sequence. This process creates one sequence per class with one spatio-temporal homogeneous content part distorted. Steps are shown in Figure5(here with only the quarter of an actual HDTV image). This figure does not reflect the temporal as-pect of the segmentation. The classification frame (b) shows the different classes. Luminance value Y of a pixel in this image is obtained by: Y = i × 30 with i the index of the class. Class C1is distorted in the last image (c). It is
visi-ble on the tree in the middle of the frame. Borders between original and distorted regions are treated so as to smooth the transitions.
2.4. Subjective quality assessment
Subjective quality assessment tests are designed to individ-ually measure the impact of each class on the perceived quality. According to international recommandations [5] for the test conditions, assessments are performed using the SAMVIQ protocol [6] with at least 15 validated observers
(a) Above Marathon (b) Captain
(c) Dance in the Woods (d) Duck Fly
(e) Fountain Man (f) Group Disorder
(g) Rendezvous (h) Ulriksdals
Fig. 4. Examples of the SVT HDTV sequences.
and normalized viewing conditions. The monitor used is a 1920×1080 HDTV 37PF9731D/10 Philips LCD display. Uncompressed 1080i HDTV sequences are played with a Doremi V1-UHD player. The test session for one content at bitrate B is composed of the following sequences:
1. explicit reference (high anchor) ; 2. C1-only distorted sequence at B ; 3. C2-only distorted sequence at B ; 4. C3-only distorted sequence at B ; 5. C4-only distorted sequence at B ; 6. C5-only distorted sequence at B ; 7. entirely distorted sequence at B ;
8. entirely distorted sequence at a low bitrate (low an-chor) ;
(a) Original frame.
(b) Classification of the frame.
(c) Distorted frame (class C1only).
Fig. 5. Steps of the distorted sequences creation.
9. entirely distorted sequence at a third bitrate, corre-sponding to a quality of 40 or 60 (on a 100 scale), it is defined depending on B and on the low anchor bitrate ;
10. hidden reference (high anchor).
High and low anchors are used in the SAMVIQ proto-col to indicate to the observers what the limits of the quality scale are. The explicit and hidden references are the same uncompressed version of the sequence. The explicit ref-erence is clearly labeled as the refref-erence for the observer, while the other sequences are not labeled.
3. RESULTS AND MODELING
3.1. Segmentation statistics
Each tube category corresponds to a certain proportion in the sequence. Such proportions are computed as the ratio between the number of pixels in the Ci class and the total
number of pixels of the sequence. The mean proportions of each class in the sequences are presented in Table2(in percentages). Sequence C1 C2 C3 C4 C5 (a) 3.75 17.45 27.79 0.94 50.06 (b) 13.14 78.26 6.81 1.43 0.36 (c) 3.80 22.57 53.85 3.02 16.75 (d) 0.13 8.97 19.50 10.70 60.70 (e) 10.52 70.71 13.37 1.45 3.93 (f) 25.28 38.58 29.80 1.79 4.54 (g) 8.78 12.38 19.87 2.05 56.92 (h) 13.54 41.31 40.48 1.36 3.30 Table 2. Proportions of each class of every sequence (in %). Labels of the sequences are from Figure4.
Class C1(smooth areas with low luminance) has a
mod-erate range of values, from almost zero (0.13%) to a quarter of the image. Class C2(smooth areas with high luminance)
has the highest range of proportions. Sequences with the waterfall (Captain and Fountain Man) have particularly high proportions due to classification in C2of the zones where
water is falling. Class C3(fine textured areas) has a strong
importance, between 6 and 54%. Class C4(edges) has
par-ticularly low importance. Except for one sequence at 10%, its proportion is less or equal to 3%. Finally, class C5 has
a high range of values, from almost zero (0.36%) to more than 60%.
These proportions are consistent with the nature of the sequences. These are all made of realistic contents with out-door scenes. Therefore, few edges, some smooth areas (like clothes or the sky) and a lot of textures (trees and grass) are present.
3.2. Relation between local∆MOS and global DMOS A Mean Opinion Score, denoted MOS(Ci, Sj, Bk), is
ob-tained for each partly distorted sequence Sj and for each
class Ci at each bitrate Bk. The difference between this
partial MOS and the MOS of the original sequence (hid-den reference) is called∆MOS(Ci, Sj, Bk). It indicates the
quality loss induced by the distortions in class Ci. Each
dis-torted class induces a quality loss which is part of the global quality loss of the entirely distorted version compared to the original one.
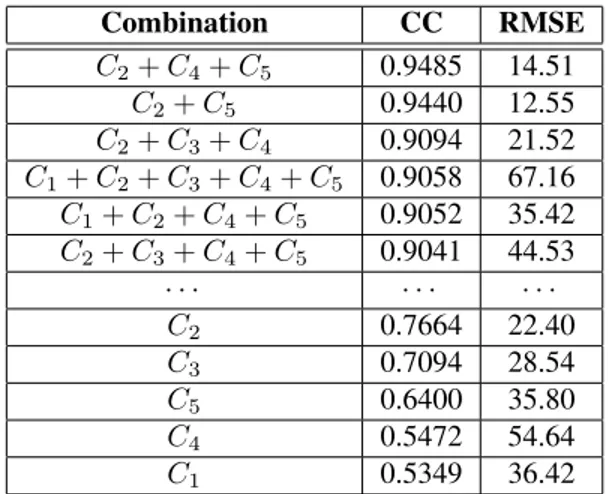
As an attempt to determine a relation between the lo-cal∆MOS of the classes and the global DMOS, an additive model has been tested. Such a relation would be very use-ful in order to design an objective quality metric using the presented methodology. Such a metric would evaluate the global quality from classes quality. The tested relation uses the sum of the∆MOS of some or all the classes, without any weights. Table3presents the combinations and the as-sociated CC and RMSE. For CC < 0.9, only combinations with one class have been kept.
Combination CC RMSE C2+ C4+ C5 0.9485 14.51 C2+ C5 0.9440 12.55 C2+ C3+ C4 0.9094 21.52 C1+ C2+ C3+ C4+ C5 0.9058 67.16 C1+ C2+ C4+ C5 0.9052 35.42 C2+ C3+ C4+ C5 0.9041 44.53 · · · · C2 0.7664 22.40 C3 0.7094 28.54 C5 0.6400 35.80 C4 0.5472 54.64 C1 0.5349 36.42
Table 3. Combinations of classes∆MOS and their respec-tive correlation coefficients and RMSE with DMOS.
These combination results reveal the relative importance of each class in the merging process made by the mean ob-server. Both combinations with a CC over 0.94 and the low-est RMSE use almost exclusively the classes C2 and C5.
Therefore, those two are particularly important in the merg-ing process. Despite its low proportions and smerg-ingle combi-nation correlation (0.5472), the class C4is present in five
of the six first combinations. The distortions on these three classes (one with edges, one with smooth areas and one with textures) are closely related to the global quality of the se-quence. At the bottom of the table, single class combina-tions provide the lowest correlacombina-tions and the highest errors, revealing that using only one class is not sufficient to ex-plain the global behaviour. Furthermore, these values con-firm the high importance of the class C2with the highest CC
for a single combination (0.7664) and the low importance of C1and C4alone. The latter tend to be of importance only
combined with other classes.
Despite its simplicity, such an approach provides high correlations with very few strategic classes. Therefore, it is possible to envisage a pooling of the partial qualities of the classes into a global one for the sequence. However, errors are quite high, revealing the poor precision of the relation. Moreover, it does not take in account the proportions of the classes used in the combinations. If a class has low propor-tions (like C4), it cannot reflect the global loss of quality.
On the other hand, class C1has moderate proportions and
very low importance here.
3.3. Model of annoyance function
In her approach, Farias is able to get an annoyance func-tion depending on the strength of her synthesized distorfunc-tions parameters. But here, no control is possible on the distor-tion level of a class with the only use of the H.264 coding parameters. Actually, several effects are part of the qual-ity loss induced by the distortions in one single class Ci.
First are the distortions in themselves. They correspond to a certain quantization step in H.264, therefore to a certain bitrate. However, due to the high number of observers re-quired to assess the sequences, only few bitrates are avail-able. Moreover, when only a spatial part of the sequence is distorted, obtaining the same quality required a lower bi-trate than when the whole sequence is distorted. Therefore, bitrates could reach very low level, without being realistic in a broadcasting context. Finally, the bitrate is applied by the coder to the entire sequence, not only to a specific class. But the spatial repartition of the bitrate is not homogeneous. Therefore, the bitrate is not a sufficient measure of the dis-torsions. These are the reason why the Mean Square Error (MSE) between the original and distorted versions of the sequence has been used in order to evaluate the distortions. Distortions also depend on the amount of movement in the class. Indeed, the more movement there is, the higher the motion vectors are, therefore the greater the bitrate they re-quire. Distortions are hence characterized both by the MSE and the mean movement of the class. Motion vectors are obtained from the motion estimation step. The proportion of the class area among the whole sequence inferes also in the mean observer’s judgment construction. Effectively, the bigger the class, the more visible, therefore the more prob-able of being annoying it is for the observers. Finally, the impact of a distorted part depends also on its spatial locali-sation along the sequence. An artefact situated in the center of the screen is noticeably more attractive than the same in a corner. However, this effect is not considered in the scope of this study.
An annoyance function has to take into account such effects. As a first attempt to model the annoyance function
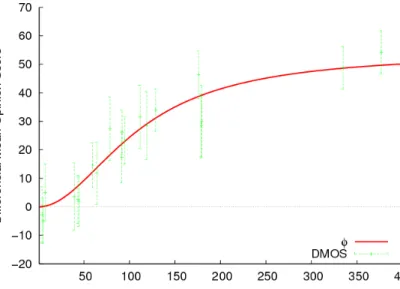
Fig. 6. DMOS as a function of the error measure for the class C1.
of each class, a weight of the mean error of the sequence is used for the class C1:
f(M, P, E) = (1 − M
MT) × P × E
(1) with MT a parameter to determine, M the mean movement,
P the mean proportion and E the MSE of the sequence. The factor1 − M
MT describes the influence of the movement
on the error perception. The more movement there is in the smooth areas of the sequence, the more masking of the errors occurs. Therefore, the increased movement decreases the impact of the error.
Figure6depicts the DMOS of the sequences as a func-tion of the computed error. Intervals of confidence at 95% of the DMOS are also plotted. The psychometric function corresponding to this model is:
φ(e) = a × e
b
c+ eb (2)
with e the error, a = 53.97, b = 1.996 and c = 11918 the parameters of the model. This function is also plotted in Figure6. The parameter MT is here taken equal to 40
pixels per image or 500 pixels per second. The correlation between the model and the values obtained from the subjec-tive tests is equal to 0.9514. The RMSE is equal to 5.25. This model is therefore a good predictor of the loss of qual-ity induced by the class C1.
4. CONCLUSION
This paper proposed a new manner to estimate the impact of H.264 artefacts on subjective video quality. A segmen-tation that creates spatio-temporal volumes with respect to a defined content typology has been detailed. Each spatio-temporal volume has been distorted with real artefacts and
assessed independently. Therefore, to predict the global quality of a sequence, the presented methodology separates it into several content-based classes. It is then possible to relate the impact of each of these classes on visual quality with the global quality of the distorted sequence. At the same time, a model of annoyance function has been pre-sented for the class C1.
This content-based impairment measurement can be ap-plied in both quality metric and coding domains. For ex-ample, it can be used in the design of an objective video quality criterion to weight the impact of artefacts with re-spect to the local content. In a coding context, the impact of coding artefacts in a certain part of the sequence can also be used to determine a more effective rate allocation.
5. ACKNOWLEDGEMENT
This work is supported by HD4U European project. The aim of HD4U is to study best conditions to deploy HDTV in Europe. Several manufacturers from consumer devices industries (Philips, Thomson, etc.) and broadcasters (TF1, Euro1080) are involved. Authors would like also to thank SVT for the open HDTV sequences, Thomson and Philips for the HDTV screens and Arnaud Tirel for his assistance in performing the experiments described in this paper.
6. REFERENCES
[1] Tobias Wolff, Hsin-Han Ho, John M. Foley, and San-jit K. Mitra, “H.264 coding artifacts and their relation to perceived annoyance,” in European Signal Process-ing Conference, 2006.
[2] Mylène Farias, No-reference and reduced reference video quality metrics: new contributions, Ph.D. thesis, University of California, 2004.
[3] Stephen Wolf and Margaret H. Pinson, “Spatial-temporal distortion metric for in-service quality moni-toring of any digital video system,” in Proc. SPIE, Mul-timedia Systems and Applications II, 1999, vol. 3845, pp. 266–277.
[4] Joint Video Team (JVT), “H.264/Advanced Video Coding reference software version 10.2,” 2006, http://iphome.hhi.de/suehring/tml/.
[5] ITU-R BT. 500-11, “Methodology for the subjective assessment of the quality of television pictures,” Tech. Rep., International Telecommunication Union, 2004. [6] Jean-Louis Blin, “SAMVIQ – Subjective assessment
methodology for video quality,” Tech. Rep. BPN 056, EBU Project Group B/VIM Video in Multimedia, 2003.