HAL Id: hal-01735559
https://hal.archives-ouvertes.fr/hal-01735559
Submitted on 16 Mar 2018
HAL is a multi-disciplinary open access archive for the deposit and dissemination of sci-entific research documents, whether they are pub-lished or not. The documents may come from teaching and research institutions in France or abroad, or from public or private research centers.
L’archive ouverte pluridisciplinaire HAL, est destinée au dépôt et à la diffusion de documents scientifiques de niveau recherche, publiés ou non, émanant des établissements d’enseignement et de recherche français ou étrangers, des laboratoires publics ou privés.
Electroanalytical Detection
Isabelle Mazerie, Pierre Didier, Florence Razan, Philippe Hapiot, Nathalie
Coulon, Aurélie Girard, Olivier Le Monies de Sagazan, Didier Floner,
Florence Geneste
To cite this version:
Isabelle Mazerie, Pierre Didier, Florence Razan, Philippe Hapiot, Nathalie Coulon, et al.. A
General Approach Based on Sampled-Current Voltammetry for Minimizing Electrode Fouling in Electroanalytical Detection. ChemElectroChem, Weinheim : Wiley-VCH, 2018, 5 (1), pp.144-152. �10.1002/celc.201700884�. �hal-01735559�
A General Approach Based on Sampled-Current Voltammetry for Minimizing Electrode Fouling in Electroanalytical Detection
Isabelle Mazerie,[a] Pierre Didier,[b] Florence Razan, [b] Philippe Hapiot,[a] Nathalie Coulon,[c]
Aurélie Girard,[d] Olivier de Sagazan,[c] Didier Floner,[a] Florence Geneste*[a]
[a] Université de Rennes 1, ISCR, UMR-CNRS 6226, Equipe Matière Condensée et Systèmes
Electroactifs, Campus de Beaulieu, 35042 Rennes cedex, France.
[b] ENS Rennes, SATIE, UMR-CNRS 8029,Campus de Ker Lann 35170 Bruz, France.
[c] Université de Rennes 1, IETR, UMR-CNRS 6164, Campus de Beaulieu, 35042, Rennes
cedex, France.
[d] Université de Nantes, IMN, UMR-CNRS 6502, 2 rue de la Houssinière, BP32229, 44322
Nantes cedex 3, France.
Electrochemical analysis of species known to passivate electrode surfaces remains challenging. We previously proposed a new method dealing with sampled-current voltammetry performed on an electrode array to mimic polarography at a dropping mercury electrode for the detection of copper. In this work, we study the effectiveness of this method to circumvent electrode
fouling with the analysis of phenol solutions at high concentrations (10-2 mol L-1), known to
polymerize on electrode surface during its oxidation. Electrode arrays well-adapted to the analysis with such system are prepared by photolithography and characterized by X-Ray photoelectron spectroscopy, X-ray diffraction and voltammetry. While analyses performed in conventional linear voltammetry or sampled-current voltammetry on a single electrode are considerably affected by electrode fouling, a linear calibration plot was achievable using our method. Modelling of the electrochemical signal showed that the current depends only on the applied potential and a parameter characteristic of the passivation phenomenon. It also underlined that sampled-current voltammetry on electrode array can circumvent the problem of passivation by a judicious choice of the sampling time.
Keywords: electroanalysis; electrode fouling; modelling; passivation; phenol
*E-mail: [email protected]
Accepted
1. Introduction
Electrochemical detection systems have been widely used for health, safety, and environmental assessments due to their unique characteristics, such as short analysis time, low-cost
instruments, high sensitivity and compatibility with miniaturization and portability.[1-3]
However, the performance of solid electrodes may be drastically altered by fouling of their surface during the analysis, decreasing the electron transfer rate and so the electrochemical signal. Various processes could be responsible for this passivation phenomenon such as simple adsorption of species on the electrode surface, often occurring with biological
macromolecules,[4-5] and electrochemical reactions during the detection, leading to
oligomerisation or larger polymeric structures[6-10] or covalent bonding with the surface by
radicals formed in situ.[11-12] It is well known that these adsorption processes particularly affect
biosensors but also the electrochemical analysis of many species that are particularly challenging to detect, such as the large family of phenolic compounds (bisphenol A, chloro phenols, serotonin, phenolic estrogenic compounds), dopamine, thiourea, ascorbic acid, NADH.
Several antifouling strategies have been proposed to decrease the effects of passivation. Some
of them rely on the electrode material and its coating. Carbon-based electrodes[13] with carbon
nanotubes (CNTs),[14-18] graphene or diamond such as boron-doped diamond electrodes[19-25]
and carbon black diamond composite electrodes[26] have been widely used to minimize fouling.
Their antifouling properties have been ascribed to different factors as their hydrophobic
character.[4] For example, a decrease of passivation reported with CNTs has been linked to the
high density of edge plane sites on CNTs.[27] Since the adsorption mainly occurs on edge plane
sites, their high amount helps to delay electrode fouling. Nanographite impurities contained
within CNTs have also been held responsible for the antifouling properties of CNTs.[15] The
adsorption could also be reduced by modifying the hydrophobic/hydrophilic character of the electrode surface, preventing the approach of species responsible for the passivation of the electrode. This has been achieved by electrode coating with, for example, conducting
polymers[28-32] and membranes[33-36] or plasma treatments on the electrode surface.[37-38]
However, since these methods only delay the passivation process, it remains difficult to use the sensor in high concentrations of species known to foul the electrode or when fouling is fast and effective.
Accepted
Minimizing electrode fouling during analyses on conventional electrodes using different procedures has also been reported. For example, adsorbed material has been removed by acid
washing,[39] photocatalysis[40] and oxidation or reduction processes, such as the use of single
anodic and/or cathodic potentials or a train of pulses to periodically clean the electrode
surface.[7, 19, 39, 41-42] However, since modified electrodes are often used to improve the
performances of the electrochemical sensors taking advantage of a selective preconcentration
of the analyte[43-46] or of catalytic oxidation/reduction processes,[47-48] these methods are
inappropriate since they would inevitably damage the sensors surface.
We have previously developed a procedure based on sampled-current voltammetry performed on an electrode array prepared by techniques of printed circuit boards for the detection of copper
in aqueous solutions.[49] During the analysis, a single electrochemical measurement is
performed independently and differently on each electrode of the array to draw a current-potential curve. The device is equivalent to a dropping Hg electrode where the electrode surface is periodically renewed and a fresh solution is available in the proximity of the electrode between each measurement. By this way, the current-potential curve presents a sigmoid shape like in polarography performed on a dropping mercury electrode. Furthermore, since the data acquisition, that does not require the use of a potential ramp, is simplified, the device can be
easily portable.[49]
In this work, we have evaluated the application of this method to minimize electrode fouling. Since the renewal of the electrode surface is assured during the analysis, passivation phenomenon due to electrochemical reactions during the detection can be circumvented. We used sampled-current voltammetry on an electrode array made by conventional photolithography methods to overcome the problem of passivation. As a challenging test system, we have considered the analysis of phenol that is well-known to form oligomers
adsorbed on the electrode surface upon its electrochemical oxidation.[6, 50] Results are supported
by a theoretical approach that highlights the role of the main parameters involved in the analytical method.
2. Results and discussion
2.1 Characterization of the electrode array
Accepted
The surface of gold electrodes was analyzed by X-ray photoelectron spectroscopy (Figure S1), revealing the photoelectron peaks characteristic of gold. It is worth noting that silicon was not
present, underlining the effectiveness of the Si3N4 etching process.
The crystallinity and preferred orientation (texture) of the deposited polycrystalline gold films were studied by X-ray diffraction (Figure S2). The analyses revealed four peaks corresponding to (111), (200), (311) and (222) orientations in the polycrystalline film of gold. The existence of a preferred grain orientation was analyzed using the intensities of the peaks. A (111) preferred orientation (92.3%) was clearly highlighted from these analyses with only 5.6% of (222), 0.9% of (311) and 1.2% of (200).
To assure the reproducibility of the sensor fabrication, the electrochemical response of the gold electrodes of the array was first examined in a blank solution containing only the supporting
electrolyte (0.5 mol L-1 phosphate buffer, pH=7.2). A cyclic voltammogram typical of gold,
displayed in Figure 1a, was obtained with peaks corresponding to the formation of gold oxides as the potential was scanned from -1.0 to 1.5 V, and reduction of these oxides in the reverse scan.
Accepted
Figure 1. a) Typical cyclic voltammogram obtained on a gold electrode (0.002 cm2) of the array
in 0.5 mol L-1 phosphate buffer, pH=7.2 after stabilization of the signal. Scan rate 0.1 V s-1 b)
Current-potential curves corresponding to the reduction of a 10-3 mol L-1 solution of potassium
ferricyanide in 0.5 mol L-1 phosphate buffer, pH=7.2 by EASCV for different sampling times
. The potential was incremented by 0.02 V: En+1 = En + 0.0175 V. Error bars are based on
measurements performed on 5 different electrode arrays (0.002 cm2).
Then, to check the reproducibility of the electrochemical response obtained by sampled-current voltammetry on electrode array (EASCV, see Experimental Section), the reduction of potassium ferricyanide was examined on 5 different electrode arrays. The resulting current-potential curves for different sampling times are displayed in Figure 1b. Error bars increase for potentials close to the inflection point but are lower when the plateau current is reached, even
for short sampling times. As the limiting current (Il) is often used as a calibration parameter, its
value was obtained based on a sigmoid fit (Table S1) and the variation of the electrochemical signal is estimated from the standard deviation of 5 independent measures. A variation ranging from 1.1 to 2.7% was calculated for the studied sampling times. These results underline the good performance of the electrode arrays prepared by photolithography for EASCV measurements.
2.2 Electrochemical analysis of phenol
Phenolic derivatives are electroactive and can be oxidized within the potential window of water, which makes electroanalysis a method of choice for their detection. Unfortunately, the oxidation of phenolic compounds leads to intermediate radicals that combine themselves and form dimeric products, which are readily oxidized giving rise to the formation of insulating
oligomers and polymer chains.[6, 50] It results that the formed oligomers and polymers rapidly
passivate the electrode surface. This phenomenon is very efficient, as exemplified in Figure S5 with an electrochemical signal corresponding to phenol oxidation. One could notice the symmetric shape of electrochemical current and that the response is already lost in the second scan. The fast decrease of the current after reaching its maximum value strongly suggests that the peak current in the first scan was already affected by the passivation phenomenon. Indeed, the symmetric peak shape differs from those expected for a diffusion controlled process and is typical for an electrode process in which product adsorption occurs after the initial electron
transfer reaction.[51] The electrochemical behavior of phenol significantly complicates its
analysis, making it a particularly interesting compound to evaluate the interest of EASCV as a
Accepted
method to overcome the problem of electrode passivation. For comparison with EASCV, phenol oxidation was studied in sampled-current voltammetry performed on a same single electrode of the array (Figure S6a).
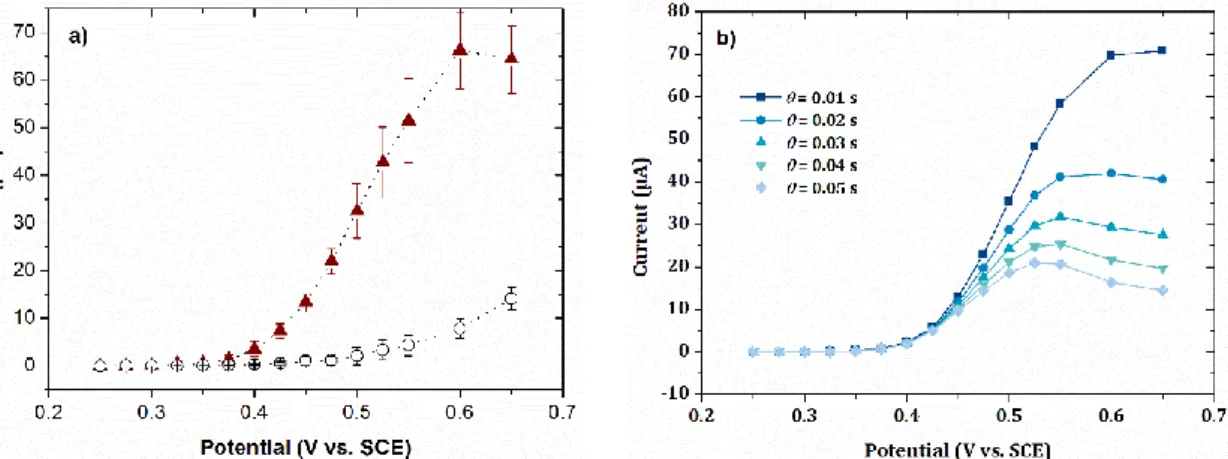
Figure 2. Current-potential curves (….▲….) of a solution of 10-2 mol L-1 phenol in 0.1 mol L-1 NaOH obtained by sampled-current voltammetry on the electrode array (EASCV) a) with a
sampling time of 0.01 s and b) with sampling times ranging from 0.01 to 0.05 s. Blank (…○…)
was performed in the same conditions in a 0.1 mol L-1 NaOH aqueous solution. Error bars are
based on three reproducibility measurements. Electrode surface area: 0.002 cm2
To obtain the current-potential curve, chronoamperometry measurements were recorded at increasing potentials for 0.1 s and the values of current were read at 0.01 s. A symmetric peak shape is obtained indicating a gradual but incomplete covering of the electrode surface during the analysis since a same single electrode was used without cleaning of its surface. When the same experiment was performed with the stirring of the solution (Figure S6b), an increase of the electrochemical signal is observed since the stirring increases the transport of phenol to the electrode surface. Nevertheless the curve still displays a peak shape indicating the occurrence of the passivation process.
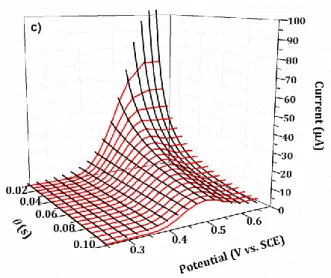
Finally, the same experiment performed on the electrode array (EASCV) led to a sigmoid current-potential curve (Figure 2a) recorded with a sampling time of 0.01 s. When increasing the sampling time (Figure 2b), the expected sigmoid curve tends to the peak shape curve as observed before indicating that the passivation process could be avoided by using EASCV at short sampling time. It is interesting to note that the passivation phenomenon did not lead to a simple decrease of the limiting current value corresponding to the plateau but changed the curve shape. In view of these results, a short sampling time (0.02 s) compatible with the response time of our potentiostat was chosen to construct the calibration plot. Shorter sampling times such as
0.01 s could obviously been chosen depending on the available potentiostat. Interestingly, the
Accepted
electrochemical signal is significantly higher with this method than with sampled-current voltammetry carried out on a single electrode, underlining all the interest of the method that allows the renewal of the solution as well as the electrode surface during the analysis. Indeed, each electrode of the array is sufficiently far away from the others to ensure that the solution at the vicinity of their surface would not be affected by electrochemical oxidations performed on the other electrodes.
2.3 Calibration plot at relatively high concentration of phenols
The dependence of the current on the concentration in phenol was deliberately studied at
relatively high concentrations of phenol (10-3-10-2 mol L-1) to clearly observe the impact of the
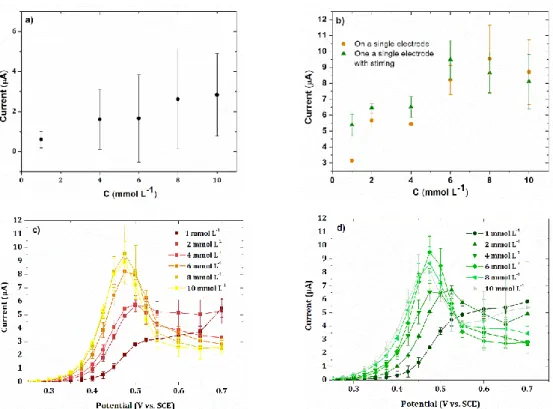
passivation phenomenon on the electrochemical response. A first study was performed by linear voltammetry on an electrode of the array, considering the current peak. The electrode was not cleaned between each analysis going from the lowest concentration in phenol to the highest one. The dependence of the current on the concentration of the analyzed solution is given in Figure 3a.
Figure 3. Calibration plot of current determined by a) linear voltammetry (0.1 V s-1) and b)
sampled-current voltammetry on a single electrode of the array with (▲) and without (●)
stirring of the solution as a function of phenol concentration ranging from 10-3-10-2 mmol L-1
in a 0.1 mol L-1 NaOH aqueous solution. Corresponding current-potential curves obtained by
sampled-current voltammetry on a single electrode of the array c) without and d) with stirring
Accepted
of the solution. Sampling time: 0.02 s. Error bars are based on measurements performed on two
or three different arrays. Electrode surface area: 0.002 cm2
The obtained variation is clearly nonlinear with high error bars. Indeed, the thickness of the peak corresponding to the oxidation of phenol differs from one analysis to another, owning to the complicated oxidation process of phenol. This behavior strongly affects the peak current. For comparison with EASCV, similar experiments were carried out by sampled-current voltammetry on a single electrode with and without stirring of the solution (Figure 3b). The curves were also nonlinear with the loss of linearity for phenol concentrations between 2 and 4
10-3 mmol L-1, due to a competition between electrode fouling and the oxidation of phenol on
free electrode surface. A decrease of the current is also observed for concentrations higher than
6 10-3 mol L-1, showing a considerable influence of the passivation phenomenon on the
measurement. Stirring of the solution at the vicinity of the electrode led to a similar behavior,
whereas higher currents are obtained until 6 10-3 mol L-1 due to the increase of the transport
of phenol to the electrode surface. The current-potential curve shapes depicted in Figure 3c and
3d are clearly dependent on the concentration of phenol. Whereas a plateau is obtained at 10-3
mol L-1, higher concentrations of phenol led to the formation of a peak with decreasing width.
This phenomenon is due to electrode fouling that already affects the electrochemical signal at
a concentration of 2 10-3 mol L-1 in phenol. The current measured at the plateau or at the peak
to construct a calibration plot is clearly affected by electrode fouling.
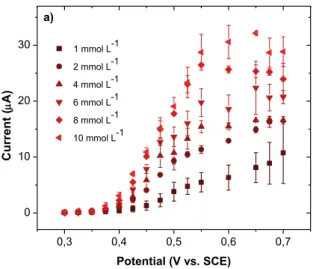
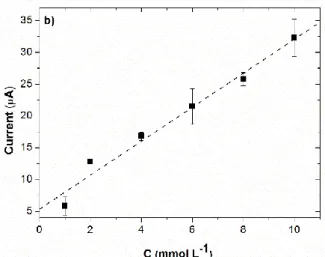
Figure 4a shows the current-potential curves obtained by sampled-current voltammetry on an electrode array (EASCV) for different concentrations of phenol.
0,3 0,4 0,5 0,6 0,7 0 10 20 30 1 mmol L-1 2 mmol L-1 4 mmol L-1 6 mmol L-1 8 mmol L-1 10 mmol L-1 C u rr en t ( A ) Potential (V vs. SCE) a)
Accepted
Manuscript
Figure 4. a) Current-potential curves of a solution of phenol with a concentration ranging from
10-3 to 10-2mol L-1 in a 0.1 mol L-1 NaOH aqueous solution obtained by EASCV for a sampling
time of 0.02 s b) corresponding calibration plot. Error bars are based on measurements performed on two or three different arrays.
For all considered concentrations, current-potential curves that could be easily overlapped by sigmoid functions are obtained. An increase of the current is visible for the lowest
concentrations of phenol (10-3 and 2 × 10⁻³ mol L-1) for potentials higher than 0.6 V/SCE,
corresponding to the formation of oxides on gold. The value of the limiting current estimated by a sigmoid fit (Table S2) vs the concentration of phenol is given in Figure 4b, showing the interest of EASCV to minimize the passivation phenomenon. A linear relationship is obtained with a regression coefficient of 0.989.
2.4 Modelling of sampled-current voltammetry on an electrode array with passivation
As seen in Figure 2b, when higher sampling times were used, the current-potential curves exhibit a peak instead of the expected plateau with decreasing values of limiting current in EASCV. For a better understanding of the role of the sampling time in EASCV, a modelling of
the current was performed. A model for passivation, previously proposed by Savéant et al.,[52]
is adopted here. In this model, we will consider a redox system consisting of a one-electron irreversible reaction between the reactant A and the product B (represented by Equation (I)
below) that is characterized by an apparent charge transfer standard rate constant ks.
Butler-Volmer law was considered for the electron-transfer kinetics and semi-infinite linear diffusion conditions are assumed to prevail. The passivation is treated as a competition between the
adsorption of species on the electrode surface with a rate constant kA (Equation II) and their
Accepted
reaction when diffusing in the bulk solution with a corresponding rate constant, kH (Equation
III).
Some other assumptions are made i) the surface area covered by C totally inhibits the reduction of A, ii) the reaction (equation III) is fast compared with diffusion (“pure kinetic” conditions). Normalized variables, functions and parameters giving rise to dimensionless formulation are
introduced by following the definition in Savéant et al.’s work:[52]
- Time : 𝜏 =𝜃𝑡 with the time characteristic of the experiment.
- Potential: 𝜉 =−𝐹𝑅𝑇(𝐸 − 𝐸0) with E the applied potential, E° the standard potential of the couple
A/B, T the temperature, R the gas constant, F the Faraday constant.
- Space: 𝑦 = 𝑥
√𝜃𝐷 with D the diffusion coefficient of A.
- Current without passivation: 𝜓 = 𝑖
𝐹𝑆𝐶𝐴°√𝐷𝜃
with S the initial electrode surface and CA° the
initial concentration of A.
- Concentration : 𝑎 = 𝐶𝐴
𝐶𝐴°
The fractional coverage of the electrode is defined as:
𝛺 = 𝑛𝐶
𝑛𝐶°=
𝛤
𝛤°= 1 −
𝑆
𝑆° with nC the number of moles of C on the surface and nC° the maximum
number of moles of C for a total coverage of the surface S°, 𝛤the surface concentration of C
and 𝛤 its maximum value.
Taking into account the current resulting from sampled-current voltammetry 𝜓 and the
passivation phenomenon characterized by 𝛺, the current 𝜓𝑓 obtained in sampled-current
voltammetry with passivation of the electrode is:[52]
𝜓𝑓 = (1 − Ω)𝜓 (1)
The resolution of the following system (the details for the calculations are provided in the Supporting Information) provides the value of the dimentionless current 𝜓:
𝜓𝑒−𝛼𝜉 Λ = 1 − 1 √𝜋∫ 𝜓(𝜂) √𝜏−𝜂 𝜏 0 𝑑𝜂 (2)
Accepted
Manuscript
𝛺 = 𝑝 ∫ (1 −0𝜏 𝛺)𝜓𝑑𝜏 (3)
𝜓𝑓= (1 − Ω)𝜓
𝜓 only depends on two independent parameters 𝛬 and p :
𝛬 = 𝑘𝑠√𝜃𝐷= 𝛬°√𝜃
p = 𝑘 𝑘𝐴 𝐴+√𝐷𝑘𝐻
𝐶°√𝐷𝜃
𝜞° = 𝑝°√𝜃
Thus, p is a parameter characteristic of the passivation phenomenon. Indeed, it depends on the
two rate constants kH and kA of the reactions (II) and (III), respectively. A low value of p is
obtained when the reaction of B is prominent (kA << kH) and a high value is due to a high
passivation phenomenon (kA >> kH). To observe the effect of p on the electrochemical response,
the calculated dimentionless current-potentiel curves are displayed for different values of p in Figure 5a. It is noticeable that a peak is predicted by calculations as observed in the experimental curves (Figure 2b). When p is low, a sigmoid curve is obtained and conversely, when p is high, the current-potential curve has a peak shape. These results underline that the appearance of a peak is directly linked to the adsorption of species on the electrode surface.
Accepted
Figure 5. a) Modelled current-potential curves in adimensional parameters (𝜓𝑓 = f(ξ’), ξ’ see
definition in Supporting Information) for different values of p b) Effect of the parameter p on
ff for f ° the value of f when p=0 c) Comparison of modelled and experimental data
obtained by EASCV. (____)Experimental I-E curves obtained for a 10-3 mol L-1 phenol aqueous
solution in 0.1 mol L-1 NaOH for different sampling times, (____) modelled I- 𝜃 curves for
different potentials.
Similarly, curves relating the ratio f/f° (f° the current for p = 0) with log p for different
values of ’ are given in Figure 5b. For low values of p, ftends tof°, as expected when no
passivation phenomenon occurs. When p increases, the current decreases owning to a higher
blockage of the electrode. For values of ’ lower than -6, the ratio f/f° tends to 1, even for
high values of p, but the current is too low to be used. As seen in Figure 5a, when ’ increases, the effect of the passivation becomes more pronounced but a maximum is observed. Because the influence of the passivation depends on both the parameter p and ’, it is possible to optimize the sensitivity of the detection by a judicious choice of the sampling time and applied potential. For example, for p = 2.1, if a potential is chosen as ’= -1, i.e. close to the maximum values of
current (see Figure 5a), f is increased by approximatively 5 compared with the value of f for
’> 2. Similarly, in terms of sampling time, for ’= 0 and log p = 0 (Figure 5b), a decrease of
𝜃 by a factor of 100 leads to a ratio f/f° close to one, i.e. almost without attenuation of the
current. The effect of the sampling time on the current is even more pronounced when log p is higher than 0.
Calculated curves were adjusted to fit the experimental data performed with a 10-2 mol L-1
solution of phenol in 0.1 mol L-1 NaOH (Figure 5c). Experimental currents are derived from
the dimensionless currents for different experimental time using the following relation: 𝐼 =
Accepted
𝜓𝑓(𝜏 = 1)𝐹𝑆𝐶°√(𝐷/𝜃) that provides the current versus time curve I=f() at a constant potential. A good agreement is obtained between the model and the experimental data for all
experimental times using a single set of parameters (𝜉° = 9.5 and 𝑝° = 5.7). As seen
experimentally, the plateau corresponding to the limiting current is observed for short experimental sampling times and a peak appears when increasing 𝜃. According to Figure 2, a sampling time lower than 0.02 s is necessary to significantly minimize the attenuation of the current by the passivation of the electrode. Such value of the experimental time is compatible with the time response of the commercially available potentiostats, meaning that even if strong electrode fouling occurs as in the example of phenol considered in our work, EASCV is an efficient way to minimize the effect.
3. Conclusions
Sampled-current voltammetry on an electrode array (EASCV) is an efficient method to minimize electrode passivation. It allows reproducible detection and quantification of species that leads to electrode fouling, as illustrated in this work with phenol, a compound that leads to a fast and efficient passivation of the electrode surface during its analysis. Electrode arrays with good surface area reproducibility were prepared by conventional photolithography that is a simple and mass-production method. Modelling of EASCV allows a deeper understanding of the passivation phenomenon occurring during the analysis. Curves relating the electrochemical signal to a parameter p characteristic of the passivation phenomenon were achieved, underlining the importance of the choice of the sampling time and the potential that would strongly minimize the passivation of the electrode. A sampling time of 0.02 s is enough to prevent the attenuation of the current by the passivation of the electrode and allows the establishment of a linear calibration plot. Such a value of the experimental time is compatible with the time response of the commercially available potentiostats. The method can be generalized to all species that leads to electrode fouling and bring an alternative to destructive methods for their analysis in relatively high concentrations.
Experimental Section
Microfabrication
Accepted
Standard microfabrication methods and equipment were used to satisfy the strict purity requirements for sensitive electrochemical detection and to maintain a strict reproducible response of the final sensor. A cleanroom microfabrication process is described in four steps. The first step involves patterning gold on an electrode array (Figure 6a) on 0.8 mm thick glass substrates.
Figure 6. a) Electrode array prepared by photolithography b) Electrochemical two-part cell
adapted to the electrode array.
To ensure high purity, the substrates were cleaned using 1% (v/v) Hellmanex® solution in
deionized water for one hour in an ultrasound bath at 40°C and then rinsed abundantly in deionized water followed by 13 min of plasma cleaning. Titanium and gold were sequentially
deposited by thermal evaporation (Plassys ME300) under high vacuum (P < 5 × 10⁻⁵ mbar) on
the cleaned substrates. A thin layer of titanium (30 nm) was first deposited on a glass wafer by
thermal vapor deposition, to ensure adhesion of the gold layer on the glass substrate.[53] The
thickness of the gold layer was chosen to be 200 nm, to assure a good quality of gold for electrochemical analyses. All metals used for the photolithography process were 99.99% quality, supplied by Neyco, SA. In the second step, the electrode array was patterned by photolithography using Shipley S1818 positive tone photoresist deposited by spin coating (Figure S3). After 50 s in a developer bath to wash out the resin, the metal was chemically
Accepted
etched using titanium and gold etchants (Very Large Scale Integration quality). This second step ends with the removal of the polymerized resin. The wafer was dried under argon and cleaned for 13 min using a plasma cleaner. In the third step, the patterns were electrically insulated (Figure S4) using coating by a silicon nitride film deposited by Plasma Enhanced
Chemical Vapor Deposition using a SiH4 and N2 mixture (280°C, 30 W). Another thin layer of
titanium (30 nm) was added before the insulating layer of Si3N4 (600 nm) to protect gold from
oxidation in air and improve the adherence of Si3N4[54-56] and to facilitate the patterning of the
Si3N4 layer by the plasma treatment. Finally, the Si3N4 insulator was patterned by
photolithography (the same process as that described with the Shipley S1818 positive tone
photoresist was followed) and etched by a SF6 Reactive Ion Etching process to achieve the
electrode array, using 60 sccm SF6 at 2 × 10⁻² mbar and 150 W radiofrequency power for 25
min and 100 W radiofrequency power for 5 min. The titanium layer was also etched by the SF6
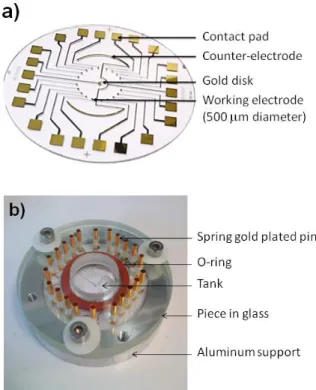
reacting ion etching process, avoiding the introduction of an additional step in the process to remove it. The nature of the insulating layer has been chosen to support both organic and aqueous media. Thus, the electrode array including twenty working electrodes (500 µm diameter), the counter electrode (two circular arcs with a width of 500 µm and a length of 2 cm) and the reference electrode (1000 µm diameter) was defined, as well as the pads for connection to the external potentiostat. The substrate was positioned in a two-part cell (Figure 6b), the lower aluminum part of which accommodates the electrode array and the upper glass part provides electrical contacts through pogo pins. At the end of this process the residual resin was removed and the electrode array was cleaned for 13 min using a plasma cleaner.
Cleaning step
The working electrodes of the array prepared by photolithography were cleaned in acetone with soft stirring (50 rpm) for 5 min and rinsed with ultrapure water. After drying with argon, they were exposed for 25 min under ozone/UV. The electrodes were then rinsed twice with acetone, acetonitrile for 5 min and ethanol for 5 min, followed by copious ultrapure water. The electrodes were then dried with argon. Finally, all the working electrodes were connected together and cyclic voltammetry was performed from 1.5 to -1 V against a saturated calomel electrode (SCE)
until a stable electrochemical signal was obtained in a 0.5 mol L-1 phosphate buffer, pH 7.2.
After the analysis of phenol, the electrode array was regenerated by dipping it in concentrated
HNO3 for 20 min and then carefully washed with ultrapure water.
Accepted
Electrochemical analyses
Electrochemical experiments were performed in a homemade cell (Figure 6b). After positioning the electrode array on an aluminum support, it was covered by a piece of glass containing 22 spring gold plated pins for electrical contacts and a 15 mm diameter tank as an analyte reservoir. The tank was sealed using an O-ring that was clamped between the aluminum support and the piece in glass. The electrochemical analyses were performed in a standard three-electrode configuration, with a platinum wire counter electrode and a saturated calomel reference electrode. These counter and reference electrodes were used in this first work to avoid any complication due to contamination of the integrated counter and reference electrodes of the array. The 20 gold electrodes (0.2 mm²) of the array were used as working electrodes. All electrochemical experiments were performed at room temperature (25°C) without any degassing. Cyclic voltammetry and chronoamperometry experiments were carried out using a
VersaSTAT3 AMETEK® Model potentiostat/galvanostat with a VersaSTAT LC Low Current
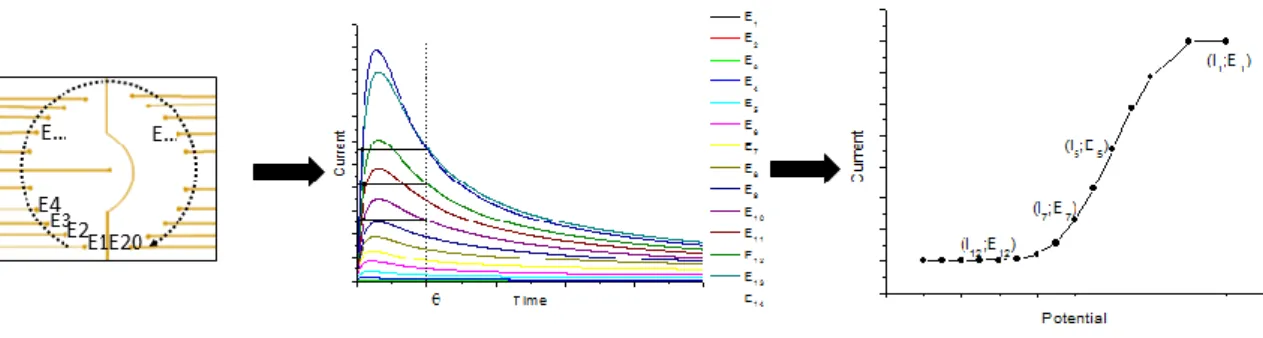
Interface (Princeton Applied Research) and the versaStudio Software. I vs. E curves were obtained by applying sampled-current voltammetry on the electrode array by the following procedure (Figure 7): a potential En (n = 1 up to a maximum of 20, corresponding to the number
of electrodes on the array) was applied sequentially to the nth electrode of the array.[49] The
value of the current response In was measured after a sampling time ranging from 0.01 to 0.1 s. The resulting current-potential curve (In-En) was drawn. To simplify, this method is called sampled-current voltammetry on an electrode array (EASCV).
Figure 7. Principe of sampled-current voltammetry on an electrode array (EASCV)
Supporting information
Accepted
Preparation and characterization of the electrode array, data corresponding to the overlapping of the experimental curves by sigmoid functions and details of the calculations for the modelling of EASCV, Figures S1, S2, S3, S4, S5, S6 and Tables S1, S2.
Acknowledgments
We gratefully acknowledge Manuel Bouillon for his help in C language programming.
References
[1] M. M. Zourob, S. H. H. Eissa, Anal. Chem. 2017, 89, 3138–3145.
[2] D. Wang, J. Chen, S. R. Nugen, Anal. Chem. 2017, 89, 1650–1657.
[3] B. G. Mahmoud, M. Khairy, F. A. Rashwan, C. E. Banks, Anal. Chem. 2017, 89, 2170–
2178.
[4] B. L. Hanssen, S. Siraj, D. K. Y. Wong, Rev. Anal. Chem. 2016, 35, 1-28.
[5] T. Xiao, F. Wu, J. Hao, M. Zhang, P. Yu, L. Mao, Anal. Chem. 2017, 89, 300-313.
[6] X. Yang, J. Kirsch, J. Fergus, A. Simonian, Electrochim. Acta 2013, 94, 259-268.
[7] P. J. Vandeberg, J. L. Kowagoe, D. C. Johnson, Anal. Chim. Acta 1992, 260, 1-11.
[8] R. F. Lane, A. T. Hubbard, Anal. Chem. 1976, 48, 1287-1292.
[9] J. Moiroux, P. J. Elving, J. Electroanal. Chem. Interfacial Electrochem. 1979, 102,
93-108.
[10] A. Barberis, Y. Spissu, G. Bazzu, A. Fadda, E. Azara, D. Sanna, M. Schirra, P. A. Serra,
Anal. Chem. 2014, 86, 8727-8734.
[11] A. J. Downard, Electroanalysis 2000, 12, 1085-1096.
[12] D. Belanger, J. Pinson, Chem. Soc. Rev. 2011, 40, 3995-4048.
[13] R. Nissim, R. G. Compton, Analyst 2014, 139, 5911-5918.
[14] J. Wang, R. P. Deo, M. Musameh, Electroanalysis 2003, 15, 1830-1834.
[15] E. J. E. Stuart, M. Pumera, J. Phys. Chem. C 2011, 115, 5530-5534.
[16] D. Vega, L. Aguei, A. Gonzalez-Cortes, P. Yanez-Sedeno, J. M. Pingarron, Talanta
2007, 71, 1031-1038.
[17] B. E. K. Swamy, B. J. Venton, Analyst 2007, 132, 876-884.
[18] C. Yang, C. B. Jacobs, M. D. Nguyen, M. Ganesana, A. G. Zestos, I. N. Ivanov, A. A.
Puretzky, C. M. Rouleau, D. B. Geohegan, B. J. Venton, Anal. Chem. 2016, 88, 645-652.
Accepted
[19] C. Terashima, T. N. Rao, B. V. Sarada, D. A. Tryk, A. Fujishima, Anal. Chem. 2002,
74, 895-902.
[20] T. N. Rao, B. H. Loo, B. V. Sarada, C. Terashima, A. Fujishima, Anal. Chem. 2002, 74,
1578-1583.
[21] G. W. Muna, V. Quaiserova-Mocko, G. M. Swain, Anal. Chem. 2005, 77, 6542-6548.
[22] G. W. Muna, N. Tasheva, G. M. Swain, Environ. Sci. Technol. 2004, 38, 3674-3682.
[23] C. Prado, G. G. Murcott, F. Marken, J. S. Foord, R. G. Compton, Electroanalysis 2002,
14, 975-979.
[24] Y. Lei, G. Zhao, M. Liu, X. Xiao, Y. Tang, D. Li, Electroanalysis 2007, 19, 1933-1938.
[25] H. Dejmkova, M. Scampicchio, J. Zima, J. Barek, S. Mannino, Electroanalysis 2009,
21, 1014-1018.
[26] M. A. Ajeel, M. K. Aroua, W. M. A. W. Daud, Electrochim. Acta 2015, 153, 379-384.
[27] C. E. Banks, R. G. Compton, Analyst 2005, 130, 1232-1239.
[28] E. Mazzotta, C. Malitesta, E. Margapoti, Anal. Bioanal. Chem. 2013, 405, 3587-3592.
[29] J. Wang, R. Li, Anal. Chem. 1989, 61, 2809-2811.
[30] W. Lu, G. G. Wallace, M. D. Imisides, Electroanalysis 2002, 14, 325-332.
[31] M. A. Heras, S. Lupu, L. Pigani, C. Pirvu, R. Seeber, F. Terzi, C. Zanardi, Electrochim.
Acta 2005, 50, 1685-1691.
[32] X. Yang, J. Kirsch, E. V. Olsen, J. W. Fergus, A. L. Simonian, Sens. Actuators, B 2013,
177, 659-667.
[33] J. Hao, T. Xiao, F. Wu, P. Yu, L. Mao, Anal. Chem. 2016, 88, 11238-11243.
[34] F. Yan, B. Su, Anal. Chem. 2016, 88, 11001-11006.
[35] X. Huang, L. Xie, X. Lin, B. Su, Anal. Chem. 2017, 89, 945-951.
[36] Q. Sun, F. Yan, L. Yao, B. Su, Anal. Chem. 2016, 88, 8364-8368.
[37] S. Alwarappan, K. S. A. Butcher, D. K. Y. Wong, Sens. Actuators, B 2007, 128,
299-305.
[38] T. Goto, T. Yasukawa, K. Kanda, S. Matsui, F. Mizutani, Anal. Sci. 2011, 27, 91-94.
[39] L. M. Fischer, M. Tenje, A. R. Heiskanen, N. Masuda, J. Castillo, A. Bentien, J.
Emneus, M. H. Jakobsen, A. Boisen, Microelectron. Eng. 2009, 86, 1282-1285.
[40] J.-Q. Xu, Y.-L. Liu, Q. Wang, H.-H. Duo, X.-W. Zhang, Y.-T. Li, W.-H. Huang, Angew.
Chem., Int. Ed. 2015, 54, 14402-14406.
[41] B. Sljukic, C. E. Banks, A. Crossley, R. G. Compton, Anal. Chim. Acta 2007, 587,
240-246.
Accepted
[42] A. Bebeselea, F. Manea, G. Burtica, L. Nagy, G. Nagy, Talanta 2010, 80, 1068-1072.
[43] B. Feier, D. Floner, C. Cristea, R. Sandulescu, F. Geneste, Electrochem. Commun. 2013,
31, 13-15.
[44] R. Nasraoui, D. Floner, F. Geneste, J. Electroanal. Chem. 2009, 629, 30-34.
[45] R. Nasraoui, D. Floner, F. Geneste, Electrochem. Commun. 2010, 12, 98-100.
[46] B. Feier, I. Fizesan, C. Meriadec, S. Ababou Girard, C. Cristea, R. Sandulescu, F.
Geneste, J. Electroanal. Chem. 2015, 744, 1-7.
[47] M. Pontie, H. Lecture, F. Bedioui, Sens. Actuators, B 1999, 56, 1-5.
[48] A. Wong, E. M. Materon, M. D. P. T. Sotomayor, Electrochim. Acta 2014, 146,
830-837.
[49] L. Mignard, M. Denoual, O. Lavastre, D. Floner, F. Geneste, J. Electroanal. Chem.
2013, 689, 83-87.
[50] P. Hapiot, J. Pinson, N. Yousfi, New J. Chem. 1992, 16, 877-881.
[51] J.-M. Saveant, Elements of Molecular and Biomolecular Electrochemistry: An
Electrochemical Approach to Electron Transfer Chemistry, Wiley-Interscience, New
Jersey, 2006.
[52] I. Bhugun, J.-M. Saveant, J. Electroanal. Chem. 1995, 395, 127-131.
[53] N. A. M. Yunus, N. G. Green, Microsystem Technologies 2010, 16, 2099-2107.
[54] E. M. F. Vieira, J. F. Ribeiro, R. Sousa, M. M. Silva, L. Dupont, L. M. Goncalves, J.
Electron. Mater. 2016, 45, 910-916.
[55] V. V. Tsukruk, V. N. Bliznyuk, Langmuir 1998, 14, 446-455.
[56] T. Ederth, Langmuir 2001, 17, 3329-3340.