Title: considering uncertainties in shear strength parameters Auteurs:
Authors: Mathilde Cordier et Pierre Léger Date: 2018
Type: Article de revue / Journal article Référence:
Citation:
Cordier, M. & Léger, P. (2018). Structural stability of gravity dams: a progressive assessment considering uncertainties in shear strength parameters. Georisk:
Assessment and Management of Risk for Engineered Systems and Geohazards, 12(2), p. 109-122. doi:10.1080/17499518.2017.1395464
Document en libre accès dans PolyPublie Open Access document in PolyPublie
URL de PolyPublie:
PolyPublie URL: https://publications.polymtl.ca/5615/
Version: Version finale avant publication / Accepted version Révisé par les pairs / Refereed Conditions d’utilisation:
Terms of Use: Tous droits réservés / All rights reserved
Document publié chez l’éditeur officiel
Document issued by the official publisher
Titre de la revue:
Journal Title:
Georisk: Assessment and Management of Risk for Engineered Systems and Geohazards (vol. 12, no 2)
Maison d’édition:
Publisher: Taylor & Francis
URL officiel:
Official URL: https://doi.org/10.1080/17499518.2017.1395464
Mention légale:
Legal notice:
This is an Accepted Manuscript of an article published by Taylor & Francis in Georisk: Assessment and Management of Risk for Engineered Systems and Geohazards on 2018, available online: https://doi.org/10.1080/17499518.2017.1395464
Ce fichier a été téléchargé à partir de PolyPublie, le dépôt institutionnel de Polytechnique Montréal
Structural stability of gravity dams: a progressive assessment considering uncertainties in shear strength
parameters
Journal: Georisk
Manuscript ID NGRK-2017-0020.R1 Manuscript Type: Original Article Date Submitted by the Author: n/a
Complete List of Authors: Cordier, Mathilde; Ecole Polytechnique de Montreal Departement des Genies Civil Geologique et des Mines
Leger, Pierre; Ecole Polytechnique de Montreal Departement des Genies Civil Geologique et des Mines,
Keywords: dam safety, uncertainty, factor of safety, reliability analysis, Monte Carlo simulation
For Peer Review Only
Abstract
Structural sliding stability of gravity dams is most often quantified using a binary
safe/unsafe criterion such that the shear resistance has to be larger than the driving shear
load. Large deterministic factors of safety, FSdet (e.g. 3 in normal condition), are used in
existing guidelines to guard against material and loads uncertainties. Some guidelines
allow an arbitrary reduction in FSdet (e.g. 2) when the knowledge in strength parameters
increases from material test data. Yet, those reduced FSdet are not based on a rational
consideration of uncertainties. Propagation of uncertainties could be done using
comprehensive probabilistic analyses, such as Monte-Carlo simulations (MC). However,
MC are complex and challenging for practical use. There is thus a need to develop
simplified reliability based safety assessment procedures that could rationalise the
adjustment of FSdet from existing dam safety guidelines. This paper presents a progressive
analysis methodology using four existing safety evaluation formats of increasing
complexity: (i) deterministic, (ii) semi-probabilistic (partial coefficient), (iii) reliability
based Adjustable Factor of Safety (AFS), and (iv) probabilistic (MC). Comprehensive
comparisons are made for the sliding safety evaluation of a 80 m gravity dam. Results are
presented in terms of sliding factors of safety, allowable water levels, and demand/capacity
(load and resistance) ratios. It is shown that the reliability based AFS formulation, using
direct integration, is simple and practical to use in complement to existing dam safety
guidelines before undertaking MC simulations. AFS yielded results with a maximum
difference of approximately 10% as compared to rigorous MC probabilistic analyses.
3 4 5 6 7 8 9 10 11 12 13 14 15 16 17 18 19 20 21 22 23 24 25 26 27 28 29 30 31 32 33 34 35 36 37 38 39 40 41 42 43 44 45 46 47 48 49 50 51 52 53 54 55 56
materials and the magnitude of anticipated floods evolve with advances in predictive
methodologies and changes in the environment. The structural stability of major dams
needs to be re-evaluated every 5-10 years according to Hazard Classification Systems
(HCS), most often within the legal framework of a governmental regulatory agency.
Structural stability against sliding should satisfy a binary safe/unsafe limit-state stating that
the shear resistance, R, has to be strictly larger than or equal to the driving shear load, L.
To guard against uncertainties in R and L, large deterministic factors of safety (FSdet) are
used. These large FSdet may be reduced when new knowledge about the material shear
strength parameters is acquired to better quantify the friction coefficient and cohesion. For
instance, in CDA (2007), FSdet = 3 if no material test is available, and FSdet = 2 if tests are
done. A better knowledge of strength parameters thus authorises a reduced safety margin.
However, the specified FSdet numerical values are rounded numbers fromexperience and
not from a rational approach to quantify reduction in strength parameters uncertainties.
There is thus a need to develop, validate and verify simplified reliability based safety
assessment procedures that could rationalise the FSdet adjustment by referring to data bases
developed from evaluating L and R uncertainties readily available from countless test series
and load statistics (Kreuzer and Léger 2013). Simplified methods should be robust,
18 19 20 21 22 23 24 25 26 27 28 29 30 31 32 33 34 35 36 37 38 39 40 41 42 43 44 45 46 47 48 49 50 51 52 53 54 55 56 57 58
For Peer Review Only
computationally efficient, with a limited number of random variables, and easily
interpretable. They then can replace the deterministic L and R parameters. Moreover,
reliability based safety assessment will also answer a societal aspect in form of relating the
required safety margin to a HCS used by the dam safety regulations of the particular
country. Of course, comprehensive reliability based probabilistic analyses could be
undertaken to propagate uncertainties in structural stability analyses. However,
comprehensive probabilistic analyses (e.g. Monte Carlo (MC) simulations) require
extensive time, sophisticated tools, expertise and resources that are most often not
available. To adjust the required safety margin as a function of a reduction in shear strength
uncertainties, this paper presents a progressive analysis methodology of increasing
complexity and accuracy. It consists in applying successively (i) deterministic analyses,
(ii) simplified reliability based Adjustable Factor of Safety (AFS) analyses, and (iii) full
probabilistic analyses (crude MC). The main objective of the paper is to establish the range
of AFS modelling parameters for which coherent results could obtained with MC
simulations that are used as reference values.
This paper is organised as follows. After the review of literature in section 2, section 3
describes four different safety formats: (i) deterministic, (ii) semi-probabilistic (partial
coefficient), (iii) reliability based AFS, and (iv) probabilistic (MC). Comprehensive
comparisons of the four safety evaluation formats are done by comparing sliding stability
indicators of a 80 m-high gravity dam, studied in a previous ICOLD numerical Benchmark
seeking to quantify the sliding probability of failure, pf, as a function of the upstream
reservoir water elevation, Hw (Escuder-Bueno et al., 2011).It is shown that coherent results,
as compared to MC, could be obtained while using the AFS method when the required
3 4 5 6 7 8 9 10 11 12 13 14 15 16 17 18 19 20 21 22 23 24 25 26 27 28 29 30 31 32 33 34 35 36 37 38 39 40 41 42 43 44 45 46 47 48 49 50 51 52 53 54 55 56
additional safety margin is deemed necessary to account for ignorance, or lack of
information in spite of having considered uncertainties with all AFS factors (Kreuzer and
Leger 2013).
2. Stability assessment of gravity dams considering uncertainty analysis
One can solve the gravity dam stability problem as a deterministic one where there is no
uncertainty. At the other end of the spectrum, total ignorance of phenomena that may affect
stability, and its outcome, cannot be quantified because classification and identification of
what is unknown is not possible (Riley, Webley and Thomson 2017; D. Rumsfeld famous
deep "unknown-unknown" uncertainty; Baecher 2016). We will therefore focus our
analysis on epistemic and aleatory uncertainties in input data (friction coefficient and
cohesion) that admit statistical descriptions from a frequentist point of view.
Deterministic analysis is traditionally used to assess the stability of dams (ANCOLD 2013; CDA 2007; FERC 2002; Ruggeri 2004; USBR 1976; USACE 1995, 2005). Deterministic
methods do not allow accounting explicitly for uncertainties in strength capacity and load
effects (stresses). Moreover, deterministic FSs are round numbers without rational
safety-relevant significance, apart from grading them to the frequency of load combination (usual,
18 19 20 21 22 23 24 25 26 27 28 29 30 31 32 33 34 35 36 37 38 39 40 41 42 43 44 45 46 47 48 49 50 51 52 53 54 55 56 57 58
For Peer Review Only
unusual, extreme).There is thus a huge interest in the profession to move towards more
refined methods to consider uncertainties.
Probabilistic analysis allows considering nature’s randomness, and human incomplete knowledge within the probabilistic safety evaluation. Mathematical constructs are used
normally presented by probability density functions and engineering judgment. Then,
comparisons between several failure scenarios are possible while assessing probability of
failure, pf, and related risk according to the consequence model. Probabilistic methods are
thus very useful tool to decision-making (Bury and Kreuzer 1985; FERC 2014).
Probabilistic risk analysis, and associated risk management, are used for other civil
structures and are now in active development in dam engineering (Baecher 2016; FERC
2014; Hartford and Baecher 2004; Hartford et al. 2016; Kalinina et al. 2016; Peyras et al.
2010; Peyras et al. 2012; SPANCOLD 2013; Westberg Wilde and Johansson 2016; Zhang
et al. 2016). As dam engineering is moving towards models accounting for uncertainties,
ICOLD organized an International Benchmark Workshop on Numerical Analysis of Dams
in 2011 to examine probabilistic analysis (Escuder-Bueno et al., 2011). A new ICOLD
Benchmark on Risk Assessment took place in 2017 (Johansson et al. 2017). Risk
assessment uses probabilistic methods, and consists (i) to combine failure modes to
determine a failure scenario by using event or failure trees, (ii) to model failure modes, (iii)
to assess the failure probability for each failure mode, (iv) to deduce the total damfailure
probabilities. The concept of "As Low As Reasonably Possible (ALARP)" is then used in
several dam safety guidelines to answer the difficult question "How safe is safe enough?"
(Bowles 2007). ALARP is used to accept or reject the resulting failure probability and
related consequences. Recognising that absolute safety cannot be achieved, the
3 4 5 6 7 8 9 10 11 12 13 14 15 16 17 18 19 20 21 22 23 24 25 26 27 28 29 30 31 32 33 34 35 36 37 38 39 40 41 42 43 44 45 46 47 48 49 50 51 52 53 54 55 56
(Luhmann 2005).
A probabilistic analysis could account for uncertainties in cohesion, friction, drain
efficiency, and several other parameters as shown in Altarejos-Garcia et al. (2015, 2012).
Probabilistic analysis also allows reliability assessment of dam-foundation-reservoir
systems (Westberg Wilde and Johansson 2013). In reliability based safety assessment,
fragility analysis, first used in seismic evaluation of nuclear power plants, is a key step
(Porter 2017). Fragility analysis is the computation of the probability to reach an
undesirable limit-state for a known loading intensity. Fragility curves, expressed as
function of reservoir elevation, Hw, provide quantitative cumulative distribution functions
for the dam to resist sliding. Fragility curves provides a rational tool that could be used to
compare several remedial options if a need for strengthening is identified (Ebeling et al.
2012; Ellingwood and Tekie 2001; Tekie 2002).
However, probabilistic assessments require many parameters to describe uncertainties,
such as random variables, Probability Density Functions (PDF), PDF bounds, coefficients
of variation, which may affect substantially the analysis results as shown by the wide
dispersion in fragility curves computed from the participants in the ICOLD Benchmark
(Escuder-Bueno et al. 2016). Then, the decision to take remedial action, if necessary,
18 19 20 21 22 23 24 25 26 27 28 29 30 31 32 33 34 35 36 37 38 39 40 41 42 43 44 45 46 47 48 49 50 51 52 53 54 55 56 57 58
For Peer Review Only
depends on a complex and possibly not unique assessment: one may wonder about limits
of reliability methods, which are finally not the unerring reference (Kreuzer 2000, 2003).
Semi-probabilistic (partial coefficient) analysis is a first simplified approach that allows considering uncertainties according to each load and resistance parameter (ANCOLD
1991; CFBR 2013, 2015; IS 1984-1998; Peyras et al. 2008; Rocha 1974; SPANCOLD
2003). Partial safety coefficients are ideally calibrated according to probabilistic analyses.
However, each dam is a unique hydro-geomechanical system. Calibration may not be based
on consistent sampling, but adapted to correspond to existing structures designed with
deterministic methods (Jongejan and Calle 2013; Kovarik 2000). In the Netherlands, the
National Flood Risk Analysis project developed recommendations evolving from
deterministic to semi-probabilistic analysis to assess stability of hydraulic structures
(levees), using probabilistic analysis to calibrate coefficients according to target failure
probability, pf* (Jongejan and Maaskant 2013; Vergouwe 2016).
Adjustable Factor of Safety (AFS) analysis is another simplified and practical way to perform probabilistically (reliability) based safety assessment. AFS considers only two
basic random variables, the resistance R and the load, L. AFS is seeking a binary outcome
such that AFS ≥ FSreq, where FSreq is depending on a user defined target pf* or a target
reliability index, β*. As described in more details in section 3, AFS connects R and L within a probabilistic framework using their PDF along with six uncertainty factors calibrated on
empirical evidences, including coefficients of variations as well as upper (for L) or lower
(for R) PDF bounds (Kreuzer and Léger 2013).
3 4 5 6 7 8 9 10 11 12 13 14 15 16 17 18 19 20 21 22 23 24 25 26 27 28 29 30 31 32 33 34 35 36 37 38 39 40 41 42 43 44 45 46 47 48 49 50 51 52 53 54 55 56
may be undertaken if deemed necessary.
3. Specification for required safety margins in investigated safety evaluation formats 3.1 Deterministic
Deterministic analysis is traditionally used to design and assess dam stability. It consists in
defining a factor of safety (FS) between the dam’s resistance R and the loading L from
𝐹𝐹𝐹𝐹 = 𝑅𝑅/𝐿𝐿, and to compare it to required values according to applicable guidelines. The gravity method and Mohr-Coulomb criterion are most often employed to define the shear
strength resistance to compute sliding FS. Typically, three values for resistance are
considered in parametric study: best estimate, lower bound, and upper bound. Different
load combinations are considered, only those associated with water levels are studied
herein: usual, unusual, and extreme (flood). Moreover, required FS relate to
dam-foundation interface and lift joints.
Some guidelines require FS without any consideration to the level of knowledge about
strength parameters (Table 1). Some other guidelines recommend FS considering the level
of knowledge in strength parameters. The required FS are larger if no material tests have
been realised (Table 2).
18 19 20 21 22 23 24 25 26 27 28 29 30 31 32 33 34 35 36 37 38 39 40 41 42 43 44 45 46 47 48 49 50 51 52 53 54 55 56 57 58
For Peer Review Only
Table 1. Required deterministic factors of safety without any explicit consideration of uncertainties.
Load combination
Required factor of safety
UBSR (1976) USACE (1995) FERC (2002) (a)(b) Usual 3.0 2.0 3.0 Unusual 2.0 1.7 2.0 Extreme 1.0 1.3 -
(a) Dams are categorised according to the consequences of a failure: the coefficients are for a dam with moderate
to high risks.
(b) Other FS are required for friction only (cohesion is null).
Table 2. Required deterministic factors of safety depending on the level of knowledge of strength parameters.
Load combi-nation
Required factor of safety
CDA (2007) (a) ANCOLD (2013) (a) USACE (2005) (b) Knowledge? No t est s W ith te sts No t we ll-d efin ed (c) We ll-d efin ed (c) We ll-d efin ed (d ) O rdi nar y Usual 3.0 2.0 3.0 2.0 2.0 1.7 Unusual 2.0 1.5 2.0 1.5 1.5 1.3 Extreme 1.3 1.1 1.5 1.3 1.1 1.1
(a) Other FS are required for friction only (CDA 2007) or residual values for C, tanϕ (ANCOLD 2013).
(b) Dams are categorised according to the consequences of a failure: the FS are for a dam with moderate to high
risks.
(c) According to ANCOLD (2013), "well-defined" means that "a sufficient number of tests have been done to
specify the strength parameters with reasonable certainty (e.g. assumed strength is exceeded by 80% of the test results from a test regime involving a significant number of tests)".
(d) According to USACE (2005), site information is "well-defined" when records are available, dam is monitored,
uplift are known, and "foundation strengths can be established with a high level of confidence".
3.2 Semi-probabilistic (partial coefficients)
Rocha (1974) suggested to introduce partial safety coefficients for friction and cohesion
instead of a single FS. This approach is to account for different levels of uncertainties in
these two shear strength mechanisms. Divisor coefficients of 1.5 to 2, and 3 to 5, could be
applied respectively to the friction coefficient, tanϕ, and the cohesion, C. It is thus recognised that uncertainties in cohesion are more important than in friction, whereas there
3 4 5 6 7 8 9 10 11 12 13 14 15 16 17 18 19 20 21 22 23 24 25 26 27 28 29 30 31 32 33 34 35 36 37 38 39 40 41 42 43 44 45 46 47 48 49 50 51 52 53 54 55 56
probabilistic methods, and adapted to existing structures designed with deterministic
analysis (Jongejan and Calle 2013; Kovarik 2000).
Table 3. Semi-probabilistic partial safety coefficients
Load combination
Partial safety coefficients
IS (1984-1998) SPANCOLD (2003) (b) CFBR (2013) ANCOLD (1991) (c)
γC(a) γtanϕ γC γtanϕ γC γtanϕ Strength Load (d)
Usual 3.6 1.5 5.0 1.5 3.0 1.5 0.3
Unusual 3.6 1.5 4.0 1.2 2.0 1.2 0.4 Extreme – flood 1.2 1.0 3.0 > 1.0 1.0 1.0 0.8
(a) C is the cohesion, tanϕ is the friction coefficient; γ
C and γtanϕ are associated partial safety coefficients such that
semi-probabilistic sliding stability limit-state criterion is: Ac.C/γC+V.tanϕ γ⁄ tanϕ
L > 1.0 where V is the sum of vertical
forces, Ac the compressed sliding area, L the hydrostatic thrust (IS 1984-1998; SPANCOLD 2003; CFBR 2013). (b) Dams are categorised according to the consequences of failure: the coefficients are for a dam with moderate to
high risks.
(c) Multiplier coefficients applied to strength and load parameters to compute R’ and L’ such that semi-probabilistic
sliding stability limit-state criterion is: 𝑅𝑅′ > 𝐿𝐿′ (ANCOLD 1991).
(d) Coefficients for loads are 0.95 for water and known dead loads contributing to stability, 0.90 for not
well-known concrete weight, 1.05 for water, uplift and dead loads contributing to instability, 1.50 for live and silt loads contributing to instability.
3.3 Probabilistic
Deterministic FS and partial safety coefficients do not inform about the safety margin
including uncertainties about parameters employed in analysis. Probabilistic analysis
allows to compute a failure probability, pf, considering mathematically uncertainties. HCS
have been developed to differentiate structures according to the consequences a failure.
18 19 20 21 22 23 24 25 26 27 28 29 30 31 32 33 34 35 36 37 38 39 40 41 42 43 44 45 46 47 48 49 50 51 52 53 54 55 56 57 58
For Peer Review Only
The ALARP concept has often been used to link loss of human lives (or persons in danger),
more than material costs of consequences, to recommended acceptable failure probability
(Figure 1).
Figure 1. Concept of "As Low As Reasonably Possible" adapted from (CDA 2007).
In probabilistic analysis, load (L) and resistance (R) parameters are statistically distributed
according to PDF selected to be representative of tests and knowledge about these
parameters. Failure develops when internal load demand exceeds the resistance capacity of
the dam. Influences of different selections of PDF data in probabilistic analyses have been
studied in Altarejos-Garcia et al. (2012); Carjaval et al. (2009a, 2009b, 2009c); Carjaval,
Peyras, and Baconnet (2010); Krounis and Johansson (2012); Krounis et al. (2016);
Lombardi (1988, 1993, 2006); Spross, Johansson and Larsson (2013). Probabilistic
analysis, no matter how sophisticated, can still lead to very different solutions for a given
problem because of the complex choices of random variables, characteristic values, PDF,
bounds, which can largely influence final results. For example, Figure 2 illustrates the wide
dispersion obtained from participants in an ICOLD Benchmark seeking to compute the
3 4 5 6 7 8 9 10 11 12 13 14 15 16 17 18 19 20 21 22 23 24 25 26 27 28 29 30 31 32 33 34 35 36 37 38 39 40 41 42 43 44 45 46 47 48 49 50 51 52 53 54 55 56
MC probabilistic analysis procedure is thus validated for the selected PDF data.
Figure 2. Dispersion in fragility curves computed for the ICOLD Benchmark for a 80 m-high gravity dam (Fig. 5); ϕ is the friction angle, C the cohesion, R the global resistance of the dam defined in Eq. 2; N = normal distribution, LN = lognormal distribution; selected bounds are indicated. Fcurves1 to 7 are from participants in the ICOLD Benchmark, Fcurves 8 to 12 are our solutions to the Benchmark.
18 19 20 21 22 23 24 25 26 27 28 29 30 31 32 33 34 35 36 37 38 39 40 41 42 43 44 45 46 47 48 49 50 51 52 53 54 55 56 57 58
For Peer Review Only
3.4 Reliability based Adjustable Factors of Safety: AFS
Kreuzer and Léger (2013) presented a simplified reliability based method to assess dam
stability. It depends on two uncertain random variables, R and L. An Adjustable Factor of
Safety (AFS) is defined by:
𝐴𝐴𝐹𝐹𝐹𝐹 =𝜇𝜇𝜇𝜇𝑅𝑅{1 − (𝑘𝑘𝑅𝑅. 𝑐𝑐𝑅𝑅 + 𝛼𝛼𝑅𝑅)}
𝐿𝐿{1 + (𝑘𝑘𝐿𝐿. 𝑐𝑐𝐿𝐿+ 𝛼𝛼𝐿𝐿)} = 𝐹𝐹𝐹𝐹𝑑𝑑𝑒𝑒𝑒𝑒. 𝑈𝑈𝑅𝑅𝐿𝐿 (Eq. 1)
FSdet is the deterministic factor of safety, cR and cL are the coefficients of variation related
to physical uncertainties, the natural intrinsic dispersion of values, kR and kL are related to
statistical uncertainties defined herein as the lack of knowledge, from the number and
reliability of material test data and αR and αL are related to model or (epistemic)
uncertainties (Figure 3). Comprehensive description and numerical values for these
coefficients have been suggested in Kreuzer and Léger (2013) depending on the knowledge
of the structure.
Considering only two random variables, R and L, the AFS aims to be compared to a
Required Safety Factor, FSreq, depending on a target failure probability, pf*, or the
corresponding reliability index β*. For a safe structure, the stability criterion becomes AFS ≥ FSreq. FSreq is computed iteratively by direct integration to be the FS = μR/μL such
that with the selected PDF data for R and L, the computed pf would correspond to the target
failure probability, pf*. PDF are bounded at distances from the mean corresponding to a
number kR or kL of standard deviations, on the left for the resistance and on the right for
the load. For unbounded PDF, tails of distributions are considered in the computation of
FSreq (it would correspond to k = ∞), but a k value has to be defined for the computation of
AFS. FSreq decreases when the uncertainties in L and R are reduced. The AFS is a simple 3 4 5 6 7 8 9 10 11 12 13 14 15 16 17 18 19 20 21 22 23 24 25 26 27 28 29 30 31 32 33 34 35 36 37 38 39 40 41 42 43 44 45 46 47 48 49 50 51 52 53 54 55 56
model. A user-friendly open source computer program, R-AFS, was developed to perform
AFS and FSreq computations (Morin 2016). The R-AFS implementation is controlled by an
input-output environment, using the "R" open-source statistical computational platform
(see https://www.r-project.org/). A copy of R-AFS could be obtained by contacting the
second author ([email protected]).
Figure 3. Definition of the six uncertainty coefficients in the reliability-based AFS format: (i) cR = σR/μR, (ii)
kR, (iii) αR, (iv) cL = σL/μL, (v) kL,(vi) αL.
The advantages of the reliability-based AFS are (i) the rationality to account for
uncertainties using selected PDF data and a target pf* (or β*) in similarity to probabilistic
analysis, (ii) its simplicity and practical use, (iii) a clear interpretation in the form of a
binary decision to accept/reject the computed FS.
Of course, if one has the certitude to have properly factored all uncertainties with the c, k
and α values, FSreq = 1 would be adequate. The general accepted safety performance 18 19 20 21 22 23 24 25 26 27 28 29 30 31 32 33 34 35 36 37 38 39 40 41 42 43 44 45 46 47 48 49 50 51 52 53 54 55 56 57 58
For Peer Review Only
criterion then becomes AFS ≥ 1. Another approach is to consider all uncertainties in the computation of FSreq. In the gravity dam shear strength problem, we are then seeking to
satisfy (μR/μL) ≥ FSreq (cR, kR, αR, pf*). However, an additional safety margin might be
provided for initial imperfection, ignorance or lack of information leading to the acceptance
criterion AFS ≥ FSreq (cR, kR, αR, pf*) (Kreuzer and Léger 2013). These three acceptance
criteria (i) AFS ≥ 1, (ii) (μR/μL) ≥ FSreq, and (iii) AFS ≥ FSreq are compared with MC
analyses, used as the reference solution to evaluate the reliability based AFS method.
3.5 Progressive approach to introduce uncertainties
The above safety evaluation formats, ranging from deterministic to comprehensive
probabilistic analyses, show different ways to account for uncertainties, from various
sources appearing at each level of the stability assessment of the dam: material testing,
selection of strength and load parameters, structural model. A progressive approach may
then be developed to best account for these uncertainties, from simple to more complex but
more precise evaluation formats (Figure 4).
3 4 5 6 7 8 9 10 11 12 13 14 15 16 17 18 19 20 21 22 23 24 25 26 27 28 29 30 31 32 33 34 35 36 37 38 39 40 41 42 43 44 45 46 47 48 49 50 51 52 53 54 55 56
Figure 4. Progressive approach for dam safety assessment: parameters, sources of uncertainties and performance indicators.
4. Application of progressive safety assessment 4.1 Description of the gravity dam for applications
The dam for applications is a 80 m-high concrete gravity dam that might be subjected to
overtopping. The dam geometry (Figure 5) is given in the 11th ICOLD Numerical
Benchmark (Escuder-Bueno et al., 2011). A single and simple failure mode, corresponding
to horizontal sliding along the dam-foundation interface, is to be investigated. In reality,
the kinematic of a dam base sliding-turning failure mode might occur along inclined planes
propagating in the foundation (Fishman 2009). However, our study is restricted to the
ICOLD benchmark problem to allow comparisons with previously published results (Fig.
2). The resistance, R, is a function of two basic random variables, (i) the friction
18 19 20 21 22 23 24 25 26 27 28 29 30 31 32 33 34 35 36 37 38 39 40 41 42 43 44 45 46 47 48 49 50 51 52 53 54 55 56 57 58
For Peer Review Only
coefficient, tanϕ, and (ii) the cohesion, C. The dam weight, W, and the drain effectiveness, E, are considered as given constant parameters. The uplift pressure, U, is a function of the
water level, Hw. In this application, there is no uncertainty for the load, L. The water level,
Hw, is increased systematically to reach an unacceptable limit state. In the case of
overtopping, the water weight on the crest is estimated as Ww. The gravitational
acceleration, the dam-foundation interface tensile strength, the water and concrete densities
used in computations are respectively, g = 9.81 m/s², ft = 0, ρw = 1000 kg/m3, and
ρc = 2400 kg/m3. The classical gravity method is used in stability analyses, considering
cracking at the dam-foundation interface. If the base crack extends beyond the drain, the
full uplift pressure is considered in the crack.
3 4 5 6 7 8 9 10 11 12 13 14 15 16 17 18 19 20 21 22 23 24 25 26 27 28 29 30 31 32 33 34 35 36 37 38 39 40 41 42 43 44 45 46 47 48 49 50 51 52 53 54 55 56
Figure 5. Geometry, load, L, drainage, and resistance, R, (friction and cohesion) properties of the gravity dam analysed.
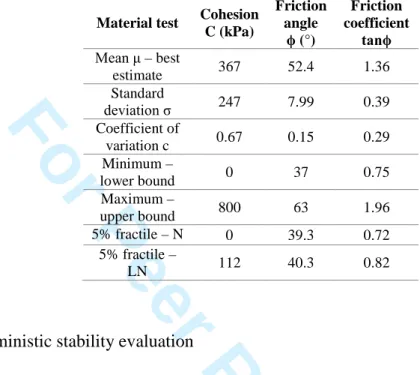
Fifteen couples of friction angle ϕ (°) and cohesion C (kPa) are specified as input "material test" data in the 11th ICOLD Numerical Benchmark seeking to estimate the sliding
probability of failure, pf, of the dam (see Appendix 1). The statistics for C and the friction
coefficient, tanϕ, are summarised in Table 4. The coefficient of variation for cohesion, cC,
is0.67, which is quite large. Distribution fitting has been realised with N-PDF and
LN-PDF. The LN-PDF was found to suit the data best taking into account the skewness,
whereas N-PDF is symmetrical. 18 19 20 21 22 23 24 25 26 27 28 29 30 31 32 33 34 35 36 37 38 39 40 41 42 43 44 45 46 47 48 49 50 51 52 53 54 55 56 57 58
For Peer Review Only
Table 4. Material test data statistics for friction and cohesion at the dam-foundation interface.
Material test Cohesion C (kPa) Friction angle ϕ (°) Friction coefficient tanϕ Mean μ – best estimate 367 52.4 1.36 Standard deviation σ 247 7.99 0.39 Coefficient of variation c 0.67 0.15 0.29 Minimum – lower bound 0 37 0.75 Maximum – upper bound 800 63 1.96 5% fractile – N 0 39.3 0.72 5% fractile – LN 112 40.3 0.82
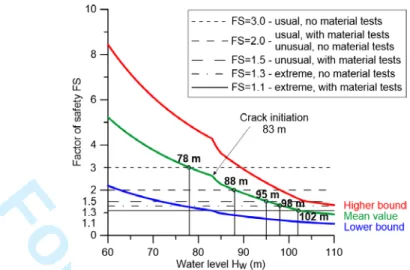
4.2 Deterministic stability evaluation
Deterministic analyses are first realised with mean values selected as best estimates for
cohesion, C, and friction coefficient, tanϕ. Smallest and largest values are taken as lower and higher bounds. For the usual and unusual load combinations, the maximal allowable
water level, Hw, is computed according to CDA (2007, Table 2), without and with material
tests (Figure 6). 3 4 5 6 7 8 9 10 11 12 13 14 15 16 17 18 19 20 21 22 23 24 25 26 27 28 29 30 31 32 33 34 35 36 37 38 39 40 41 42 43 44 45 46 47 48 49 50 51 52 53 54 55 56
Figure 6. Maximum allowable water level according to deterministic CDA (2007) dam safety guidelines.
These results indicated the importance of having a good knowledge of shear strength
parameters. For the usual load combination, the allowable water level increased by 10 m if
material tests are realised. However, CDA (2007) does not provide clear guidance on the
number of tests, the sampling location and the testing method to be used to obtain
representative results with a quantified confidence level. ANCOLD (2013) suggests criteria
for the "well-defined" material shear strength parameters (Table 2).
4.3 Probabilistic safety evaluation using Monte-Carlo simulations
A probabilistic assessment requires to select a target pf*, random variables, their PDF, and
their bounds if they are bounded. PDF are bounded at distances from the mean
corresponding to a number m of standard deviations on the left and on the right. Unbounded
PDF corresponds to m = ∞. Herein, the pf* is 10-5, consistent with the ALARP principles
for a high-risk dam (CDA 2007). We work with two sets of random variables either (C,
tanϕ) or R. The resistance, R, is described as the sum a friction and a cohesion component:
18 19 20 21 22 23 24 25 26 27 28 29 30 31 32 33 34 35 36 37 38 39 40 41 42 43 44 45 46 47 48 49 50 51 52 53 54 55 56 57 58
For Peer Review Only
𝑅𝑅 = 𝑉𝑉. 𝑡𝑡𝑡𝑡𝑡𝑡𝑡𝑡 + 𝐴𝐴𝑐𝑐. 𝐶𝐶 (Eq. 2)
a mean value is computed for R and the standard deviation, σR, is estimated from:
𝜎𝜎𝑅𝑅 = ��𝑉𝑉. 𝜎𝜎𝑒𝑒𝑡𝑡𝑡𝑡𝑡𝑡�2 + (𝐴𝐴𝑐𝑐. 𝜎𝜎𝐶𝐶)² (Eq. 3)
where V is the sum of vertical forces, and Ac the area in compression.
The related PDF are successively selected as N and LN in sensitivity analyses. Bounded
and unbounded PDF are also studied. MC computations are realised with MATLAB® (The
MathWorks 2016), n = 107 samples are found adequate to obtain convergence for pf. For
instance, when pf = 10-5, the accuracy is pf = 10-5 ± 5.10-7.
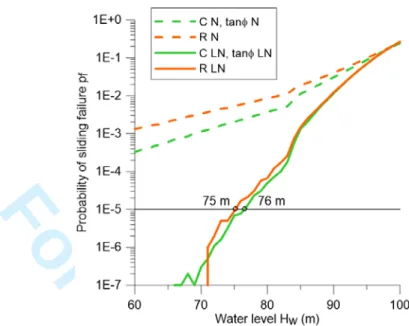
Unbounded PDF are first studied. When the unbounded hypothesis is considered with N-PDF, negative values of C, tanϕ, or R, are replaced by new draws in MC simulations. The results are presented in Figure 7.LN-PDF yielded failure probabilities smaller than N-PDF.
The reduction from two random variables, (C, tanϕ), to one random variable, R, gave similar Hw results. 3 4 5 6 7 8 9 10 11 12 13 14 15 16 17 18 19 20 21 22 23 24 25 26 27 28 29 30 31 32 33 34 35 36 37 38 39 40 41 42 43 44 45 46 47 48 49 50 51 52 53 54 55 56
Figure 7. Fragility curves comparing unbounded N-PDF and LN-PDF, variables (C, tanϕ) or R, computed with MC; and Hw according to probabilistic analysis for a target failure probability pf* = 10-5.
The effect of bounded PDF is investigated by selecting values between the 5% fractile for
strength parameters on the left of the distribution: ml standard deviations, and the 95%
fractile on the right: mr standard deviations (Figure 8). For variables C, tanϕ, R, ml are
respectively equal to 1.03, 1.38, 1.39 and mr respectively equal to 1.88, 1.84, 1.83. 18 19 20 21 22 23 24 25 26 27 28 29 30 31 32 33 34 35 36 37 38 39 40 41 42 43 44 45 46 47 48 49 50 51 52 53 54 55 56 57 58
For Peer Review Only
Figure 8. Fragility curves comparing bounded N-PDF and LN-PDF at the 5% and 95% fractile values, variables (C, tanϕ) or R, computed with MC; and maximum allowable water level according to probabilistic analysis for a pf* = 10-5.
Results were similar using N-PDF or LN-PDF, but more sensitive to the selection of
random variables. Using a single random variable, R, instead of two (C, tanϕ), yielded higher Hw.
4.4 Semi-probabilistic (partial coefficient) stability evaluation
For the semi-probabilistic analysis, CFBR (2013) suggests as characteristic values, a "wise
estimation of the mean", and the 5% fractile if statistical methods are used. Herein, two
pairs of (C, tanϕ) are used (i) mean values as best estimates (367, 1.36), and (ii) 5% fractile obtained from the 15 material test data assuming a N-PDF (0, 0.72, Table 4) considered in
typical user of CFBR. The partial strength safety coefficients are applied for the usual,
unusual, and extreme load combinations (Table 3).
3 4 5 6 7 8 9 10 11 12 13 14 15 16 17 18 19 20 21 22 23 24 25 26 27 28 29 30 31 32 33 34 35 36 37 38 39 40 41 42 43 44 45 46 47 48 49 50 51 52 53 54 55 56
Figure 9. Maximum allowable water level according to semi-probabilistic CFBR (2013) dam safety guidelines.
These results showed a very significant sensitivity of the semi-probabilistic method to the
selected characteristic values.
4.5 Reliability based AdjustableSafety Factors – AFS
The selected pf* is 10-5 as recommended for a high-risk dam with good quality assurance
and management (Kreuzer and Léger 2013). The AFS method is employed without
uncertainties in load L, cL = 0, also, coefficients reporting model uncertainties αR and αL 18 19 20 21 22 23 24 25 26 27 28 29 30 31 32 33 34 35 36 37 38 39 40 41 42 43 44 45 46 47 48 49 50 51 52 53 54 55 56 57 58
For Peer Review Only
are null. The shear strength random variable in the AFS method is R. The related PDF is
LN as recommended in Kreuzer and Léger (2013).
Unbounded PDF are first studied. Tails of distributions are considered while computing FSreq but a value for kR has to be defined for the evaluation of AFS. Values selected for kR
in the AFS computation (Eq. 1) are (i) kR = 1.39, corresponding to the 5% fractile for R for
LN-PDF (Holický 2009), (ii) kR = 2, (iii) kR = 3. FSreq is computed with unbounded PDF.
Computed AFS and FSreq are presented in Figure 10. For kR = 3, allowable water level was
less than 40 m.
Figure 10. AFS method: deterministic FSdet; required FSreq for pf* = 10-5 and unbounded LN-PDF for R; and
AFS for (i) kR = 1.39, (ii) kR = 2, (iii) kR = 3.
For bounded PDF the effect of bounds is investigated by selecting (i) kR = 1.39
(corresponding to the 5% fractile for R for our LN-PDF (Holický 2009), (ii) kR = 2, and
(iii) kR = 3 for the computation of AFS as well as FSreq. The computed AFS and FSreq are
presented in Figure 11. For kR = 3, Hw was again less than 40 m. 3 4 5 6 7 8 9 10 11 12 13 14 15 16 17 18 19 20 21 22 23 24 25 26 27 28 29 30 31 32 33 34 35 36 37 38 39 40 41 42 43 44 45 46 47 48 49 50 51 52 53 54 55 56
Figure 11. AFS method: deterministic safety factor FSdet; required safety factor FSreq for pf* = 10-5 and
bounded LN-PDF for R; AFS and FSreq for (i) kR = 1.39, (ii) kR = 2, (iii) kR = 3.
5. Discussion
5.1 Results from different safety evaluation formats
The 80 m dam was analysed according to four safety evaluation formats applying the
proposed progressive safety assessment methodology. The key results are presented (i) in
Figure 6 for deterministic analyses, (ii) in Figure 9 for semi-probabilistic analyses, (iii) in
Figures 10-11 for AFS, and (iv) in Figures 7-8 for probabilistic MC analyses. Comparative
Hw results are presented in Figure 12. Table 5 presents the computed FS for each safety
format that are compared to the required FS to declare a safe dam. The reference value to
make comparisons and orient the discussion is Hw = 90 m. This allowable Hw is computed
from MC simulations, using C and tanϕ as random variables, with LN-bounded PDF
18 19 20 21 22 23 24 25 26 27 28 29 30 31 32 33 34 35 36 37 38 39 40 41 42 43 44 45 46 47 48 49 50 51 52 53 54 55 56 57 58
For Peer Review Only
(ml = 1.03 for C and 1.38 for tanϕ, corresponding to the 5% fractile). It is a reasonable and
defensible probabilistic model having considered strength uncertainty in a rational way
with two random variables, as well as existing dam safety guidelines to select PDF bounds.
Obviously, other reference value for Hw could be selected. However, we present coherent
hypotheses moving from one level of complexity to the next such that meaningful
comparisons and discussion could be established.
The deterministic format criteria (Table 2, CDA 2007) are unable to consider the large
coefficient of variation in shear strength parameters, Hw being 102 m for extreme
conditions (flood) if material tests had been realised. A parametric analysis showed that
lower bound of shear strength data would authorise Hw equal to 82 m.
Probabilistic sensitivity analyses were applied with random variables (C, tanϕ) or R, LN-PDF, and unbounded or bounded distributions, with pf* = 10-5. For the unbounded case,
Hw was 76 m with variables (C, tanϕ) and 75 m with variable R, leading to similar results.
With bounds corresponding to the 5% fractiles for strength parameters, Hw was 90 m (the
reference value) for variables (C, tanϕ) and 94 m for R. Probabilistic analysis (MC) may be considered as the most rigorous approach but is shown to be sensitive to the selection
of random variables and PDF bounds.
In semi-probabilistic analysis, two pairs of values for (C, tanϕ) were used. For the extreme combination, using the mean, Hw was 104 m. Using the 5% fractile, Hw was 83 m. This
83 m value was the same as using bounded N-PDF with variables (C, tanϕ) in probabilistic analysis (Figure 8), meaning that calibration of partial coefficients in semi-probabilistic
analysis appears to be consistent with results of N-PDF bounded probabilistic analysis.
3 4 5 6 7 8 9 10 11 12 13 14 15 16 17 18 19 20 21 22 23 24 25 26 27 28 29 30 31 32 33 34 35 36 37 38 39 40 41 42 43 44 45 46 47 48 49 50 51 52 53 54 55 56
criterion "(μR/μL) ≥ FSreq". The criterion "(μR/μL) ≥ FSreq" gave the same Hw for unbounded
PDF even for kR = 3. This means that bounding PDF with large kR is equivalent in RBAFS
to consider the whole content of the distribution.
5.2 Comparisons of different safety evaluation formats
For the same 80 m gravity dam stability problem, with known 15 pairs (C, tanϕ) and considering (i) no uncertainty, (ii) uncertainties believed to be known with certainty either
in RBSF or probabilistic analysis or, (iii) uncertainties with an added safety margin, may
decrease the allowable Hw from 104 m to 60 m (Figure 12). Table 5 presents FS computed
by each safety evaluation format and the associated safety criterion for two water levels:
80 m and 90 m. Demand/capacity ratios (D/C) have been computed in each case as
(Hw2/902) because the applied hydrostatic thrust, L, could be estimated as L= (ρw g Hw2)/2.
D/C ratios are presented in enclosed boxes in Figure 12, and for varying values of PDF
bounds, ml (MC) and kR (AFS), in Figure 13. 18 19 20 21 22 23 24 25 26 27 28 29 30 31 32 33 34 35 36 37 38 39 40 41 42 43 44 45 46 47 48 49 50 51 52 53 54 55 56 57 58
For Peer Review Only
Figure 12. Maximum allowable water level for different safety formats: (i) deterministic, (ii) semi-probabilistic, (iii) AFS criterion "AFS ≥ FSreq", (iv) AFS criterion "(μR/μL) ≥ FSreq", (v) probabilistic MC
simulations with random variables (C, tanϕ), (vi) probabilistic MC simulations with random variable R. LN-PDF is used for AFS and probabilistic methods. In boxes are Demand/Capacity ratios.
3 4 5 6 7 8 9 10 11 12 13 14 15 16 17 18 19 20 21 22 23 24 25 26 27 28 29 30 31 32 33 34 35 36 37 38 39 40 41 42 43 44 45 46 47 48 49 50 51 52 53 54 55 56
1.77 ≥ 1.0 1.17 ≥ 1.0 μR/μL FSreq μR/μL FSreq
2.84 ≥ 1.61 1.86 ≥ 1.58 AFS FSreq AFS FSreq
1.77 ≥ 1.61 1.17 < 1.58
FSpr FSprreq FSpr FSprreq
1.26 ≥ 1.0 1.0 ≥ 1.0
(a) AFS computations with bounded PDF and k
R = 1.39. (b) Reference value from probabilistic analyses is 90 m. FS
pr is defined by the inverse of the demand/capacity ratio.
Deterministic and semi-probabilistic formats do not allow to account for uncertainties in
parameters used for computations. The allowable Hw were especially high using mean
values as strength parameters (102 m and 104 m an allowable capacity approximately 30%
larger than the reference value). Using lower bound or 5% fractile values as strength
parameters in a sensitivity analysis yielded much smaller Hw (82 m and 83 m), because of
the large scatter in test data.
Application of AFS method (computation of FSreq and AFS) allows to quantify
uncertainties in the safety evaluation. Comparing (μR/μL) to FSreq is then a mathematically
expressible safe/unsafe criterion. Allowable Hw were 94 m and 86 m for bounded PDF with
kR respectively equal to 1.39 and 2. This criterion yielded the same Hw as probabilistic MC
Probabilistic (b) FSpr≥ FSprreq (i) AFS ≥ 1 (ii) (μR/μL) ≥ FSreq (iii) AFS ≥ FSreq 18 19 20 21 22 23 24 25 26 27 28 29 30 31 32 33 34 35 36 37 38 39 40 41 42 43 44 45 46 47 48 49 50 51 52 53 54 55 56 57 58
For Peer Review Only
simulations using variable R and bounded at 5% fractile. This is because direct integration
used in computation of FSreq and MC simulations give the same pf. While using
(μR/μL)≥ FSreq,Hw is 94 m corresponding to a D/C of 1.1 using the 90 m reference value.
A maximum difference of 10%, as compared to the reference solution, is deemed
acceptable for a simplified method. This difference decreases while increasing the PDF
bound such that AFS is found to have the same range of applicability as that of MC with a
maximum difference of the order of 10%. The criterion "AFS ≥ 1" gave also 94 m and 86 m for bounded PDF and kR equal to 1.39 and 2, respectively. The range of applicability
of the criterion "AFS ≥ 1" is indicated in terms of D/C ratios in Figure 13. If we accept a difference of 10% with the reference solution, the use of "AFS ≥ 1" is restricted to kR value
smaller than 2.5. On the other hand, comparing AFS to FSreq allows to introduce an
additional safety margin. This added safety margin obviously yields to significantly lower
allowable Hw andsmaller D/C ratios as compared to other safety formats.
Figure 13. Demand/Capacity ratios for AFS as compared to MC, for varying PDF bounds in MC simulations (ml) and AFS (kR) 1 2 3 4 PDF bound: ml (MC) or kR (ASF) 0.4 0.6 0.8 1 1.2 1.4 Ratio demand/capacity MC: (C, tanɸ) MC: R ASF: (μR/μL) ≥ FSreq ASF: AFS ≥ 1 ASF: AFS ≥ FSreq
10%
Applicability criterion "AFS ≥ 1"
Reference (MC: (C, tanɸ)) 3 4 5 6 7 8 9 10 11 12 13 14 15 16 17 18 19 20 21 22 23 24 25 26 27 28 29 30 31 32 33 34 35 36 37 38 39 40 41 42 43 44 45 46 47 48 49 50 51 52 53 54 55 56
screening values for ho are based on field experience and engineering judgement. They
were recommended using the following description and equations (in feet) (i) for dams in
good condition: with very little seepage, no cracks or movement (ho = h0.6≈ 8.6 m), (ii) for
dams in a fair condition: with moderate seepage, small structural cracks, slight differential
movement (ho = h0.45 – 1 ≈ 3.5m) and (iii) for dams in poor conditions: with excessive
seepage, large continuous cracks, excessive differential movements (ho = h0.3 – 1 ≈ 1 m).
The proposed "AFS ≥ FSreq" criterion yielded a ho value of 3 m corresponding to the rule
of thumb for a dam in fair condition. This sounds about right considering the potential
scour at the downstream toe, the vibrations induced by the overflowing aerated water
nappe, the increased in downstream toe uplift pressure due to the downstream face water
jet changing direction at the toe. Such phenomenon are not being considered explicitly in
dam safety guidelines, and are very difficult to model from a sound probabilistic
standpoint.
6. Conclusions
In this paper, the consideration of material uncertainties in gravity dam sliding stability
assessment was investigated for four safety evaluation formats: (i) deterministic, (ii)
semi-18 19 20 21 22 23 24 25 26 27 28 29 30 31 32 33 34 35 36 37 38 39 40 41 42 43 44 45 46 47 48 49 50 51 52 53 54 55 56 57 58
For Peer Review Only
probabilistic (partial coefficient), (iii) reliability-based Adjustable Factor of Safety (AFS),
and (iv) probabilistic Monte Carlo (MC) analysis. The results were presented in terms of
the allowable water level, Hw, demand/capacity ratios (D/C), and FS to reach an unstable
condition. In AFS and MC, the selected target failure probability, pf*, was 10-5. A 80
m-high gravity dam was used for applications without considering uncertainties in the applied
loads, L. The main conclusions can be summarised as follows:
• The dam engineering profession shows a huge interest in comprehensive probabilistic
methods. However, computation of pf is very sensitive to the selection of shear strength
random variables and PDF data as shown by the wide dispersion observed from the
ICOLD Benchmark’s results for a 80 m-high gravity dam. Practical applications are
thus challenging, and generalisation of probabilistic analyses needs clear guidance.
• Using the deterministic format, Hw was found to be 103 m as compared to a reference
MC solution with Hw equal to 90 m. The Deterministic safety format was found
inadequate to introduce uncertainties even with an arbitrary reduction of the required
FS if material tests are conducted
• In MC analyses, PDF bound data are the predominant parameters affecting the
computation of pf. A simplified bounded MC solution, using a single force resultant
shear strength random variable, R, yielded a dam capacity approximately 10% larger
than a bounded reference MC solution using two random variables (cohesion, C and
friction, tanϕ). This excessive capacity decreases as the PDF bound becomes larger, the difference becoming insignificant when unbounded distributions are considered.
• A reliability-based adjustable safety factor (AFS) is a simplified and practical approach
to introduce probabilistic uncertainties in shear strength parameters. The criterion
3 4 5 6 7 8 9 10 11 12 13 14 15 16 17 18 19 20 21 22 23 24 25 26 27 28 29 30 31 32 33 34 35 36 37 38 39 40 41 42 43 44 45 46 47 48 49 50 51 52 53 54 55 56
criterion "AFS ≥ FSreq", which introduces an additional safety margin, cannot be
compared the MC reference solution, because no additional safety margin was
introduced in the MC solution. "AFS ≥ FSreq" yielded a lower allowable water level
(83 m) than the MC solution (90 m). However, Hw = 83 m does correspond to an
established rule of thumb to estimate the capacity of a 80 m-high gravity dam.
• The proposed AFS method is a practical answer to the need for a simplified and robust
method to introduce material data shear strength uncertainties using a rigorous
approach in gravity dam stability analysis. Its range of applicability and the adequacy
of the safety margin provided as compared to reference MC solutions make RBSF AFS
a useful tool to use in sensitivity analysis of PDF data before undertaking more
comprehensive MC analyses (or variants such as FORM).
Acknowledgements
The financial support provided by the Natural Science and Engineering Research Council
of Canada is acknowledged. The authors would also like to thank Dr Harald Kreuzer for
proposing the AFS and the fruitful technical discussions that took place during this study.
18 19 20 21 22 23 24 25 26 27 28 29 30 31 32 33 34 35 36 37 38 39 40 41 42 43 44 45 46 47 48 49 50 51 52 53 54 55 56 57 58
For Peer Review Only
References
Altarejos-Garcia, L., Escuder-Bueno, I., and Morales-Torres, A. (2015). "Advances on the failure analysis of the dam-foundation interface of concrete dams." Materials, 8, 8255-8278.
Altarejos-Garcia, L., Escuder-Bueno, I., Serrano-Lombillo, A., and Membrillera-Ortuño, G. D. (2012). "Methodology for estimating the probability of failure by sliding in concrete gravity dams in the context of risk analysis." Structural Safety, 36-37, 1-13.
ANCOLD. (2013). Guidelines on design criteria for concrete gravity dams. Australia: Australian National Committee on Large Dams.
ANCOLD. (1991). Guidelines on design criteria for concrete gravity dams. Australia: ANCOLD.
Baecher, G. B. (2016). "Uncertainty in dam safety risk analysis." Georisk: Assessment and Management of Risk for Engineered Systems and Geohazards, 10(2), 92-108.
Bowles, D. S. (2007). "Tolerable risk for dams: How safe is safe enough?" Paper presented at the 27th US Society on Dams Annual Conference, Philadelphia, USA.
Bury, K. V., and Kreuzer, H. (1985). "Assessing the failure probability of gravity dams." Water Power & Dam Construction, 37(11), 46-50.
Carjaval, C., Peyras, L., Arnaud, P., Boissier, D., and Royet, P. (2009a). "Assessment of hydraulic load acting on dams including filling variability and stochastic simulations." European Journal of Environmental and Civil Engineering, 13(4), 399-411.
Carjaval, C., Peyras, L., Arnaud, P., Boissier, D., and Royet, P. (2009b). "Probabilistic modeling of floodwater level for dam reservoirs." Journal of Hydrologic Engineering, 14(3), 223-232.
Carjaval, C., Peyras, L., and Bacconnet, C. (2010). "On the loading/shear strength coupling in the probabilistic formulation of the limit-state in shear for gravity dams." European Journal of Environmental and Civil Engineering, 14(3), 283-301.
Carjaval, C., Peyras, L., Bacconnet, C., and Bécue, J.-P. (2009c). "Probability modelling of shear strength parameters of RCC gravity dams for reliability analysis of structural safety." European Journal of Environmental and Civil Engineering, 13(1), 91-119.
CDA. (2007). Dam safety guidelines. Edmonton, Canada: Canadian Dam Association.
CFBR. (2013). Recommendations for the justification of the stability of gravity dams. France: Comité Français des Barrages et Réservoirs.
3 4 5 6 7 8 9 10 11 12 13 14 15 16 17 18 19 20 21 22 23 24 25 26 27 28 29 30 31 32 33 34 35 36 37 38 39 40 41 42 43 44 45 46 47 48 49 50 51 52 53 54 55 56
Escuder-Bueno, I., Altarejos-Garcia, L., and Serrano-Lombillo, A. (2011). "Theme C - Estimation of the probability of failure of a gravity dam for the sliding failure mode." Paper presented at the XI ICOLD International Benchmark Workshop on Numerical Analysis of Dams, Valencia, Spain.
Escuder-Bueno, I., Mazzà, G., Morales-Torres, A., and Castillo-Rodriguez, J. T. (2016). "Computational aspects of dam risk analysis: findings and challenges." Engineering, 2(3), 319-324.
FERC. (2002). Engineering guidelines for the evaluation of hydropower projects. Washington DC, USA: Federal Energy Regulatory Commission.
FERC. (2014). Risk-Informed Decision Making. Washington DC, USA: FERC.
Fishman, Y.A. (2009). "Stability of concrete retaining structures and their interface with rock foundations." International Journal of Rock Mechanics and Mining Sciences, 46, 957-966.
Hartford, D. N. D., and Baecher, G. B. (2004). Risk and uncertainty in dam safety. London, UK: Thomas Telford.
Hartford, D. N. D., Baecher, G. B., Zielinski, P. A., Patev, R. C., Romanas, A., and Rytters, K. (2016). Operational safety of dams and reservoirs - Understanding the reliability of flow-control systems. London, UK: ICE Publishing.
Holický, M. (2009). Reliability analysis for structural design. Stellenbosch, South Africa: SUN MeDIA Publishing.
IS. (1984-1998). Criteria for design of solid gravity dams. New Delhi, India: Indian Standards.
Johansson, F., Westberg Wilde, M., Altarejos-García L. (2017)."Theme D, Risk Analysis– assessment of reliability for concrete dams." XIV ICOLD International Benchmark Workshop on Numerical Analysis of Dams, Stockholm, Sweden.
18 19 20 21 22 23 24 25 26 27 28 29 30 31 32 33 34 35 36 37 38 39 40 41 42 43 44 45 46 47 48 49 50 51 52 53 54 55 56 57 58
For Peer Review Only
Jongejan, R. B., and Calle, E. O. F. (2013). "Calibrating semi-probabilistic safety assessments rules for flood defences. " Georisk: Assessment and Management of Risk for Engineered Systems and Geohazards. doi:10.1080/17499518.2013.790731
Jongejan, R. B., and Maaskant, B. (2013). "The use of quantitative risk analysis for prioritizing flood risk management actions in the Netherlands." Paper presented at the 2013 CDA Annual Conference, Montreal, Canada.
Kalinina, A., Spada, M., Marelli, S., Burgherr, P., and Sudret, B. (2016). Uncertainties in the risk assessment of hydropower dams - State-of-the-art and outlook. Technical report. Zürich, Switzerland: ETH.
Kovarik, J.-B. (2000). "What is a safety factor in civil engineering? (in French: "Qu'est-ce qu'un coefficient de sécurité en génie civil ?")." Revue Française de Génie Civil, 4(6), 607-651.
Kreuzer, H. (2000). "Risk analysis for existing dams: merits and limits of credibility." Hydropower & Dams, 7(1), 49-53.
Kreuzer, H. (2003). "Uncertainty in the assessment of failure probabilities." Hydropower & Dams, 10(6), 98-101.
Kreuzer, H., and Léger, P. (2013). "The Adjustable Factor of Safety: A reliability-based approach to assess the factor of safety for concrete dams." Hydropower & Dams, 20(1), 67-90.
Krounis, A., and Johansson, F. (2012). "The influence of correlation between cohesion and friction angle on the probability of failure for sliding of concrete dams." In Escuder-Bueno. et al. (Ed.), Risk Analysis, Dam Safety, Dam Security and Critical Infrastucture Management. London: Taylor & Francis Group.
Krounis, A., Johansson, F., Spross, J., and Larsson, S. (2016). "Influence of cohesive strength in probabilistic sliding stability reassessment of concrete dams." Journal of Geotechnical and Geoenvironmental Engineering. doi:10.1061/(ASCE)GT.1943-5606.0001583
Lombardi, G. (1988). "Logarithmic double-bounded distribution (in French: "Distribution à double borne logarithmique")." Paper presented in the 16th ICOLD Congress, San Francisco, Q.63, R.17, pp.1337-1348, USA.
Lombardi, G. (1993). "Concrete dams and their foundation - Evaluation for static loading." Paper presented at the International Workshop on Dam Safety Evaluation, Grindelwald, Switzerland. Vol.4, 77-90.
Lombardi, G. (2006). "Tendencies, probabilites and risk analysis for dams." Dam Engineering, 17(1), 5-29. 3 4 5 6 7 8 9 10 11 12 13 14 15 16 17 18 19 20 21 22 23 24 25 26 27 28 29 30 31 32 33 34 35 36 37 38 39 40 41 42 43 44 45 46 47 48 49 50 51 52 53 54 55 56
methods – Application to hazards studies." European Journal of Environmental and Civil Engineering, 16(7), 795-817.
Peyras, L., Royet, P., Deroo, L., Albert, R., Becue, J.-P., Aigouy, S., Bourdarot, E, Loudiere, D., and Kovarik, J.-B. (2008). "French recommendations for limit-state analytical review of gravity dam stability." European Journal of Environmental and Civil Engineering, 12(9-10), 1137-1164.
Porter, K. (2017). A beginner’s guide to fragility, vulnerability, and risk. University of Colorado Boulder.
Riley, K., Webley, P., and Thomson, M. (2017). Natural hazard uncertainty assessment: Modeling and decision support (Vol. 223). Hoboken, USA: John Wiley & Sons.
Rocha, M. (1974). Present possibilities of studying foundations of concrete dams. Paper presented at the Third Congress of the International Society of Rock Mechanics, Denver, USA.
Ruggeri, G. (2004). Sliding safety of existing gravity dams - Final report: ICOLD European Club.
SPANCOLD. (2003). Dam safety technical guidelines N°2: Criteria for dams and associated works projects (in Spanish: "Guía Técnicas de Seguridad de Presas Nº 2: Criterios para proyectos de presas y sus obras anejas"). Madrid, Spain: Spanish Commitee on Large Dams.
SPANCOLD. (2013). Risk analysis applied to management of dam safety. Madrid, Spain: SPANCOLD.
Spross, J., Johansson, F., and Larsson, S. (2013). "On the use of pore pressure measurements in safety reassessments of concrete dams founded on rock." Georisk: Assessment and Management of Risk for Engineered Systems and Geohazards, 8(2), 117-128. 18 19 20 21 22 23 24 25 26 27 28 29 30 31 32 33 34 35 36 37 38 39 40 41 42 43 44 45 46 47 48 49 50 51 52 53 54 55 56 57 58
For Peer Review Only
Tekie, P. B. (2002). Fragility Analysis of Concrete Gravity Dams. USACE ERDC Technical Report TR-02-6. Washington DC, USA: USACE.
The MathWorks, I. (2016). MATLAB R2016a.
USACE. (2005). Stability analysis of concrete structures. Washington DC, USA: USACE.
USACE. (1995). Gravity dam design. Washington DC, USA: USACE.
USBR. (1976). Design of gravity dams. Denver, USA: United States Bureau of Reclamation.
Vergouwe, R. (2016). The national flood risk analysis for the Netherlands. Final report. The Netherlands: Rijkswaterstaat VNK Project Office.
Westberg Wilde, M., and Johansson, F. (2013). "System reliability of concrete dams with respect to foundation stability: Application to a spillway." Journal of Geotechnical and Geoenvironmental Engineering, 139(2), 308-319.
Westberg Wilde, M., and Johansson, F. (2016). Probabilistic model code for concrete dams. Report 2016:292. Stockholm, Sweden: Energiforsk.
Zhang, L., Peng, M., Chang, D., and Xu, Y. (2016). Dam failure mechanisms and risk assessment. Singapore: John Wiley & Sons.
Appendix 1 – ICOLD Benchmark material data
The fifteen couples of friction angle ϕ (°) and cohesion C (kPa) specified as input "material test" data in the 11th ICOLD Numerical Benchmark (Escuder-Bueno, Altarejos-Garcia and
Serrano-Lombillo 2011) are: (ϕ, C)={(45, 500); (37, 300); (46, 300); (45, 700); (49, 800); (53, 200); (54, 600); (45, 0); (49, 100); (60, 200); (63, 200); (62,400); (60, 700); (56, 100); (62, 400)}. 3 4 5 6 7 8 9 10 11 12 13 14 15 16 17 18 19 20 21 22 23 24 25 26 27 28 29 30 31 32 33 34 35 36 37 38 39 40 41 42 43 44 45 46 47 48 49 50 51 52 53 54 55 56
increases from material test data. Yet, those reduced FSdet are not based on a rational
consideration of uncertainties. Propagation of uncertainties could be done using
comprehensive probabilistic analyses, such as Monte-Carlo simulations (MC). However,
MC are complex and challenging for practical use. There is thus a need to develop
simplified reliability based safety assessment procedures that could rationalise the
adjustment of FSdet from existing dam safety guidelines. This paper presents a progressive
analysis methodology using four existing safety evaluation formats of increasing
complexity: (i) deterministic, (ii) semi-probabilistic (partial coefficient), (iii) reliability
based Adjustable Factor of Safety (AFS), and (iv) probabilistic (MC). Comprehensive
comparisons are made for the sliding safety evaluation of a 80 m gravity dam. Results are
presented in terms of sliding factors of safety, allowable water levels, and demand/capacity
(load and resistance) ratios. It is shown that the reliability based AFS formulation, using
direct integration, is simple and practical to use in complement to existing dam safety
guidelines before undertaking MC simulations. AFS yielded results with a maximum
difference of approximately 10% as compared to rigorous MC probabilistic analyses.
18 19 20 21 22 23 24 25 26 27 28 29 30 31 32 33 34 35 36 37 38 39 40 41 42 43 44 45 46 47 48 49 50 51 52 53 54 55 56 57 58
For Peer Review Only
1. Introduction
Dams are major infrastructures, for which failure is an extremely rare event but with very
serious consequences. Gravity dams are particularly sensitive to overtopping, due to the
large hydrostatic thrust and uplift pressures that reduce the shear strength capacity that
could be mobilised by frictional resistance and cohesion along lift joints or the
concrete-rock interface. Dams have a useful service life extending for decades, such that aging of
materials and the magnitude of anticipated floods evolve with advances in predictive
methodologies and changes in the environment. The structural stability of major dams
needs to be re-evaluated every 5-10 years according to Hazard Classification Systems
(HCS), most often within the legal framework of a governmental regulatory agency.
Structural stability against sliding should satisfy a binary safe/unsafe limit-state stating that
the shear resistance, R, has to be strictly larger than or equal to the driving shear load, L.
To guard against uncertainties in R and L, large deterministic factors of safety (FSdet) are
used. These large FSdet may be reduced when new knowledge about the material shear
strength parameters is acquired to better quantify the friction coefficient and cohesion. For
instance, in CDA (2007), FSdet = 3 if no material test is available, and FSdet = 2 if tests are
done. A better knowledge of strength parameters thus authorises a reduced safety margin.
However, the specified FSdet numerical values come are rounded numbers from experience
and not from a rational approach to quantify reduction in strength parameters uncertainties.
There is thus a need to develop, validate and verify simplified reliability based safety
assessment procedures that could rationalise the FSdet adjustment from existing dam safety
guidelines, used routinely by practicing engineers by referring to data bases developed
from evaluating L and R uncertainties readily available from countless test series and load 3 4 5 6 7 8 9 10 11 12 13 14 15 16 17 18 19 20 21 22 23 24 25 26 27 28 29 30 31 32 33 34 35 36 37 38 39 40 41 42 43 44 45 46 47 48 49 50 51 52 53 54 55 56
decision makers and stakeholders with clarity. Of course, comprehensive reliability based
probabilistic analyses could be undertaken to propagate uncertainties in structural stability
analyses. However, comprehensive probabilistic analyses (e.g. Monte Carlo (MC)
simulations) require extensive time, sophisticated tools, expertise and resources that are
most often not available. To adjust the required safety margin as a function of a reduction
in shear strength uncertainties, this paper presents a progressive analysis methodology of
increasing complexity and accuracy. It consists in applying successively (i) deterministic
analyses, (ii) simplified reliability based Adjustable Factor of Safety (AFS) analyses, and
(iii) full probabilistic analyses (crude MC). The main objective of the paper is to establish
the range of AFS modelling parameters for which coherent results could obtained with MC simulations that are used as reference values.
This paper is organised as follows. After the review of literature in section 2, section 3
describes four different safety formats: (i) deterministic, (ii) semi-probabilistic (partial
coefficient), (iii) reliability based AFS, and (iv) probabilistic (MC). Comprehensive
comparisons of the four safety evaluation formats are done by comparing sliding stability
indicators of a 80 m-high gravity dam, studied in a previous ICOLD numerical Benchmark
seeking to quantify the sliding probability of failure, pf, as a function of the upstream 18 19 20 21 22 23 24 25 26 27 28 29 30 31 32 33 34 35 36 37 38 39 40 41 42 43 44 45 46 47 48 49 50 51 52 53 54 55 56 57 58