THIRTY-FOURTH REGULAR MEETING OF THE EXECUTIVE COMMITTEE
2015 Program Budget
San Jose, Costa Rica
21-22 May 2014
IICA/CE/Doc. 625 (14)
Original: Spanish
Expenditure
Budget
2015
Inter-American Institute
for Cooperation on
Agriculture
April 2014
CONTENTS
I. Introduction ... 1
II. Strategic Guidelines for 2015 ... 2
III. Overall Budget for 2015 ... 3
IV. Allocation of Resources from the Regular Fund for 2015 by Chapter ... 5
Chapter I: Direct Technical Cooperation Services ... 6
Chapter II: Management Costs ... 7
Chapter III: General Costs and Provisions... 8
Chapter IV: Renewal of Infrastructure and Equipment ... 8
V. Allocation of Resources from the Regular Fund for 2015 by Major Object of Expenditure ... 9
I.
INTRODUCTION
he present document contains the proposed Program Budget of Expenditures of the Inter-American Institute for Cooperation on Agriculture (IICA) for 2015.
At its Seventeenth Regular Meeting, held in Buenos Aires, Argentina on September 26, 2014, the Inter-American Board of Agriculture (IABA) adopted Resolution IICA/JIA/Res. 485 (XVII-O/13), in which it approved the Income Budget for the 2014-2015 biennium and the Expenditure Budget for 2014. In operative paragraph 3 of the resolution, the IABA resolved to “Instruct the Director General to present to the consideration of the Executive Committee, at its Thirty-fourth Regular Meeting, a draft budget of expenditures of the funds approved for the 2015 Program Budget, consistent with the priorities of the new Medium-term Plan of the Institute.”
This proposal was prepared to comply with the IABA resolution. It sets out the budget of expenditures for 2015, in accordance with the priorities established in the proposed 2014-2018 Medium-term Plan and within the framework of the approved income budget of USD33,910,000. This Program Budget of Expenditures for 2015 was prepared taking into consideration the following main criteria:
Implement the new 2014-2018 MTP, under which:
o Technical cooperation activities will focus on the challenges of productivity, competitiveness, inclusion and sustainability, which include topics related to innovation and water management;
o A results-based model will be adopted. Rooted in twelve contributions that form part of a chain of institutional results, this will produce changes desired by the countries and specific services and products from which they will benefit; and, o A projects-based approach will be used to carry out the activities that will enable
the Institute to achieve its results.
Ensure that the Institute’s operational viability is maintained as a key instrument for technical cooperation, to support the countries’ efforts to achieve the sustainable development of agriculture, food security and poverty alleviation;
Strengthen the Institute’s financial capacity in order to enhance the cooperation services that IICA provides under the new MTP and for the benefit of the Member States;
Capitalize efficiently on the major improvements made to the Institute’s processes in order to reduce operating costs and achieve greater efficiency, based on the criteria of austerity, rationality, equity and transparency in the use of resources;
Cope effectively with the fact that alternative sources of financing used in the past, such as recovery of quota arrears and miscellaneous income, are no longer an option;
Continue to promote the policy of increasing the percentage of the Institutional Net Rate (INR), 1 which is used to help finance the indirect costs of externally funded projects (concept
of proportionality);
Step up efforts to absorb, without a major negative impact on IICA’s operations, the loss of value of the Regular Fund stemming from the freezing of Member States’ quotas and the drop in miscellaneous income; and,
1 Approved by the Thirty-second Regular Meeting of the Executive Committee in 2012 by means of Resolution IICA/CE/Res. 556
(XXXII-O/12) of October 10, 2012.
Operate more efficiently in an environment in which the implementation of measures to reorient expenditure, reduce staff and promote savings is increasingly complex, as is the task of coping with higher staff costs, the revaluation of local currencies and the rising prices of services, equipment, furnishings, vehicles, consultants, travel, insurance, etc.
Bases of the Program Budget:
1. Amount of income expected in accordance with the budget approved by the IABA for the period 2014-2015, with the amount of Member States’ quotas remaining pegged at USD27,810,000 and Miscellaneous Income at USD6,100,000 per year, financed with USD3,500,000 in income that is expected to be generated and USD2,600,000 from the Miscellaneous Income Fund.
2. Estimated loss of 3% per year in the purchasing power of the Regular Fund, based on a weighted average of the variations in both price indexes and the exchange rates of national currencies against the US dollar, and in the breakdown of expenditure by currency.
3. The following measures are included in the proposal in order to absorb, with as little impact as possible, the increase in the cost to the Regular Fund in 2015, estimated to be USD1 million:
o Elimination of 3 International Professional Personnel positions financed with resources from the Regular Fund.
o Elimination of 2 Local Professional Personnel posts financed with resources from the Regular Fund.
o Reduction of USD405,100 in staff costs. o Adjustments in operating costs:
Rationalization of international travel and greater use of electronic media (a decrease of 0.8% despite price increases).
Less investment in equipment and furniture (a reduction of 11.0%). Reduction of 0.3% in the cost of communications, correspondence and
rents.
Reduction of 1.4% in other costs (official hospitality, insurance, financial expenses).
o Strengthening of expenditures on items related directly to technical cooperation: An 18.1% increase in training and technical events.
More resources for consulting services for technical cooperation (6.0%). II.
STRATEGIC GUIDELINES FOR 2015
mplementation of the 2014-2018 MTP will get under way in the second half of 2014, an unprecedented strategy will make it possible to give greater continuity and fluidity to the Institute’s efforts to achieve the objectives set forth in the 2010-2020 Strategic Plan.
3
The strategic objectives of the MTP are:The new technical cooperation model, designed to enable the Institute to achieve the above strategic objectives, will be based on:
A clear definition of the Institute’s key functions, which will make it possible to focus IICA’s capabilities and experience more precisely;
A global approach to the provision of technical cooperation, articulating the hemispheric, multinational and national levels, with differentiated IICA strategies for each country, respecting national priorities within the framework of the Institute’s mandates;
A results-based approach geared to the execution of two kinds of projects that will articulate technical cooperation: cross-thematic, multi-level flagship projects and the projects of the Technical Cooperation Fund (FonTC), for which seed capital is provided to mobilize resources from other sources, thereby complementing and strengthening the leveraging of finances for the cooperation services provided to the countries;
Attention to special needs and emerging issues in the countries with institutional actions designed to provide a rapid response;
The use of the networks of IICA offices in the countries and their technical personnel, partners and allies;
The active and permanent incorporation of technical services and strategic and operational management activities as an integral part of technical cooperation, in order to strengthen and facilitate the Institute’s activities;
The prioritization of the allocation of institutional resources to the flagship projects, FonTC projects and rapid response actions, based on the contributions expected and achieved; and, A rigorous model of monitoring and performance auditing geared directly and permanently
toward the continuous improvement of the organization and its contributions.
III.
OVERALL BUDGET FOR 2015
he Institute finances its technical cooperation and operating activities with resources from the Regular Fund, which is made up of Member State quotas and miscellaneous income, obtained basically from financial yields, tax recovery and the sale of assets and certain services. In addition, the Institute increases its technical cooperation actions by implementing externally funded programs and projects, under agreements signed with partners or counterparts. The management of external resources demands the time of additional technical and administrative
Improve the productivity and competitiveness of the agricultural sector
Strengthen agriculture’s contribution to area-based development and to rural well-being
Improve agriculture’s capacity to mitigate and adapt to climate change and make better use of natural resources Enhance agriculture’s contribution to food security
personnel, increasing operating costs. These additional costs are covered by the Institutional Net Rate (INR) that counterparts agree to pay IICA.
It is estimated that in 2015 external resources will amount to USD170 million. The preliminarily calculation of income from the application of the INR in 2015 is USD12.4 million, with an average rate of 7.3%.
The final amount of INR resources received is subject to the signing and execution of agreements for the implementation of externally funded programs and projects.
The Regular Fund budget amounts to USD33,900,000 for 2015, made up of USD27,800,000 in Member State quotas and USD6,100,000 in miscellaneous income.
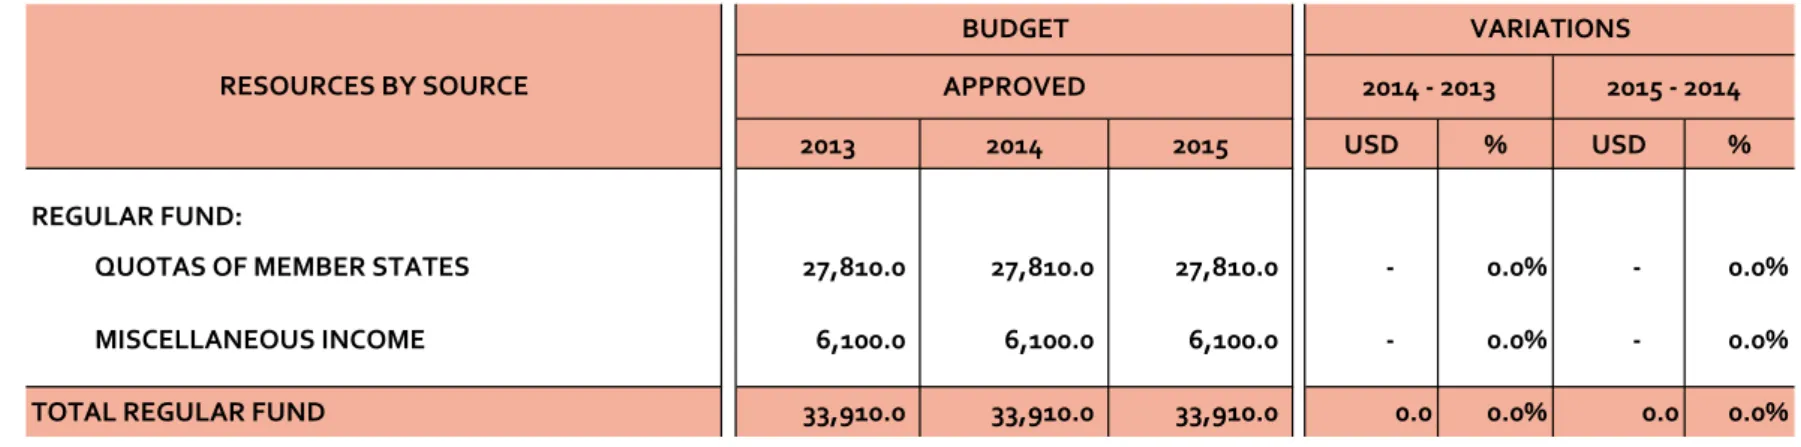
The Income Budget for 2014-2015 is the same in nominal values as the 2013 budget, as shown in Table A.
The Kingdom of Spain contributes an annual quota of USD60,000 as an Associate Member, pursuant to an agreement adopted in the First Plenary Session of the Eleventh Regular Meeting of the Inter- American Board of Agriculture, held on November 26, 2001 in Bávaro, Dominican Republic.
Table B and Table 1, attached to this document, provide a breakdown of the Overall Budget from the Regular Fund for 2014 and 2015 approved by the Inter-American Board of Agriculture (IABA) at its Seventeenth Regular Meeting, held in Buenos Aires, Argentina, on September 26, 2013, and the external resources expected to be executed and INR resources generated.
RESOURCES BY SOURCE 2013 2014 2014 MEMBER STATE QUOTAS 27,810.0 27,810.0 27,810.0 MISCELLANEOUS INCOME 6,100.0 6,100.0 6,100.0 TOTAL REGULAR FUND 33,910.0 33,910.0 33,910.0
Table A
Income Budget
2013 and 2014-2015 Program Budgets
(USD x 000)
2014 2015
REGULAR FUND:
MEMBER STATE QUOTAS 27,810.0 27,810.0 MISCELLANEOUS INCOME 6,100.0 6,100.0 TOTAL REGULAR FUND 33,910.0 33,910.0 EXTERNAL RESOURCES FOR PROGRAMS AND PROJECTS* 150,000.0 170,000.0 INSTITUTIONAL NET RATE* 10,650.0 12,410.0
194,560.0
216,320.0
*/ Estimates. Final figures will depend on the agreements signed and executed.
Table B
Overall Budget
2014-2015 Program Budgets
(USD x 000) RESOURCES BY SOURCE TOTAL5
Table 2, also contained in the annex to this document, presents the percentage scale of the MemberStates’ quota contributions according to the distribution approved by the OAS, and the over-quota contributions of Argentina, El Salvador, Guatemala, Guyana, Mexico, Panama, Paraguay and Uruguay, and miscellaneous income.
Table 3 shows the variations in the Income Budget of resources from the Regular Fund for 2013, 2014, and 2015.
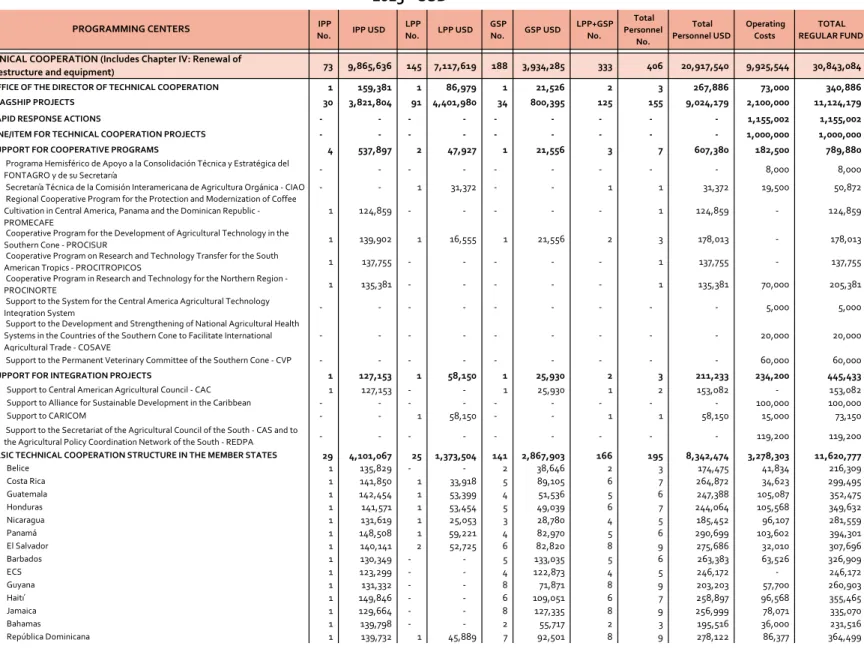
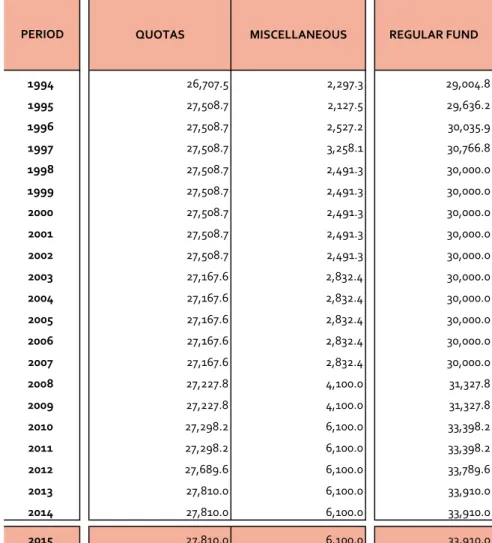
Table 4 details the allocation of the Expenditure Budget with resources from the Regular Fund for 2014 by Programming Center, in accordance with the guidelines of the 2014-2018 Medium-term Plan. Table 5 summarizes the evolution of the Regular Fund budget approved by the IABA between 1994 and the 2014-2015 biennium, with the amounts indicated previously.2
IV.
ALLOCATION OF RESOURCES FROM THE REGULAR FUND FOR 2015 BY
CHAPTER
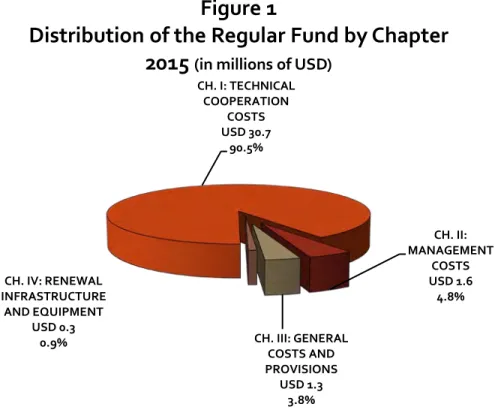
he Institute’s budget is divided into four Chapters:
o I: Direct Technical Cooperation Services o II: Management Costs
o III: General Costs and Provisions
o IV: Renewal of Infrastructure and Equipment
Figure 1 and Table 6 show the proposed allocation of resources from the Regular Fund by Chapter.
2 Tables 6 - 9 are cited in the next sections of the document.
CH. I: TECHNICAL COOPERATION COSTS USD 30.7 90.5% CH. II: MANAGEMENT COSTS USD 1.6 4.8% CH. III: GENERAL COSTS AND PROVISIONS USD 1.3 3.8% CH. IV: RENEWAL INFRASTRUCTURE AND EQUIPMENT USD 0.3 0.9%
Figure 1
Distribution of the Regular Fund by Chapter
2015
(in millions of USD)
CHAPTER I: DIRECT TECHNICAL COOPERATION SERVICES
This chapter includes the costs of the Institute’s technical cooperation activities, carried out by means of the priority projects and rapid response actions at the national, multinational and hemispheric levels required to achieve the objectives and contributions established in the Medium-term Plan. This portion of the budget includes IICA’s support for the integration bodies and cooperative programs, and its contributions to the Tropical Agriculture Research and Higher Education Center (CATIE), the Caribbean Agricultural Research and Development Institute (CARDI), the costs of technical cooperation services and the basic structures for technical cooperation in the Offices in the Member States. The resources allocated for this Chapter are as follows:
Table C
Chapter I: Direct Technical Cooperation Services Regular Fund (USD) Source 2014 2015 Quotas Miscellaneous 24,891,719 5,752,818 24,877,351 5,805,664 Total 30,644,538 30,683,015
The resources of the Regular Fund allocated to technical cooperation rose from 88.8% in 2011 to 89.3% in 2012, 89.7% in 2013 and 90.4% in 2014. The figure will rise to 90.5% in 2015 (see Figure 2). Thanks to a clear improvement in the administration and execution of the budget, it is possible to allocate more resources to direct technical cooperation services (see Figure 3 and Table 6 attached). The figure does not include the resources that the units and actions of this Chapter use to renew infrastructure and equipment (Chapter IV).
87.5% 88.0% 88.5% 89.0% 89.5% 90.0% 90.5% 2011 2012 2013 2014 2015 88.8% 89.3% 89.7% 90.4% 90.5%
Figure 2
Proportion of the Regular Fund Allocated to Direct Technical
Cooperation Services
7
CHAPTER II: MANAGEMENT COSTS
Management Costs include the resources of the units responsible for managing the Institute, including technical cooperation activities. Those units, which are located at Headquarters, are the Office of the Director General and Corporate Management.
For the purposes of “Chapter II: Management Costs,” the Office of the Director General comprises the Office of the Director General, the Office of the Deputy Director General, the Coordination of the Office of the Director General, the Internal Audit Unit, the Legal Advisory Services Unit, and the Social Communication Unit.
Corporate Management includes the Office of the Secretary of Corporate Services and the management of finances, human talent, programming and budgeting, and general services. These resources also include Headquarters’ costs related to security, public utilities, janitorial services, transportation, procurement, the main switchboard, document processing, maintenance of buildings and grounds, among others.
The resources that these units use to renew their infrastructure and equipment are not included (Chapter IV).
The resources allocated to cover management costs decrease from 5.3% of the Regular Fund in 2013 to 4.9% in 2014 and to 4.8% in 2015. (See Table 6).
The resources allocated for this Chapter are:
Table D
Chapter II: Management Costs Regular Fund (USD) Source 2014 2015 Quotas 1,589,883 1,563,739 Miscellaneous 68,438 65,438 Total 1,658,321 1,629,177 24,000 25,000 26,000 27,000 28,000 29,000 30,000 31,000 32,000 2007 2008 2009 2010 2011 2012 2013 2014 2015
Figure 3
Technical Cooperation Services (Chapter I)
Regular Fund
2007 to 2015 Program Budgets In 000 of USD +1.7% 0.0% +7.4% -1.1% +1.7% +0.9% +0,7% +0,1%CHAPTER III: GENERAL COSTS AND PROVISIONS
General costs and provisions are general commitments not directly related to the preceding chapters, or to a specific unit. They include funding for the governing bodies; institutional insurance; the contribution to the administration of the OAS Administrative Tribunal and the OAS Retirement and Pension Fund; External Audit; pensions of former Directors General; and the Emergency Assistance Fund for Institute Personnel.
The resources for this chapter are:
Table E
Chapter III: General Costs and Provisions Regular Fund (USD) Source 2014 2015 Quotas 1,230,000 1,260,000 Miscellaneous 20,000 20,000 Total 1,250,000 1,280,000
The resources allocated to general costs and provisions increase from 3.7% of the Regular Fund in 2014 to 3.8% in 2015, due basically to the increase in the contribution to health insurance for former members of the Institute’s International Professional Personnel. (See Table 6)
CHAPTER IV: RENEWAL OF INFRASTRUCTURE AND EQUIPMENT
The budget items included in this Chapter are the conservation and maintenance of IICA-owned buildings and properties, and the renewal of vehicles, equipment, and software licenses, both at Headquarters and in the 34 Offices in the Member States.
Table F
Chapter IV: Renewal of Infrastructure and Equipment Regular Fund (USD) Source 2014 2015 Quotas 98,398 108,910 Miscellaneous 258,744 208,898 Total 357,142 317,808
The resources allocated to renew infrastructure and equipment decrease from 1.2% of the Regular Fund in 2013 to 1.1% in 2014 and to 0.9% in 2015. The austerity budget strategy continues to have a major negative impact on this Chapter (See Table 6).
9
V.
ALLOCATION OF RESOURCES FROM THE REGULAR FUND FOR 2015 BY MAJOR
OBJECT OF EXPENDITURE
he staff and operating costs for 2015 financed with resources from the Regular Fund are shown in Table 7: i) allocations by groups of objects of expenditure (International Professional Personnel, Local Professional Personnel, General Services Personnel and Operating Costs); ii) the number of personnel positions, by category and classification; and, iii) the sources of financing. Table 8 shows the absolute and relative variations in each of the major objects of expenditure in 2014 and 2015.
Table 9 shows staff positions financed with resources from the Regular Fund between 1992 and 2015. The Institute plans to finance 3 fewer international professional positions and 2 fewer local professional positions than in 2014, and to create a further 7 general services positions.
These tables show:
o The amount allocated to cover the costs of International Professional Personnel (79 positions), which falls from USD11,440,600 in 2014 to USD11,142,300 (-2.6%) in 2015, due to the combined effect of the elimination of 3 positions financed with Regular Fund resources, variations in the classifications of some specialists and Representatives in the Member States, and a 3% increase in the salary scale.
o The total cost of Local Professional Personnel (149 positions) is USD7,685,100 in 2014 and USD7,321,200 (-4.7%) in 2015, due to the elimination of 2 posts, changes in classifications, expected salary increases and the effect of the variation in the exchange rate of the US dollar against other currencies.
o The cost of General Services Personnel is USD3,926,300 in 2014, rising to USD4,183,300 in 2015 (+6.5%), with the number of positions also increasing, from 194 to 201 (7 more).
o An average salary increase of 5.3% for local personnel is estimated for 2014, and 5.4% in 2015, which, combined with the variations in the exchange rate of the US dollar against other currencies, the elimination of 2 Local Professional Personnel positions and the creation of 7 new General Services Personnel posts, results in a 0.9% reduction in costs in US dollars. o Operating costs total USD10,858,100 in 2014 and USD11,263,200 (+3.7%) in 2015, making it
possible to halt the continuous fall in operating costs in recent years, as can be seen in Figure 4, which also shows the evolution of personnel costs, whose growth will be curbed with the elimination of positions.
Table G, which corresponds to Table 8 in the attachment, presents the distribution of the Regular Fund by major object of expenditure (MOE) for 2015, and shows the distribution approved in the 2014 Program Budget, for comparative purposes.
USD x 000 % US$ x 000 %
1 International Professional Personnel 11,440.6 33.7% 11,142.3 32.9%
2 Local Professional and General Services Personnel 11,611.4 34.2% 11,504.5 33.9%
23,051.9 68.0% 22,646.8 66.8%
3 Training and Technical Events 1,618.9 4.8% 1,911.3 5.6%
4 Official Travel 1,231.0 3.6% 1,221.2 3.6%
5 Documents and Materials and Supplies 851.7 2.5% 851.9 2.5%
6 Plant, Equipment and Furniture 357.1 1.1% 317.8 0.9%
7 General Services 2,922.4 8.6% 2,914.2 8.6%
8 Performance Contracts and Transfers * 3,014.8 8.9% 3,197.0 9.4%
9 Other Costs 862.2 2.5% 849.8 2.5%
10,858.1 32.0% 11,263.2 33.2%
33,910.0 100.0% 33,910.0 100.0%
*/ Includes USD 1,000,000 to CATIE and USD 200,000 to CARDI.
Table G
Resources of the Regular Fund by Major Object of Expenditure
Major Object of Expenditure 2014 2015
SUBTOTAL PERSONNEL COSTS
SUBTOTAL OPERATING COSTS GRAND TOTAL (USD x 000) 10,000.0 12,000.0 14,000.0 16,000.0 18,000.0 20,000.0 22,000.0 24,000.0 2007 2008 2009 2010 2011 2012 2013 2014 2015
Figure 4
Nominal Evolution Personnel and Operating Costs
Regular Fund Resources 2007 to 2015 Program Budgets
(In 000 of USD)
11
Figure 5 shows the relative weight of each major object of expenditure for 2014 and 2015.The following conclusions can be drawn from the data in tables 7, 8 and 9:
o Personnel costs decrease from 68% in 2014 to 66.8% in 2015, with a negative impact on the Institute’s technical capacity (the number of professionals falls from 239 in 2013 to 233 in 2014 and to 228 in 2015). The figure includes a 3% increase in the salary scale of the International Professional Personnel and an average of 5.35% in local currencies for local personnel, to maintain IICA’s competitiveness in labor markets to some extent.
o Operating costs rise from 31.3% in 2013 to 32% in 2014 and 33.2% in 2015 with an increase of USD405,100 in 2015 over 2014. The items that increase are related to the direct delivery of technical cooperation, Major Object of Expenditure (MOE) 3, Training and Technical Events (18.1%) and MOE 8, Performance Contracts (6.0%).
o The operating expenses that decrease are MOE 4, Official Travel (-0.83%), in a context of higher costs and, as a result, the application of an austerity policy in relation to international travel established by the Director General, and more and better use of the Institute’s videoconferencing facilities; MOE 6, Plant, Equipment and Furniture (-11%), with restrictions on purchases of equipment and furniture posing a challenge for IICA, one that will have to be reviewed in the future; and, MOE 7, General Services, based on a reduction in the cost of communications, correspondence and rents, despite higher prices (-0.3%), among others. o MOE 5, Documents and Materials and Supplies, remains unchanged in nominal terms, as a
result of the strategy of giving priority to electronic publications and making better use of the materials and supplies of the offices and projects.
his proposed Program Budget of Expenditures for 2015 is designed to channel the Institute’s resources toward the implementation of the new 2014-2018 Medium-term Plan, allocating the Regular Fund primarily to flagship projects and technical cooperation actions, in order to achieve the contributions to which IICA is committed under the four objectives of the 2010-2020 Strategic
Figure 5
Distribution of the Regular Fund by Major Object of Expenditure 2014-2015
32.9% 33.9% 5.6% 3.6% 2.5% 0.9% 8.6% 9.4% 2.5% 33.7% 34.2% 4.8% 3.6% 2.5% 1.1% 8.6% 8.9% 2.5% 1. International Professional Personnel
2. Local Professional and General Services Personnel 3. Training and Technical Events
4. Official Travel 5. Documents and Materials and Supplies
6. Plant, Equipment and Furniture
7. General Services 8. Performance Contracts and Transfers 9. Other Costs 4 1 2 3 5 7 8 9 6
2014
1 2 3 4 7 8 9 6 52015
T
Plan, in a context of financial constraints, permanently rising staff and operating costs, and a gradual loss of competitiveness in labor markets.
In the present circumstances, this proposal provides a reasonable response to the technical cooperation priorities set by the governing bodies, as part of a process of continuous improvement and based on criteria such as quality, effectiveness, rationality, equity, transparency and accountability, and a results-based management approach.
13
VI.
LIST OF TABLES ATTACHED
Table 1 Overall Budget. 2014 and 2015 Program Budgets (in thousands of US dollars)
Table 2 Quota Scale of the Member States, Contributions of Over-quotas, and Miscellaneous Income for 2014 and 2015 (USD)
Table 3 Budget for Income from the Regular Fund. 2013, 2014 and 2015 Program Budgets (in thousands of US dollars)
Table 4 Budget for Expenditures from the Regular Fund by Programming Center. 2015 (USD)
Table 5 Evolution of the Regular Fund in Nominal Values. 1994 to 2015 (in thousands of US dollars)
Table 6 Allocation of the Regular Fund by Chapter – 2014 and 2015 (USD)
Table 7 Overall Allocation of the Regular Fund: Quotas and Miscellaneous Income (USD and Number of Personnel Positions)
Table 8 Relative Weight and Evolution of Major Objects of Expenditure of the Regular Fund. 2014 and 2015 Program Budgets (in thousands of US dollars and %)
Table No. 1
2015
Program Budget
2014 2015
REGULAR FUND:
QUOTAS OF MEMBER STATES 27,810.0 27,810.0 MISCELLANEOUS INCOME 6,100.0 6,100.0 TOTAL REGULAR FUND 33,910.0 33,910.0 EXTERNAL RESOURCES FOR PROGRAMS AND PROJECTS* 150,000.0 170,000.0
INSTITUTIONAL NET RATE * 10,650.0 12,410.0
194,560.0
216,320.0
*/ Estimates. Final figures will depend on the agreements signed and executed.
Overall Budget
2014 and 2015 Program Budgets
(USD x 000)
RESOURCES BY SOURCE
Table No. 2
2013
OEA1
TOTAL QUOTAS ASSESSED QUOTA QUOTAOVER - TOTAL QUOTAS ASSESSED QUOTA QUOTAOVER- QUOTASTOTAL
USD USD3 USD3 USD3 USD3 USD3 USD3
Antigua and Barbuda 6,100 0.022 0.022 6,100 0 6,100 0.022 6,100 0 6,100
Argentina 883,300 2.408 2.408 662,400 220,900 883,300 2.408 662,400 220,900 883,300 Bahamas 17,100 0.062 0.062 17,100 0 17,100 0.062 17,100 0 17,100 Barbados 12,400 0.045 0.045 12,400 0 12,400 0.045 12,400 0 12,400 Belize 6,100 0.022 0.022 6,100 0 6,100 0.022 6,100 0 6,100 Bolivia 13,500 0.049 0.049 13,500 0 13,500 0.049 13,500 0 13,500 Brazil 2,734,600 9.941 9.941 2,734,600 0 2,734,600 9.941 2,734,600 0 2,734,600 Canada 3,293,300 11.972 11.972 3,293,300 0 3,293,300 11.972 3,293,300 0 3,293,300 Chile 327,100 1.189 1.189 327,100 0 327,100 1.189 327,100 0 327,100 Colombia 288,600 1.049 1.049 288,600 0 288,600 1.049 288,600 0 288,600 Costa Rica 60,800 0.221 0.221 60,800 0 60,800 0.221 60,800 0 60,800 Dominica 6,100 0.022 0.022 6,100 0 6,100 0.022 6,100 0 6,100 Dominican Republic 70,700 0.257 0.257 70,700 0 70,700 0.257 70,700 0 70,700 Ecuador 71,000 0.258 0.258 71,000 0 71,000 0.258 71,000 0 71,000 El Salvador 34,400 0.114 0.114 31,400 3,000 34,400 0.114 31,400 3,000 34,400 Grenada 6,100 0.022 0.022 6,100 0 6,100 0.022 6,100 0 6,100 Guatemala 51,400 0.168 0.168 46,200 5,200 51,400 0.168 46,200 5,200 51,400 Guyana 6,700 0.022 0.022 6,100 600 6,700 0.022 6,100 600 6,700 Haiti 9,400 0.034 0.034 9,400 0 9,400 0.034 9,400 0 9,400 Honduras 14,000 0.051 0.051 14,000 0 14,000 0.051 14,000 0 14,000 Jamaica 25,600 0.093 0.093 25,600 0 25,600 0.093 25,600 0 25,600 Mexico 2,495,300 8.281 8.281 2,278,000 217,300 2,495,300 8.281 2,278,000 217,300 2,495,300 Nicaragua 9,400 0.034 0.034 9,400 0 9,400 0.034 9,400 0 9,400 Panama 47,600 0.158 0.158 43,500 4,100 47,600 0.158 43,500 4,100 47,600 Paraguay 28,100 0.093 0.093 25,600 2,500 28,100 0.093 25,600 2,500 28,100 Peru 189,300 0.688 0.688 189,300 0 189,300 0.688 189,300 0 189,300
Saint Kitts and Nevis 6,100 0.022 0.022 6,100 0 6,100 0.022 6,100 0 6,100
Saint Lucia 6,100 0.022 0.022 6,100 0 6,100 0.022 6,100 0 6,100
Saint Vincent and the Grenadines 6,100 0.022 0.022 6,100 0 6,100 0.022 6,100 0 6,100
Suriname 9,400 0.034 0.034 9,400 0 9,400 0.034 9,400 0 9,400
Trinidad and Tobago 49,500 0.180 0.180 49,500 0 49,500 0.180 49,500 0 49,500
United States of America 16,359,400 59.470 59.470 16,359,400 0 16,359,400 59.470 16,359,400 0 16,359,400
Uruguay 64,100 0.214 0.214 58,900 5,200 64,100 0.214 58,900 5,200 64,100 Venezuela 601,300 2.186 2.186 601,300 0 601,300 2.186 601,300 0 601,300 SUB TOTAL 27,810,000 99.425 99.425 27,351,200 458,800 27,810,000 99.425 27,351,200 458,800 27,810,000 Cuba 158,200 0.575 0.575 158,200 0 158,200 0.575 158,200 0 158,200 TOTAL QUOTAS 27,968,200 100.000 100.000 27,509,400 458,800 27,968,200 100.000 27,509,400 458,800 27,968,200 MISCELLANEOUS INCOME 2 6,100,000 6,100,000 6,100,000 TOTAL REGULAR FUND4
33,910,000 33,910,000 33,910,000 Notes: 1) Approved by the Inter-American Board of Agriculture (IABA) by means of Resolution No. 485, adopted on September 26,2013 during the Board's Seventeenth Regular Meeting, held in Buenos Aires, Argentina. 2) The Kingdom of Spain contributes and annual quota of USD 60,000 as an Associate State, as per an agreement reached in the First Plenary Session of the Eleventh Regular Meeting of the Inter-American Board of Agriculture, held on November 26, 2001, in Bávaro, Dominican Republic; 3) The 2013 quotas include Guyana's over-quota.
IICA IICA IICA
% % %
2014-2015 Programa Budget
Quota Scales of the Member States, Contributions of Over-quotas, and Miscellaneous Income for 2014-2015 (USD)
MEMBER STATES
Table No. 3
2015
Program Budget
2013 2014 2015 USD % USD %
REGULAR FUND:
QUOTAS OF MEMBER STATES 27,810.0 27,810.0 27,810.0 - 0.0% - 0.0% MISCELLANEOUS INCOME 6,100.0 6,100.0 6,100.0 - 0.0% - 0.0% TOTAL REGULAR FUND 33,910.0 33,910.0 33,910.0 0.0 0.0% 0.0 0.0%
2014 - 2013 2015 - 2014 RESOURCES BY SOURCE
Budget for Income from Regular Fund
2013, 2014 and 2015 Program Budgets
(USD x 000)
BUDGET VARIATIONS
Table No. 4
Program Budget
IPP
No. IPP USD LPP No. LPP USD GSP No. GSP USD LPP+GSP No. Total Personnel No. Total Personnel USD Operating Costs TOTAL REGULAR FUND I. 73 9,865,636 145 7,117,619 188 3,934,285 333 406 20,917,540 9,925,544 30,843,084 - - - - - - - - - -A. OFFICE OF THE DIRECTOR OF TECHNICAL COOPERATION 1 159,381 1 86,979 1 21,526 2 3 267,886 73,000 340,886 B. FLAGSHIP PROJECTS 30 3,821,804 91 4,401,980 34 800,395 125 155 9,024,179 2,100,000 11,124,179 C. RAPID RESPONSE ACTIONS - - - - - - - - - 1,155,002 1,155,002 D. LINE/ITEM FOR TECHNICAL COOPERATION PROJECTS - - - - - - - - - 1,000,000 1,000,000 E. SUPPORT FOR COOPERATIVE PROGRAMS 4 537,897 2 47,927 1 21,556 3 7 607,380 182,500 789,880
1. Programa Hemisférico de Apoyo a la Consolidación Técnica y Estratégica del FONTAGRO y de su Secretaría - - - - - - - - - 8,000 8,000
2. Secretaría Técnica de la Comisión Interamericana de Agricultura Orgánica - CIAO - - 1 31,372 - - 1 1 31,372 19,500 50,872
3. Regional Cooperative Program for the Protection and Modernization of Coffee Cultivation in Central America, Panama and the Dominican Republic - PROMECAFE
1
124,859 - - - - - 1 124,859 - 124,859
4. Cooperative Program for the Development of Agricultural Technology in the Southern Cone - PROCISUR 1 139,902 1 16,555 1 21,556 2 3 178,013 - 178,013
5. Cooperative Program on Research and Technology Transfer for the South American Tropics - PROCITROPICOS 1 137,755 - - - - - 1 137,755 - 137,755
6. Cooperative Program in Research and Technology for the Northern Region - PROCINORTE 1 135,381 - - - - - 1 135,381 70,000 205,381
7. Support to the System for the Central America Agricultural Technology Integration System - - - - - - - - - 5,000 5,000
8. Support to the Development and Strengthening of National Agricultural Health Systems in the Countries of the Southern Cone to Facilitate International Agricultural Trade - COSAVE
- - - - - - - - 20,000 20,000
9. Support to the Permanent Veterinary Committee of the Southern Cone - CVP - - - - - - - - - 60,000 60,000
F. SUPPORT FOR INTEGRATION PROJECTS 1 127,153 1 58,150 1 25,930 2 3 211,233 234,200 445,433
1. Support to Central American Agricultural Council - CAC 1 127,153 - - 1 25,930 1 2 153,082 - 153,082 2. Support to Alliance for Sustainable Development in the Caribbean - - - - - - - - - 100,000 100,000 3. Support to CARICOM - - 1 58,150 - - 1 1 58,150 15,000 73,150 4. Support to the Secretariat of the Agricultural Council of the South - CAS and to the Agricultural Policy Coordination Network of the South - REDPA - - - - - - - - - 119,200 119,200
G. 29 4,101,067 25 1,373,504 141 2,867,903 166 195 8,342,474 3,278,303 11,620,777 1. Belice 1 135,829 - - 2 38,646 2 3 174,475 41,834 216,309 2. Costa Rica 1 141,850 1 33,918 5 89,105 6 7 264,872 34,623 299,495 3. Guatemala 1 142,454 1 53,399 4 51,536 5 6 247,388 105,087 352,475 4. Honduras 1 141,571 1 53,454 5 49,039 6 7 244,064 105,568 349,632 5. Nicaragua 1 131,619 1 25,053 3 28,780 4 5 185,452 96,107 281,559 6. Panamá 1 148,508 1 59,221 4 82,970 5 6 290,699 103,602 394,301 7. El Salvador 1 140,141 2 52,725 6 82,820 8 9 275,686 32,010 307,696 8. Barbados 1 130,349 - - 5 133,035 5 6 263,383 63,526 326,909 9. ECS 1 123,299 - - 4 122,873 4 5 246,172 - 246,172 10. Guyana 1 131,332 - - 8 71,871 8 9 203,203 57,700 260,903 11. Haití 1 149,846 - - 6 109,051 6 7 258,897 96,568 355,465 12. Jamaica 1 129,664 - - 8 127,335 8 9 256,999 78,071 335,070 13. Bahamas 1 139,798 - - 2 55,717 2 3 195,516 36,000 231,516
2015
Budget for Expenditure from the Regular Fund by Programming Center
2015 - USD
PROGRAMMING CENTERS
BASIC TECHNICAL COOPERATION STRUCTURE IN THE MEMBER STATES
TECHNICAL COOPERATION (Includes Chapter IV: Renewal of Instraestructure and equipment)
Page 5 of 10
IPP
No. IPP USD LPP No. LPP USD GSP No. GSP USD LPP+GSP No. Total Personnel No. Total Personnel USD Operating Costs TOTAL REGULAR FUND PROGRAMMING CENTERS 15. Surinam 1 129,789 - - 3 36,728 3 4 166,517 78,450 244,967 16. Trinidad y Tobago 1 143,180 - - 3 115,321 3 4 258,501 119,156 377,657 17. Bolivia 1 134,985 1 67,103 6 94,844 7 8 296,932 52,650 349,582 18. Colombia 1 146,649 - - 9 197,996 9 10 344,646 126,500 471,146 19. Ecuador 1 141,779 2 88,658 5 75,659 7 8 306,096 128,032 434,128 20. Perú 1 147,672 1 58,795 7 140,138 8 9 346,605 114,894 461,499 21. Venezuela 1 160,766 1 93,630 6 144,809 7 8 399,205 50,650 449,855 22. Argentina 1 139,447 2 139,414 5 131,534 7 8 410,394 80,430 490,824 23. Brasil 1 168,030 4 274,461 6 186,984 10 11 629,475 714,409 1,343,884 24. Chile 1 137,136 1 57,506 6 132,933 7 8 327,574 75,702 403,276 25. Paraguay 1 136,790 2 75,723 4 60,060 6 7 272,573 56,486 329,059 26. Uruguay 1 149,141 1 79,904 4 111,527 5 6 340,572 63,705 404,277 27. Canadá 1 148,040 - - 1 54,703 1 2 202,743 272,555 475,298 28. Estados Unidos de America 1 155,261 - - 3 170,677 3 4 325,938 289,900 615,838 29. México 1 136,410 2 114,652 4 78,711 6 7 329,773 117,711 447,484
H. 8 1,118,334 25 1,149,079 10 196,976 35 43 2,464,389 402,539 2,866,928
1. Management and Regional Integration 2 303,094 2 65,254 2 43,024 4 6 411,372 65,000 476,372 2. Planning and Evaluation 1 154,693 4 203,150 2 39,740 6 7 397,583 42,000 439,583 3. Permanent Office for Europe * - - - - - - - - - - -4. Formulation, promotion and evaluation of projects 5 660,546 1 39,696 - - 1 6 700,242 60,000 760,242 5. Information and Editorial Production - - 7 298,947 2 39,749 9 9 338,696 40,000 378,696 6. Information and Communication Technologies - - 1 71,490 1 20,778 2 2 92,268 70,000 162,268 7. Promotion of Technical Capacities and Leadership - - 5 277,690 1 25,164 6 6 302,854 25,000 327,854 8. Center for Strategic Analysis for Agriculture - - 5 192,852 2 28,521 7 7 221,372 50,539 271,911 9. Strenghtening of Technical Capabilities - - - - - - - - - 50,000 50,000
I. - - - - - - - - - 1,200,000 1,200,000
1. Support to Tropical Agricultural Research and Higher Education Center - CATIE - - - - - - - - - 1,000,000 1,000,000 2. Support to Caribbean Agricultural Research and Development Institute - CARDI - - - - - - - - - 200,000 200,000
J. - - - - - - - - - 300,000 300,000
1. Stabilization for loss of purchasing of USD and Funding Cycles for Projects - - - - - - - - - 300,000 300,000
II. 6 971,631 4 193,597 13 239,033 17 23 1,404,261 232,655 1,636,916 A. Office of the Director General (Chapter II) 3 516,292 - - 1 34,464 1 4 550,756 94,717 645,473 B. Corporate Management (Chapter II) 3 455,339 4 193,597 12 204,569 16 19 853,505 137,938 991,443 III. CORPORATE ACTIVITIES - 305,000 - 10,000 - 10,000 - - 325,000 1,105,000 1,430,000
1. Renewal of Equipment and Vehicles - - - - - - - - - 150,000 150,000 2. Governing Bodies - - - - - - - - - 400,000 400,000 3. Insurance - - - - - - - - - 450,000 450,000 4. Pensions Former Directors - 280,000 - - - - - - 280,000 - 280,000 5. Contribution to the Administration of the Retirement and Pension Fund - 25,000 - - - - - - 25,000 - 25,000 6. Contribution to the OAS Administrative Tribunal - - - - - - - - - 25,000 25,000 7. External Audit - - - - - - - - - 80,000 80,000 8. Emergency Assistance Program for Staff - - - 10,000 - 10,000 - - 20,000 - 20,000
79
11,142,267 149 7,321,216 201 4,183,318 350 429 22,646,801 11,263,199 33,910,000
*/ The Permanent Office for Europe is funded with USD 100,000 in INR resources per year.
MANAGEMENT UNITS (Includes Chapther IV: Renewal of Infraestructure and equipment)
Total
TECHNICAL SERVICES IN SUPPORT OF COOPERATION
SUPPORT FOR AGRICULTURAL RESEARCH CENTERS
LINE/ITEM FOR STABILIZATION FOR LOSS OF PURCHASING OF USD AND CYCLES FOR PROJECTS
1994 26,707.5 2,297.3 29,004.8 1995 27,508.7 2,127.5 29,636.2 1996 27,508.7 2,527.2 30,035.9 1997 27,508.7 3,258.1 30,766.8 1998 27,508.7 2,491.3 30,000.0 1999 27,508.7 2,491.3 30,000.0 2000 27,508.7 2,491.3 30,000.0 2001 27,508.7 2,491.3 30,000.0 2002 27,508.7 2,491.3 30,000.0 2003 27,167.6 2,832.4 30,000.0 2004 27,167.6 2,832.4 30,000.0 2005 27,167.6 2,832.4 30,000.0 2006 27,167.6 2,832.4 30,000.0 2007 27,167.6 2,832.4 30,000.0 2008 27,227.8 4,100.0 31,327.8 2009 27,227.8 4,100.0 31,327.8 2010 27,298.2 6,100.0 33,398.2 2011 27,298.2 6,100.0 33,398.2 2012 27,689.6 6,100.0 33,789.6 2013 27,810.0 6,100.0 33,910.0 2014 27,810.0 6,100.0 33,910.0 2015 27,810.0 6,100.0 33,910.0
Note: The Cuban quota was excluded from the quota resources as of 2003.
Table No. 5
2015
Program Budget
PERIOD QUOTAS MISCELLANEOUS REGULAR FUND
Evolution of the Regular Fund in Nominal Values
1994 to 2015 (USD x 000)
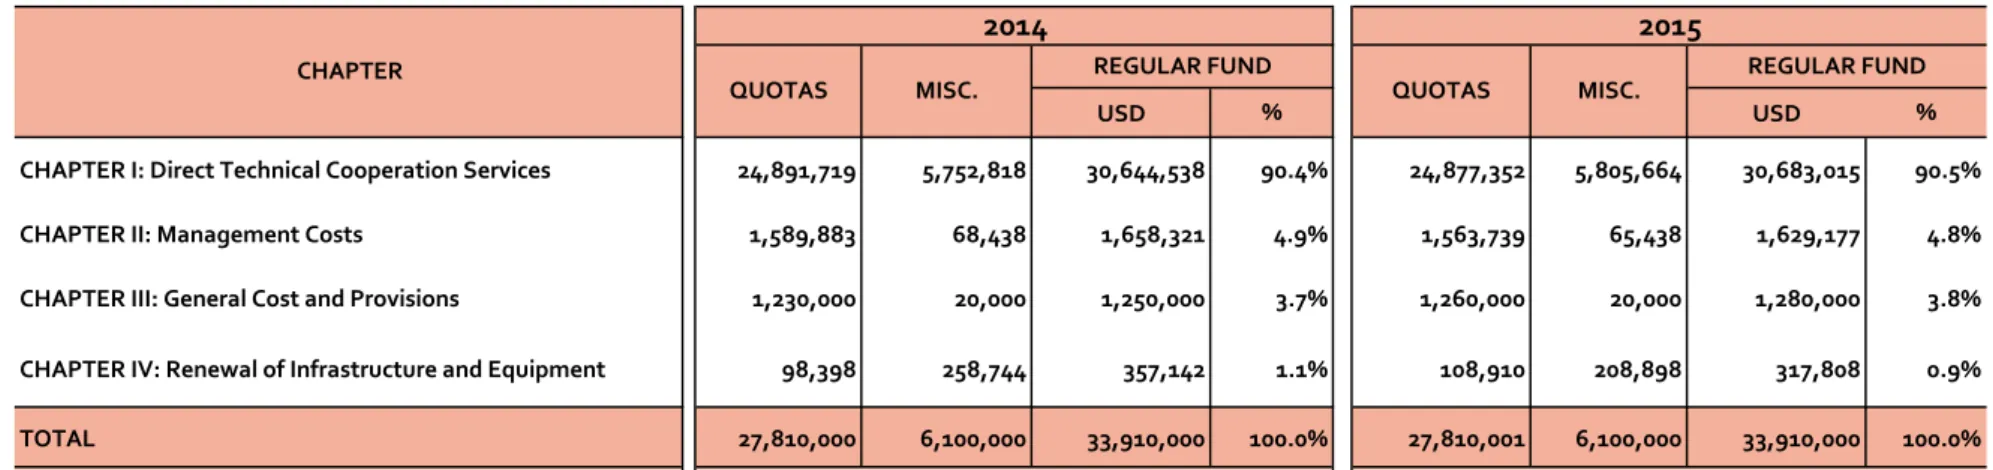
Table No. 6
Program Budget
USD USD
CHAPTER I: Direct Technical Cooperation Services 24,891,719 5,752,818 30,644,538 90.4% 24,877,352 5,805,664 30,683,015 90.5% CHAPTER II: Management Costs 1,589,883 68,438 1,658,321 4.9% 1,563,739 65,438 1,629,177 4.8% CHAPTER III: General Cost and Provisions 1,230,000 20,000 1,250,000 3.7% 1,260,000 20,000 1,280,000 3.8% CHAPTER IV: Renewal of Infrastructure and Equipment 98,398 258,744 357,142 1.1% 108,910 208,898 317,808 0.9% TOTAL 27,810,000 6,100,000 33,910,000 100.0% 27,810,001 6,100,000 33,910,000 100.0%
MISC. REGULAR FUND
% %
MISC. REGULAR FUND QUOTAS CHAPTER
2014 2015
QUOTAS
Allocation of the Regular Fund by Chapter - 2014 and 2015
(USD)
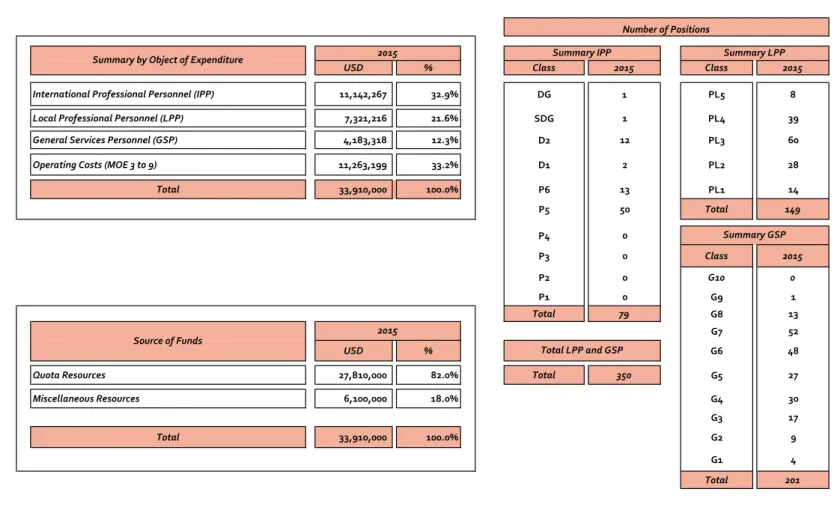
Table No. 7
2015
Program Budget
USD % Class 2015 Class 2015 International Professional Personnel (IPP) 11,142,267 32.9% DG 1 PL5 8
Local Professional Personnel (LPP) 7,321,216 21.6% SDG 1 PL4 39
General Services Personnel (GSP) 4,183,318 12.3% D2 12 PL3 60
Operating Costs (MOE 3 to 9) 11,263,199 33.2% D1 2 PL2 28
Total 33,910,000 100.0% P6 13 PL1 14 P5 50 Total 149 P4 0 P3 0 Class 2015 P2 0 G10 0 P1 0 G9 1 Total 79 G8 13 G7 52 USD % G6 48
Quota Resources 27,810,000 82.0% Total 350 G5 27
Miscellaneous Resources 6,100,000 18.0% G4 30 G3 17
Total 33,910,000 100.0% G2 9 G1 4
Total 201
Overall Allocation of the Regular Fund: Quotas and Miscellaneous Income
(USD and Number of Personnel Positions)
Number of Positions
Summary by Object of Expenditure 2015 Summary IPP Summary LPP
Summary GSP
Source of Funds 2015
Table No. 8
USD x 000 % USD x 000 % USD x 000 %
1 International Professional Personnel 11,440.6 33.7% 11,142.3 32.9% -298.3 -2.6% 2 Local Professional and General Services Personnel 11,611.4 34.2% 11,504.5 33.9% -106.8 -0.9%
23,051.9 68.0% 22,646.8 66.8% -405.1 -1.8%
3 Training and Technical Events 1,618.9 4.8% 1,911.3 5.6% 292.4 18.1%
4 Official Travel 1,231.0 3.6% 1,221.2 3.6% -9.7 -0.8%
5 Documents and Materials and Supplies 851.7 2.5% 851.9 2.5% 0.3 0.0%
6 Plant, Equipment and Furniture 357.1 1.1% 317.8 0.9% -39.3 -11.0%
7 General Services 2,922.4 8.6% 2,914.2 8.6% -8.2 -0.3%
8 Performance Contracts and Transfers 3,014.8 8.9% 3,197.0 9.4% 182.2 6.0%
9 Other Costs 862.2 2.5% 849.8 2.5% -12.4 -1.4%
10,858.1 32.0% 11,263.2 33.2% 405.1 3.7% 33,910.0 100.0% 33,910.0 100.0% (0.0) 0.0% SUBTOTAL PERSONNEL COSTS
SUBTOTAL OPERATING COSTS GRAND TOTAL
Major Object of Expenditure 2014 2015 2015-2014
VARIATIONS
2015
Program Budget
Relative Weight and Evolution of the Major Objects of Expenditure of the Regular Fund
2014 and 2015 Program Budgets
(USD x 000 and %)
Table No. 9
1992 to 2015 Program Budgets
YEAR IPP LPP GSP TOTAL
1992 134 82 346 562 1993 134 79 344 557 1994 132 80 349 561 1995 132 81 312 525 1996 121 87 289 497 1997 117 95 285 497 1998 110 98 249 457 1999 103 101 247 451 2000 99 97 251 447 2001 99 97 251 447 2002 96 101 238 435 2003 93 120 221 434 2004 94 126 230 450 2005 94 126 230 450 2006 94 131 237 462 2007 94 131 227 452 2008 94 135 227 456 2009 94 135 227 456 2010 95 152 213 460 2011 93 157 213 463 2012 88 151 208 447 2013 88 151 208 447 2014 82 151 194 427 2015 79 149 201 429
IPP: International Professional Personnel LPP: Local Professional Personnel GSP: General Services Personnel