Tadeusz Stadnik, MD #{149}Achille Stevenaert, MD #{149}Albert Beckers, MD #{149}Robert Luypaert, PhD #{149} Th#{233}r#{232}seBuisseret, MD #{149}Michel Osteaux, MD
Pituitary
Microadenomas:
Diagnosis
with
Two-and
Three-dimensional
MR
Imaging
at
1
.5
T
before
and
after
Injection
of Gadolinium’
The usefulness of different magnet-ic resonance (MR) imaging se-quences (coronal and sagittal spin-echo [SE] and three-dimensional fast
low-angle shot [3D FLASH]) in the
detection of pituitary microadeno-mas before and after gadolinium in-jection was prospectively evaluated in 28 patients with surgical confir-mation. When evaluated separately, the most useful sequences in the de-tection of these microadenomas
were coronal pregadolinium
Ti-weighted SE, coronal pregadolinium 3D FLASH, coronal postgadolinium Ti-weighted SE, and coronal
post-gadolinium 3D FLASH. The
combi-nation of pre- and postgadolinium
Ti-weighted sequences with
pre-and postgadolinium 3D FLASH
se-quences produced the highest
num-ber of true-positive findings (90%) and the lowest number of false-pos-itive findings (5%). When a i.5-T imaging unit with a high signal-to-noise ratio allowing useful three-di-mensional acquisition is used, the authors advocate a coronal Ti-weighted SE sequence, followed (if
necessary) by a coronal 3D FLASH
sequence, both without injection of gadolinium, in the diagnosis of
pi-tuitary microadenomas. When no
confident diagnosis is reached, the same sequences should be per-formed after the injection of gado-linium. The sagittal pre- and
post-gadolinium Ti-weighted SE and
long-TR SE sequences are useful only in specific cases.
Index terms: Gadolinium #{149}Magnetic reso-nance (MR), comparative studies #{149}Magnetic resonance (MR), contrast enhancement #{149} Pitu-itary, MR studies, 145.1214 #{149}Pituitary, neo-plasms, 145.363
Radiology 1990; 176:419-428
H
ICH-RESOLUTIONhigh-magnetic-field magnetic resonance (MR)
imaging is becoming widely accepted
as the most sensitive imaging
meth-od in the diagnosis of pituitary
mi-croadenomas. A true-positive rate of
81%-100% has been reported in MR
imaging at 1 .5 T in the detection of
microadenomas without injection of
contrast material (1-4). Previous
studies also suggest a higher mate of
detection after gadolinium injection
(5-8). The aim of this study was to
evaluate different sequences and
gadolinium injection in the diagnosis
of pituitary microadenomas by
means of optimized high-resolution,
high-magnetic-field-strength MR
im-aging with the capability of
three-di-mensional acquisition. The use of
three-dimensional acquisition is
promising in the diagnosis of
pitu-itary microadenomas. Indeed, the
very small section thickness (up to 1
mm) and high signal-to-noise ratio of
three-dimensional acquisition are
im-portant advantages with respect to
the conventional spin-echo (SE)
se-quences (minimal section thickness
of 2 mm produces a poor
signal-to-noise ratio, to improve which
neces-sitates four or eight excitations).
PATIENTS AND METHODS
Seventy-seven patients suspected of
having microadenomas on the basis of
clinical and/on computed tomographic
(CT) findings were evaluated between
September 1987 and April 1989 on a i.5-T
MR imaging unit (Magnetom; Siemens,
‘From the Department of Radiology and Medical Imaging, University Hospital Vrije Universiteit Brussel, Laarbeeklaan 101, 1090 Brussels, Belgium (T.S., R.L., TB., MO.), and the Departments of Neurosurgery (AS.) and Endocrinology (A.B.), University Hospital of Liege, Liege, Belgium. Received October 19, 1989; revision requested November 28; final re-vision received April 4, 1990; accepted April 16. Address reprint requests to T.S.
!#{231}RSNA, 1990
Erlangen, Federal Republic of Germany) that allowed three-dimensional
acquisi-tions. Twenty-eight patients underwent a
transsphenoidal exploration; this report
covers only the data from these patients.
The microadenoma was found during
surgery in 27 patients (20 patients with a
prolactinoma, six with an adnenocortico-tropic hormone (ACTH)-secneting
adeno-ma, and one patient with a growth-hon.
mone-secreting microadenoma). In one
patient with Cushing syndrome, only a
multinodular hyperplasia was found. The
indications for surgery in the patients
with prolactinomas were the patient’s
preference for surgical removal of the
mi-croadenoma and the unsuccessful or ill-tolerated treatment with bromocniptine.
The transsphenoidal resection was
pen-formed only if a focal abnormality and/on
indirect signs of a microadenoma were
present at CT and/or MR imaging
con-jointly with an abnormal prolactin level.
In seven cases of Cushing syndrome
din-ically suspected to be of pituitary origin,
the transsphenoidal exploration was
start-ed on the side of focal abnormality
detect-ed at CT and/or MR imaging. If no
ade-noma was found, a total hypophysectomy
was performed (one patient).
All patients were initially evaluated without gadolinium injection. A coronal
Ti-weighted SE 600/15 (repetition time
[TR] msec/echo time [TE] msec) sequence
with four excitations was performed in all
28 patients who underwent surgery, and
a coronal three-dimensional fast
low-an-gle shot (3D FLASH) (40-70/6, one on two excitations, 32 or 64 partitions) was
per-formed in 27 patients (one technical
mci-dent [motion of the patient] occurred). A
sagittal Ti-weighted SE 600/15 sequence
with two averages was performed in 18
patients, and a coronal bong-TR SE
2,200-2,500/22 and 90/2 sequence was pen-formed in six patients.
To compare the effect of gadolinium
in-jection in most patients, the
postgadolin-ium Ti-weighted sequences (coronal and
sagittal Ti-weighted SE and 3D FLASH)
Abbreviations: ACTH adrenocorticotropic hormone, PPV = positive predictive value, SE = spin echo, TE = echo time, 3D FLASH three-dimensional fast low-angle shot, TR = repetition time.
M A D A M E T E A 11 10 9 8. 7 6 5 4 3-1_ 0 A M 12 * , + A : I 10 I 8 D *, 6 4-2 * M 14 A 12 10 D 8 A 6 M E ‘ T 2 E R M 14 A 12 10 * * -* % 70
_
0 8 6 4 2 D A M E T E A * *-50 40 30 20 10 0 T P C a S e S % 70 % 70 060 I T4#{176} P30 C20 a S e ,, S 60 50 40 30 20 10 0 I T P C a S e S % 65 0 I 45 T P C a S e S 35-25 15 2EiD
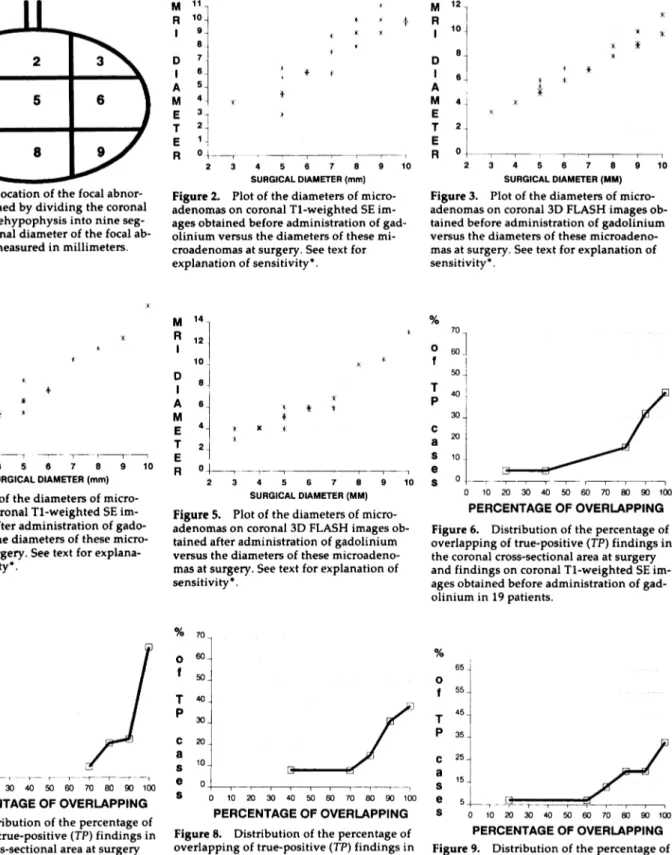
Figure 1. The location of the focal
abnon-mality was defined by dividing the coronal
plane of the antehypophysis into nine
seg-ments. The coronal diameter of the focal ab-normality was measured in millimeters.
: 3 4 5 6 7 8 9 10
SURGICAL DIAMETER (mm)
Figure 2. Plot of the diameters of
micro-adenomas on coronal Ti-weighted SE im-ages obtained before administration of gad-olinium versus the diameters of these mi-croadenomas at surgery. See text for explanation of sensitivity*. A M E T E A n 2 3 4 5 6 7 8 9 10 SURGICAL DIAMETER (MM)
Figure 3. Plot of the diameters of
micro-adenomas on coronal 3D FLASH images
ob-tamed before administration of gadolinium versus the diameters of these microadeno-mas at surgery. See text for explanation of
sensitivity*.
0 _
2 3 4 5 6 7 8 9 10
SURGICAL DIAMETER (mm)
Figure 4. Plot of the diameters of
micro-adenomas on coronal Ti-weighted SE
im-ages obtained after administration of
gado-linium versus the diameters of these
micro-adenomas at surgery. See text for
explana-tion of sensitivity*.
0_r_
2 3 4 5 6 7 8 9 10
SURGICAL DIAMETER (MM)
Figure 5. Plot of the diameters of
micro-adenomas on coronal 3D FLASH images ob-tamed after administration of gadolinium versus the diameters of these
microadeno-mas at surgery. See text for explanation of
sensitivity*.
0 10 20 30 40 50 60 70 80 90 100
PERCENTAGE OF OVERLAPPING
Figure 6. Distribution of the percentage of overlapping of true-positive (TP) findings in the coronal cross-sectional area at surgery
and findings on coronal Ti-weighted SE
im-ages obtained before administration of gad-olinium in 19 patients.
0 10 20 30 40 50 60 70 80 90 100
PERCENTAGE OF OVERLAPPING
Figure 7. Distribution of the percentage of
overlapping of true-positive (TP) findings in the coronal cross-sectional area at surgery and findings on coronal 3D FLASH images obtained before administration of gadolini-urn in 18 patients.
0 10 20 30 40 50 60 70 80 90 100
PERCENTAGE OF OVERLAPPING
Figure 8. Distribution of the percentage of
overlapping of true-positive (TP) findings in the coronal cross-sectional area at surgery and findings on coronal Ti-weighted SE im-ages obtained after administration of gado-linium in 13 patients.
0 10 20 30 40 50 60 70 80 90 100
PERCENTAGE OF OVERLAPPING
Figure 9. Distribution of the percentage of
overlapping of tme-positive (TP) findings in
the coronal cross-sectional area at surgery
and findings on coronal 3D FLASH images
obtained after administration of gadolinium in 15 patients.
were performed after a period not
exceed-ing 1 week. (In all patients an injection of 1 13.07 mg/kg
tetnaazacyclododecanete-tnaacetic acid [Guerbet, Paris] was
pen-formed in 30-60 seconds, and the first
se-quence [coronal Ti-weighted SE] was
started immediately after it.) The
postga-dolinium coronal Ti-weighted SE
se-quence was performed in 24 patients and
was followed by a sagittal Ti-weighted
SE sequence in 13 patients and/or by a 3D
FLASH sequence in 22 patients. The
post-gadolinium study was not performed in
patients whose clinical, CT, and/or MR precontrast imaging data sufficed to en-able confident diagnosis.
For all SE sequences the section
thick-ness was 3 mm; for 3D FLASH it was 1.5
mm. For SE sequences 13-15 sections
were used; for 3D FLASH, 64 sections
were used. All MR examinations were
performed with a i.5-T (Magnetom,
Sie-mens) system with a field of view of 22
Table 1
Results in 28 Patients Who Underwent Surgery
Sequence Coronal Group Coronal Ti-weighted SE - Gd Coronal Ti-weighted SE + Gd Coronal 3D FLASH -Gd Coronal 3D FLASH +Gd Sagittal Ti-weighted SE - Gd Sagittal Ti-weighted SE + Gd Proton Density SE Coronal T2-weighted SE
All 28 patients (27
micro-adenomas and one multinodular hyperplasia
Nex/Nmi 28/27 25/24 27/26 23/22 18/18 13/13 6/6 6/6
No. of true-positive imaging
examinations 19 13 18 15 ii 7 3 2
Sensitivity(%)
Positive predictive value (%) No. of false-positive imaging
examinations 70 90 2 54 87 2 69 78 5 68 83 3 61 73 4 54 64 4 50 100 0 33 100 0 Prolactinomas (20 patients, 20 microadenomas) Nex/Nmi
No. of true-positive imaging examinations 20/20 14 19/19 9 20/20 14 17/17 11 14/14 9 11/11 5 4/4 1 4/4 1 Sensitivity (%)
Positive predictive value (%) No. of false-positive imaging
examinations 70 88 2 47 82 2 70 82 3 64 92 1 64 90 1 45 63 3 ND ND 0 ND ND 0 Cushing disease (seven patients; six
microadenomas and one multi-nodular hypenplasia
Nex/Nmi 7/6 6/5 6/5 6/5 4/4 2/2 1/1 1/1
No. of true-positive imaging
examinations 4 4 4 4 3 2 0 1
Sensitivity (%)
Positive predictive value (%) No. of false-positive imaging
examinations 67 100 0 80 100 0 80 67 2 80 67 2 ND ND 1 ND ND 0 ND ND 0 ND ND 0 Growth hormone secretion (one patient,
one microadenoma)
Nex/Nmi 1/1 ND 1/1 ND ND ND 1/1 1/1
No. of true-positive imaging
examinations 1 ND 0 ND ND ND 1 1
No. of false-positive imaging
examinations 0 ND 0 ND ND ND 0 0
Note-The microadenoma was found in 27 patients. In one patient with Cushing disease, only multinodular hyperplasia was found. The sensitivity calculations apply only to a specific group of surgical patients with positive results of examination with CT and/or MR imaging. -Gd - before administration of gadolinium, +Gd = after administration of gadolinium, ND no data, Nex/Nmi = no. of patients examined with agiven sequence/no. of microadenomas found at surgery.
The 3D FLASH studies were performed
with a 40#{176}flip angle and a 96-mm-thick
three-dimensional volume.
The location and size of the focal
ab-normality were prospectively evaluated
by two neuroradiologists in agreement
about its presence (Fig 1). Secondary
signs of mass effect were not taken into
account for this evaluation. All transs-phenoidal explorations were performed by a single neurosurgeon, who evaluated
the location and size of microadenomas
by using the scheme in Figure 1. With these data, the capability of different se-quences to enable location and measure-ment of the diameter of microadenomas
was evaluated with three considerations
in mind:
1. Positive predictive value (PPV) (number of patients with an adenoma and positive test results)/(number of patients
with positive test results), and sensitivity
= (number of patients with an adenoma
and positive test results)/(numben of
pa-tients with adenoma). (Because the
find-ings at MR imaging influenced the
selec-tion of patients for surgery, the PPV was
calculated. The sensitivity calculations apply only for a specific group of
postsur-gical patients with positive CT and/on MR findings. In other words, patients
who had microadenomas without typical
hormonal secretion and without focal
be-sions on CT scans and/or MR images did
not undergo surgery, so that results for
the sensitivity* values were biased
[marked with * for these reasons]. If the
number of imaging examinations used to
calculate PPV and sensitivity* was equal
to on lower than four, only the number of
true-positive results and the number of
false-positive results were recorded. For
the same reasons, the negative predictive
value and the specificity* were not
calcu-bated either [only one patient had no
ade-noma at surgery]).
2. A scatter plot was made of the
diam-eters of microadenomas at surgery versus
the diameters of these microadenomas at
examination with coronal Ti-weighted
SE images obtained before the
adminis-tration of gadolinium (Fig 2), coronal 3D
FLASH images obtained before the
ad-ministration of gadolinium (Fig 3),
coro-nab Ti-weighted SE images obtained after
the administration of gadolinium (Fig 4), and coronal 3D FLASH images obtained after the administration of gadolinium
(Fig 5).
3. The distribution of the true-positive
MR imaging findings was determined on
the basis of the percentage of overlapping
between the surgical and MR imaging
findings (Figs 6-9).
The finding of a focal abnormality was
considered true positive only when at
least 20% of the lesion on the surgeon’s
anatomic grid overlapped the lesion on
the MR image and the side (left or right)
of the location was the same on both the
grid and the MR image. Otherwise, the
finding was considered false positive in conjunction with false negative. The
pres-ence of a second focal abnormality distant
from the true-positive one was
consid-ered false positive in conjunction with a
true-positive finding.
Furthermore, we investigated
combina-tions of sequences to find out which
pro-vided the highest nate of true-positive
findings and the lowest rate of false-posi-tive findings.
RESULTS
The results are summarized in
Combination of Coronal Sequences No. of True-Positive Findings No. of False-Positive Findings Ti SE - Gd 14 (66.6) 1 (4.7) T1SE+Gd 11(52.3) 2(9.5) 3D FLASH - Gd i5 (71.4) 3 (i4.3) 3D FLASH + Gd 15 (71.4) 2(9.5) Ti SE - Gd 3D FLASH - Gd 16 (76.2) 1 (4.7) T1SE-Gd Ti SE + Gd 17(81) 1(4.7) Ti SE - Gd 3D FLASH - Gd Ti SE + Gd 18 (85.7) 1 (4.7) Ti SE - Gd 3D FLASH - Gd Ti SE + Gd 3D FLASH + Gd 19 (90.4) i (4.7)
Note-The statistics were calculated in 21 patients for whom all four sequences were performed.
Numbers in parentheses are percentages. Ti SE - Gd coronal Ti-weighted SE sequence performed
before administration of gadolinium, Ti SE + Cd corona! Ti-weighted SE image obtained after
administration of gadolinium, 3D FLASH - Gd = coronal 3D FLASH image obtained before adininis-tration of gadolinium, 3D FLASH + Gd coronal 3D FLASH image obtained after administration of gadolinium. Positive predictive value for the combination of all four sequences was 95%.
Table 3
Positive and Negative Yield of Gadolinium Injection in Patients Coronal Ti-weighted SE and 3D FLASH Imaging Studies
Who Underwent
No. of
True-Positive Positive Negative
Findings in Yield in Yield in
Pregadolinium False-Negative True-Positive
Sequence Sequence Cases Cases
Corona! Ti-weighted 16 (67) 3 (38)
SE (24 patients)
Coronal 3D FLASH (21 patients) i5 (7i) 2 (33)
6(38) 5 (33)
Note-The statistics were calculated in the patients who underwent pre- and postgadolinium stud-ies. Numbers in parentheses are percentages.
Patients with Adenoma at Surgery
The best sensitivity* was achieved,
in decreasing order, with these
se-quences: pregadolinium coronal
Ti-weighted SE (70%), pregadolinium
coronal 3D FLASH (69%),
postgado-linium coronal 3D FLASH (68%),
pre-gadolinium sagittal Ti-weighted SE
(61%), postgadolinium coronal and
sagittal Ti-weighted SE (54%), coronal
bong-TR short-TE SE (50%), and
coro-nab long-TR bong-TE SE (33%). The
low signal intensity of the long-TR SE
sequence explains the absence of
false-positive examinations, low
sen-sitivity,* and high PPV. Furthermore,
this sequence was performed only in
six patients. For other sequences, the
highest PPV was achieved with
cono-nal pregadolinium Ti-weighted SE
(90%) and coronal postgadolinium
Ti-weighted SE (87%) images. The
capa-bility to evaluate the diameter of the
microadenoma with the most
effec-tive techniques (pre- or
postgadolin-ium coronal Ti-weighted SE and
con-onal 3D FLASH sequences) is
repre-sented on a scatter plot of diameters
measured at MR imaging versus
di-ameters measured at surgery (only
true-positive cases) (Figs 2-5). The
general accuracy of diameter
measure-ment for true-positive cases was very
good when pre- on postgadolinium
coronal Ti-weighted SE and 3D
FLASH images were used.
The maximum error never
exceed-ed 2 mm, except for a prolactinoma
with a diameter of 10 mm, recorded
as 14 mm when a coronal
postgado-linium Ti-weighted SE sequence was
used and as 13 mm when a coronal
postgadolinium 3D FLASH sequence
was used. The lowest dispersion of
MR imaging measurements was
ob-served with use of pregadolinium
coronal 3D FLASH images (Fig 3).
The capability to evaluate the
boca-tion of the microadenoma with the
most effective sequences (pre- or
postgadolinium coronal Ti-weighted
SE and 3D FLASH sequences) is
rep-resented on a plot of the distribution
of the percentage of patients with
true-positive findings versus the
per-centage of overlap between findings
at MR imaging and findings at
sum-gery (Figs 6-9). The best results are
achieved with coronal
pregadolin-ium 3D FLASH images (61% of
true-positive cases had 100% overlapping
between the findings at MR imaging
and the findings at surgery [Fig 7])
and coronal pregadolinium
Ti-weighted SE images (41% of
true-pos-itive cases had 100% overlapping
be-tween findings at MR imaging and
Table 2
Effect of Sequence Combination on Findings
the findings at surgery [Fig 6]). The
relationship between the surgical
di-ametem of the microadenoma and the
sensitivity* of the study was also
evaluated for the pregadolinium
cor-onal Ti-weighted SE images and 3D
FLASH images. The sensitivity *
im-proved with the increasing size of
the microadenoma (100% sensitivity
in microadenomas with diameters of
9 mm or greater imaged with both
se-quences), but the sensitivity* to small
adenomas (3 mm in diameter) was
higher in 3D FLASH images (50%)
than in Ti-weighted SE images
(30%). When we considered
combina-tions of different sequences
per-formed in 21 patients for whom all
four sequences were performed
(Ta-ble 2), the best results in the
detec-tion of microadenomas were
achieved with the combination of
pre- and postgadolinium coronal
Ti-weighted SE images with pre- and
postgadolinium coronal 3D FLASH
images (PPV = 95%, number of
true-positive findings = 19 [90%], number
of false-positive findings 1 [5%]).
The combination of pre- and
post-gadolinium coronal Ti-weighted SE
images with pregadolinium coronal
3D FLASH images produced
true-positive results in 85.7% of MR
imag-ing examinations; the combination of
pre- and postgadolinium coronal
Ti-weighted SE images produced
true-positive results in 81% of MR
imag-ing examinations (Table 2). Theme
was no improvement in the detection
of microadenomas by addition of
sag-ittal pre- and postgadolinium
Ti-weighted SE images and bong-TR SE
images to the most efficient
combina-tion of the sequences (pre- and
post-gadolinium coronal Ti-weighted SE
a. b. C.
f.
d. e.
Patient without Adenoma at
Surgery
In one patient with cyclic Cushing
disease, only nodular hypemplasia
without evidence of microadenomas
was found. The coronal pme- and
postgadolinium SE images as well as
CT scans were normal in this patient.
The pre- and postgadolinium 3D
FLASH images showed a focal
hy-pointensity but did not enable
confi-dent diagnosis. So, in this patient,
the SE images and CT scans resulted
in a true-negative evaluation and the
3D FLASH sequence in a
false-posi-tive one. Nevertheless, after a
subto-tal hypophysectomy, the patient’s
levels of ACTH have been normal for
longer than 1 year; whether this is of
hypothalamic or pituitary origin is
still dubious.
Effects of Gadolinium Injection
Statistical analysis of the effects of
contrast material injection was
per-formed in the patients who
under-went pre- and postgadolinium
stud-ies (SE images were obtained in 24
patients and 3D FLASH images were
obtained in 21 patients). After
injec-tion of gadolinium, the
microadeno-ma could be detected in three of
eight patients who had false-negative
Ti-weighted SE images (resulting in
a positive yield of 37.5%) (positive
yield of gadolinium in the
microade-nomas negative on the
pregadolin-ium images = [number of positive
cases on postgadolinium images but
negative on pregadolinium images] /
[
number of cases negative onpre-gadolinium images]) and in two of
six patients with false-negative 3D
FLASH images (positive yield of
33.3%) (Table 3). Of 16 true-positive
findings on pregadolinium coronal
Ti-weighted SE images, six became
false negative after injection of
gado-linium (negative yield of 37.5%)
(negative yield of gadolinium in the
microadenomas positive on the
pre-gadolinium scans [number of
neg-ative cases on postgadolinium scans
but positive on pregadolinium
scans] / [number of positive cases on
pregadolinium scans]), and of 15
true-positive findings on
pregado-linum coronal 3D FLASH images,
five became false negative after
injec-tion of gadolinium (Table 3).
DISCUSSION
Recent studies of MR imaging in
the diagnosis of pituitary
micmoade-nomas still vary in their evaluation
of diagnostic accuracy and the most
useful sequence parameters of this
modality. Our study, performed at
1 .5 T, demonstrates the utility of
three-dimensional acquisition (Figs
10-12) and coronal Ti-weighted SE
images without gadolinium in the
di-agnosis of microadenomas. The
high-est sensitivity was achieved with
con-onal pregadolinium Ti-weighted SE
images (70%) and coronal
pregado-linium 3D FLASH images (69%).
Re-cent studies done with a 1 .5-T
mag-net and 3-mm thick sections (Table 4)
also suggest a high accuracy of
Ti-weighted sequences. Kucharczyk et
al (3) imaged 10 of ii
ACTH-secret-ing microadenomas (91%), Kulkamni
et al (4) imaged eight of eight
micro-adenomas (100%), Peck et al (1)
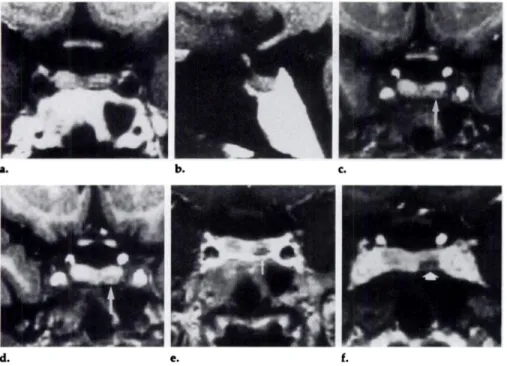
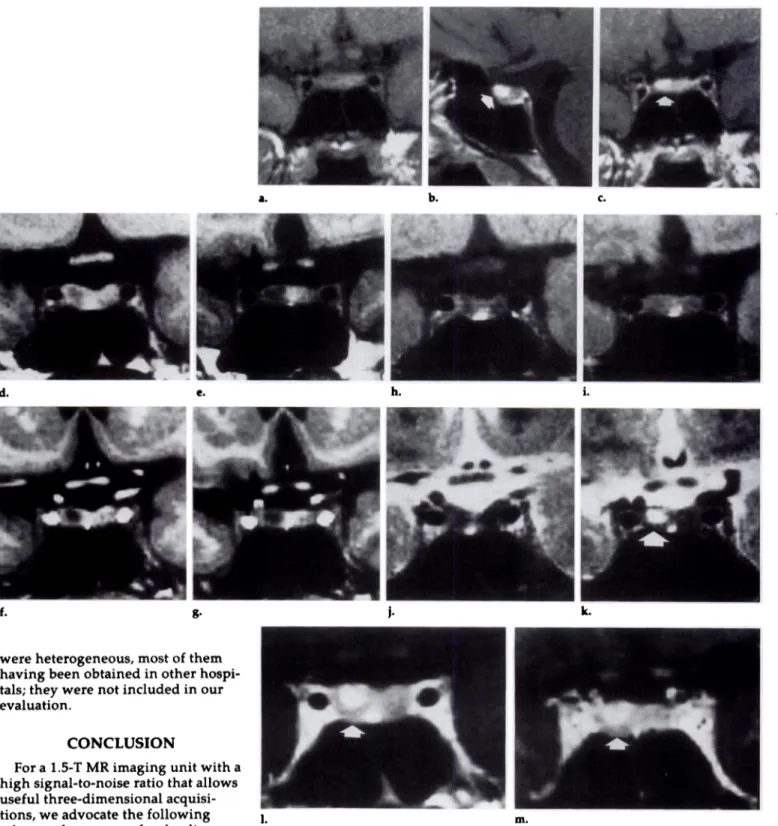
im-Figure 10. ACTH-secreting microadenoma
4 mm in diameter. (a) False-negative coronal Ti-weighted SE, (b) false-negative sagittal
Ti-weighted SE, and (c, d) coronal 3D
FLASH images without administration of
gadolinium. (e) Coronal Ti-weighted SE and
(0 coronal 3D FLASH images obtained after
administration of gadolinium. On pregado-binium studies (a-d), a low-contrast area of focal hypointensity (arrow, c and d) can
only be suspected, especially with a 3D FLASH sequence (c, d) (the pregadolinium studies were insufficient to enable a confi-dent diagnosis). After injection of
gadolini-um, the microadenoma (arrow, e and f) is as
cleanly visualized on the Ti-weighted SE
image (e) as on the 3D FLASH image (f).
Nevertheless, the contrast between the
hy-pophysis and microadenoma is greater on the 3D FLASH image (6.6 for the SE image
and 8.6 for the 3D FLASH image). (The
con-trast was calculated with the following equation: Contrast = [signal intensity of
hy-pophysis - signal intensity of
microadeno-ma] /noise.)
aged 17 of 21 ACTH-secreting
mi-croadenomas (81%), and Nichols et al
(2) imaged nine of 1 1 (six ACTH- and
five prolactin-secreting)
microadeno-mas (82%). Nevertheless, there are
also reports of a lower accuracy of
unenhanced i.5-T images. Pojunas et
al (9) failed to detect five of 1 1
pro-lactinomas (45%), and Doppman et al
(6) failed to detect five of eight
ACTH-secreting microadenomas
(62%). The poor results of some
stud-ies can, at least in pant, be explained by technical parameters (ie, an
insuf-ficient number of excitations [one on
two] and a small [128-pixel] matrix)
(Table 4).
The good results of 3D FLASH
im-ages can be explained by the use of
smaller sections in 3D FLASH images
and by good optimization of this
se-quence for pituitary examinations.
(After the influence of TR, flip angle,
and number of partitions versus total
acquisition volume and number of
excitations have been evaluated, the
best results in imaging the
hypophy-sis with 3D FLASH are achieved with
the following parameters: 70/6, one
excitation, 64 sections of 1 .5 mm
thickness, and zoom of 1.2. The
tech-nical factors of MR imaging
equip-ment are also important in achieving
a good contrast-to-noise ratio in
three-dimensional imaging of the
hypophysis (including a circularly
polarized head coil with a high
sig-nab-to-noise ratio, strong gradients
allowing the use of short TE, and
high homogeneity of the magnetic
field).
Nevertheless, in suboptimal
condi-tions (motion artifacts induced by
poor cooperation from the patient,
pneuma-C. d. h.
a. b. e. f.
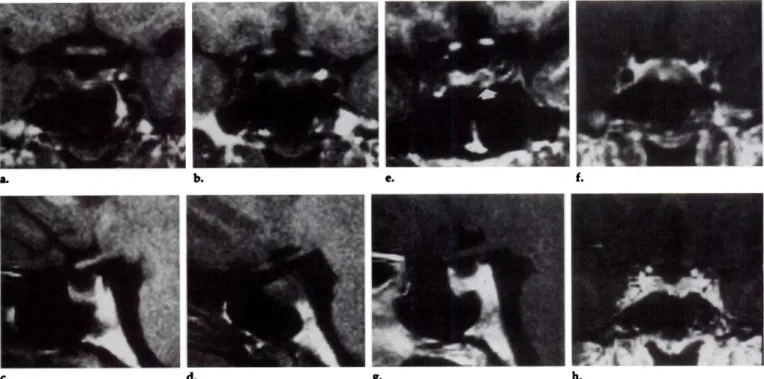
8-Figure ii. Prolactinoma 3-4 mm in diameter that was treated with bromocriptine. (a, b) Two contiguous sections of coronal Ti-weighted
SE sequence and (c, d) two contiguous sections of sagittal Ti-weighted SE sequence, at the level of the microadenoma. (e) Coronal 3D FLASH
image obtained without administration of gadolinium. (f) Coronal Ti-weighted SE, (g) sagittal Ti-weighted SE, and (h) coronal 3D FLASH
images obtained after administration of gadolinium (f-h were obtained at the level of the microadenoma). This small microadenoma (arrow,
e), treated with bromocriptine, could be visualized only with 3D FLASH without administration of gadolinium. All other pre- or postcon-trast sequences, as well as CT, were unable to demonstrate it.
Table 4
Parameters for Ti-weighted MR Imaging of Microadenomas at 1.5 T
True- No. of
No. of Section Positive Patients who
TR TE Signals Gap Thickness Rate Underwent
Study Sequence (msec) (msec) Averaged Matrix (mm) (mm) (%) Surgery
Kucharczyketal(3) Kuikarni et al(4) SE SE IRt 600 2000-3000 2500 25 20, 30-70, 80 20 6 2 2 256 i28 i28 0 0.6 0.6 3 3 3 91 100 11 8 Pecketal(1) SE 600 20 4 256 0.3 3 81 21 Pojunasetal(9) Doppntanetal(6) Nicholsetal(2) SE SE SE 300-800 600 500 i4-25 20 20 lor2 2 4 128or256 256 256 0 0 0.6 3 3 3 54 38 8i ii 8 ii
Note-ZR - inversion recovery.
*Performed with electrocardiographic gating.
tInversion time - 800 msec.
tized sphenoid sinus that induces
susceptibility artifacts), the
homoge-neity of the three-dimensional study
can be significantly lower than that
of a conventional SE study, hence the
higher number of false-positive
ex-aminations and the lower number of
confident diagnoses with respect to
conventional SE studies.
The few reports about the
diagnos-tic utility of gadolinium studies at 1.5
T suggest a higher accuracy of
post-contrast studies (5-8). In a series of
eight ACTH-secreting
microadeno-mas imaged at 1.5 T, Doppman et al
(6) achieved accuracy rates of 38% for
true-positive precontrast studies and
50% for true-positive postcontnast
studies. Nevertheless, only two
aver-ages and a rather long TE of 20 msec
were used in this study. Davis et al
(5) found postgadolinium studies
su-penior in two of three
microadeno-mas but used only a 0.5 T MR
imag-ing unit and a 5-mm section
thick-ness. The study of Dwyem et al (7) (in
which 13 ACTH-secreting
micro-adenomas were imaged) reported
that eight of 12 surgically confirmed
microadenomas were seen on
pmegad-olinium studies and none were seen
on postgadolinium studies. Dwyer et
al also used a 0.5-T MR imaging unit
and a 5-mm section thickness. In our
experience, when evaluated
separate-by, the pmegadolinium studies
en-abled greater diagnostic accuracy
than the postgadolinium studies.
This can be explained by technical
factors discussed in Patients and
Methods. These factors allow the
vi-sualization of micmoadenomas which,
when lower-resolution equipment is
used, can be visualized only after
ad-ministration of gadolinium (Fig 13).
Another factor can be a flip-flop from
dark to bright after injection of
gado-linium, with a frequent period of
isointensity between the hypophysis
and microadenoma during which the
presence of gadolinium may obscure
rather than help to visualize the
le-sion (7) (Figs 14, i5). In our
injec-C. d.
i.
j.
a. b. e. f.
g. h.
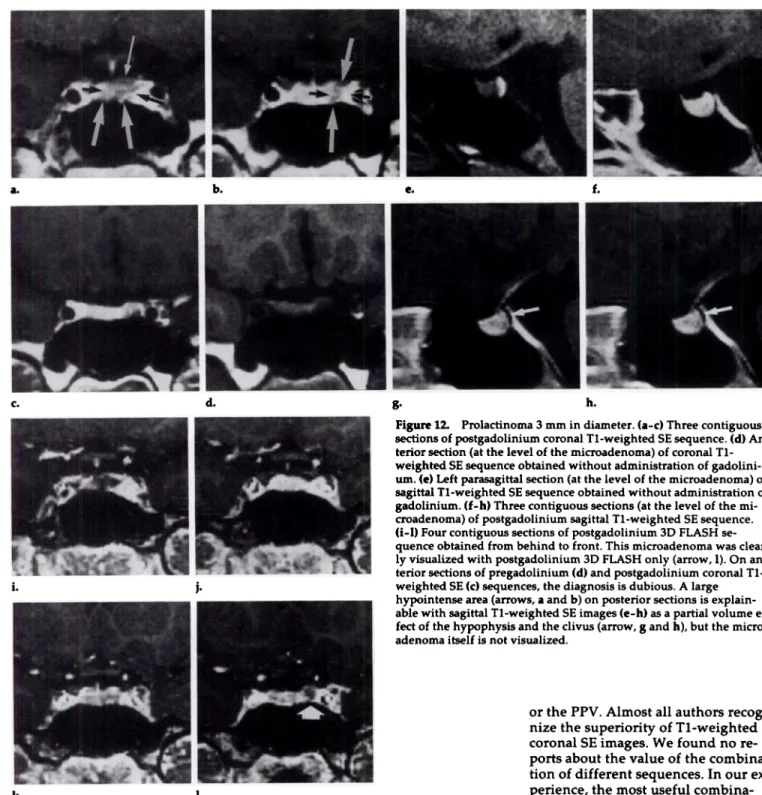
Figure 12. Probactinoma 3 mm in diameter. (a-c) Three contiguous
sections of postgadolinium coronal Ti-weighted SE sequence. (d)
An-tenor section (at the bevel of the microadenoma) of coronal
Ti-weighted SE sequence obtained without administration of
gadolini-urn. (e) Left parasagittai section (at the level of the microadenoma) of
sagittal Ti-weighted SE sequence obtained without administration of
gadolinium. (f-h) Three contiguous sections (at the level of the
mi-croadenoma) of postgadolinium sagittal Ti-weighted SE sequence.
(i-l) Four contiguous sections of postgadolmnium 3D FLASH
se-quence obtained from behind to front. This microadenoma was
clear-by visualized with postgadolmnium 3D FLASH only (arrow, 1). On
an-tenor sections of pregadolinium (d) and postgadolinium coronal
Ti-weighted SE (C) sequences, the diagnosis is dubious. A large hypointense area (arrows, aand b) on posterior sections is explain-abbe with sagittal Ti-weighted SE images (c-h) as a partial volume
ef-fed of the hypophysis and the clivus (arrow, gand h), but the
micro-adenoma itself is not visualized.
k. L
tion of gadolinium was 37.5% for
con-onal Ti-weighted SE images and
33.3% for coronal 3D FLASH images.
The positive yield after injection of
gadolinium was 37.5% for coronal
Ti-weighted SE images and 33.3% for
coronal 3D FLASH images.
Our results agree with the
pmevi-ously reported limited value of
sagit-tal Ti-weighted SE images (especially
because of the high rate of
false-posi-tive findings) and long-TR SE images
(1,4,6,9). In our study, the
sensitiv-ity* of long-TR SE images was low
(Fig 13), and the combination with
other sequences never improved the
total sensitivity. Nevertheless, these
sequences were performed only in
six patients who underwent surgery.
We agree with Peck et al (1) that
the sagittal Ti-weighted SE image is
also of limited value because of
par-tial volume artifacts caused by the
ca-motid artery and difficulties in
com-paring the left and right parts of the hypophysis.
The combination of sagittal
pre-and postgadolinium studies with
con-onal pre- and postgadolinium
Ti-weighted SE studies and coronal
pme-and postgadolinium 3D FLASH
stud-ies has not improved the sensitivity
or the PPV. Almost all authors
recog-nize the superiority of Ti-weighted
coronal SE images. We found no
re-ports about the value of the
combina-tion of different sequences. In our
ex-perience, the most useful
combina-tion of sequences is the pre- and
postgadolinium coronal Ti-weighted
SE image with the pre- and
postgado-linium 3D FLASH image. This
corn-bination produced the highest
nurn-ben of true-positive cases (90.4%) and
the lowest number of false-positive
cases (4.7%). The two false-negative
cases (incidentally also false negative
at CT) were the prolactinomas treated
with Parbodel (bmomocniptine mesy
late; Sandoz, Parsippany, NJ) (Fig 16).
Therefore, the pmecontrast
Se-quences that were evaluated
sepa-rately gave a higher accuracy than
the postcontrast ones, but the
cornbi-nation of both allows the highest
d. e. h. 1 1. k. a. b. C. f. g.
were heterogeneous, most of them
having been obtained in other
hospi-tals; they were not included in our
evaluation.
CONCLUSION
For a i.5-T MR imaging unit with a
high signal-to-noise ratio that allows
useful three-dimensional
acquisi-tions, we advocate the following
scheme of sequences for the
diagno-sis of pituitary microadenomas: a
con-onal Ti-weighted SE sequence
fob-lowed by a coronal 3D FLASH
se-quence (if the coronal Ti-weighted
SE sequence does not allow the
diag-nosis), both without injection of
gad-olinium. When confident diagnosis
still is not reached, the same
se-quences should be performed after
the injection of gadolinium. The
sag-ittal Ti-weighted SE sequence (with
or without injection of gadolinium)
and bong-TR SE sequence are useful
only in specific cases. The
high-field-strength MR imaging unit with a
1. m.
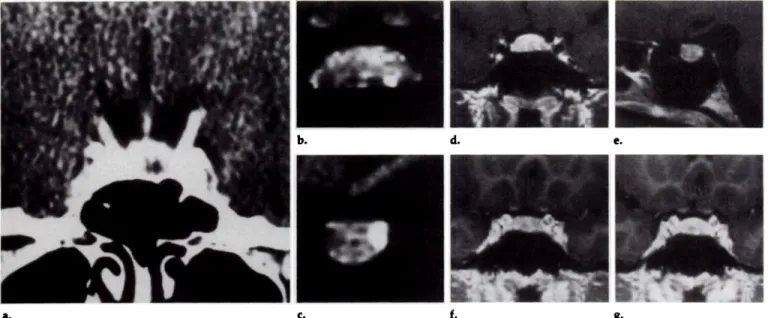
Figure 13 ACTH-secreting microadenoma 4 mm in diameter. (a) Coronal pnegadoliniuin
Ti-weighted SE image. (b) Sagittal postgadolinium Ti-weighted SE image. (c) Coronal post-gadolinium Ti-weighted SE image. These images (a-c) were obtained with a i.5-T magnet, a 3-mm section thickness, four averages, TR of 450 msec, and TE of 30 msec. The hyperintense
focal lesion (arrow, b and c) is poorly demonstrated on postgadolinium sequences only.
(d, e) Coronal pregadolinium Ti-weighted SE images obtained at levels 5.4 (d) and 8.4 (e).
(f, g) Coronal pregadolinium 3D FLASH images obtained at levels 6.9 (f) and 8.4 (g).
(h, i) Coronal proton-density SE images obtained by means of a 2.3/22 sequence with two
averages at levels 5.4 (h) and 8.4 (i). (j,k) Coronal T2-weighted SE images obtained by means of a 2,300/90 sequence with two averages at levels 5.4 (j)and 8.4 (k). (1) Coronal
postgadolin-ium Ti-weighted SE image. (m) Coronal postgadolmnium 3D FLASH image. These images
(d-m), obtained at our institution 2 months after a-c were obtained, clearly demonstrate a
microadenoma on pregadolmnium Ti-weighted SE images (d, e) and 3D FLASH images
(f, g) as an area of focal hypointensity. (Note higher contrast between hypophysis and
ade-noma on 3D FLASH images.) On the postgadolinium Ti-weighted SE image (1) and 3D
FLASH image (m) the microadenoma was hyperintense (arrow, 1 and m). The long-TR
se-quences (h-k) have a limited value. Indeed, only the anterior, probably more cystic, part of the microadenoma (arrow) can be visualized on the T2-weighted SE image (k).
high signal-to-noise ratio and
three-dimensional capabilities enables
sen-sitive imaging for pmesurgical
evalua-tion of pituitary microadenomas. U
Acknowledgment: We thank Wilfried
De-plecker for the excellent technical support.
References
1. Peck WW, Dillon WP, Norman D, Newton
TH, Wilson CB. High-resolution MR im-aging of pituitary microadenomas at l.5T:
experience with Cushing disease. AJR 1989;
i52:145-15i.
a. b.
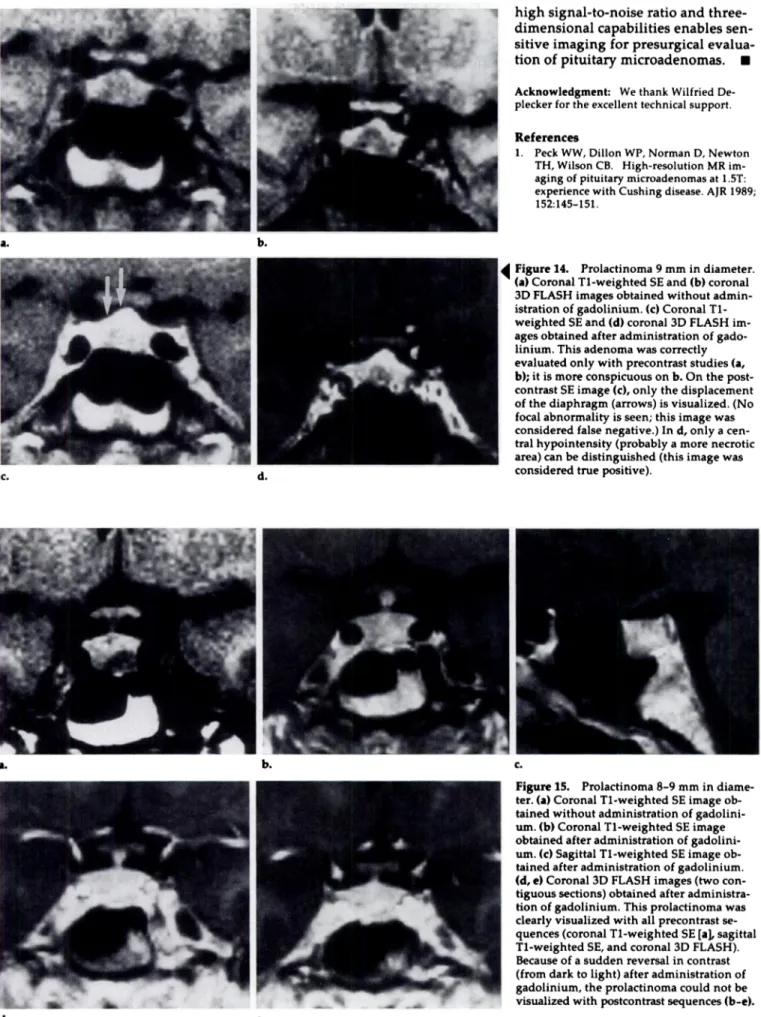
Figure 14. Prolactinoma 9 mm in diameter. (a) Coronal Ti-weighted SE and (b) coronal
3D FLASH images obtained without
admin-istration of gadolinium. (c) Coronal
Ti-weighted SE and (d) coronal 3D FLASH
im-ages obtained after administration of
gado-linium. This adenoma was correctly
evaluated only with precontrast studies (a, b); it is more conspicuous on b. On the post-contrast SE image (c), only the displacement of the diaphragm (arrows) is visualized. (No focal abnormality is seen; this image was considered false negative.) In d, only a cen-tral hypointensity (probably a more necrotic
area) can be distinguished (this image was
C. d. considered true positive).
a. b. c.
Figure i5. Prolactinoma 8-9 mm in
diame-ten. (a) Coronal Ti-weighted SE image
ob-tamed without administration of
gadolini-urn. (b) Coronal Ti-weighted SE image
obtained after administration of
gadolini-urn. (C) Sagittal Ti-weighted SE image
ob-tamed after administration of gadolinium. (d, e) Coronal 3D FLASH images (two
con-tiguous sections) obtained after
administra-lion of gadolinium. This prolactinoma was
clearly visualized with all precontrast
se-quences (coronal Ti-weighted SE [a], sagittal
Ti-weighted SE, and coronal 3D FLASH).
Because of a sudden reversal in contrast (from dank to light) after administration of
gadolinium, the prolactinoma could not be
visualized with postcontnast sequences (b-c).
a. g.
b. d. e.
C. f.
Figure 16. Fibrotic prolactinoma 6 mm in diameter in a patient who received bromocniptine treatment for 3 years. (a) CT scan obtained
be-fore treatment. (b) Coronal pregadolinium Ti-weighted SE image. (c) Sagittal pregadolinium Ti-weighted SE image. (d) Coronal
postgado-liniurn Ti-weighted SE image. (e) Sagittal postgadolinium Ti-weighted SE image. (f, g) Two contiguous sections of postgadolinium 3D
FLASH study. All these sections (b-g) were made at the level of the microadenoma, which was seen only on the first, pretreatment CT scan (a). The consecutive CT scans and MR images (b-g) were false negative.
2. Nichols DA, Laws ER, Houser OW, Abboud
CF. Comparison of magnetic resonance imaging and computed tomography in the preoperative evaluation of pituitary adeno-mas. Neurosurgery 1988; 22:380-385.
3. Kucharczyk W, Davis DO, Kelly WM, Sze
C, Norman D, Newton TH. Pituitary
ado-nomas: high-resolution MR imaging at 1.5 T. Radiology 1986; 161:761-765.
4. Kulkarni MV, Lee KF, McArd!e CB,
Yeak-ley JW, Haar FL. l.5-T imaging of pitu-itary microadenomas: technical
consider-ations and CT correlations. AJNR 1988; 9:5-ii.
5. Davis PC, Hoffman JC, Malko JA, et al.
Gadolinium-DTPA and MR imaging of
p1-tuitary adenoma: a preliminary report.
AJNR 1987; 8:817-823.
6. Doppman JL, Frank JA, Dwyer AJ, et al.
Gadolinium DTPA enhanced MR imaging
of ACTH-secreting microadenomas of the pituitary gland. J Comput Assist Tomogr 1988; 12:728-735.
7. Dwyer AJ, Frank JA, Doppman JL, et al. Pituitary adenomas in patients with
Cush-ing disease: initial experience with
Gd-DTPA-enhanced MR imaging. Radiology
1987; 163:421-426.
8. Steiner yE, Wimberger D, Imhof H, Knosp
E, Hajek P. Gd-DTPA in MR diagnosis of
pituitary adenomas. ROFO 1989; 150:323-327.
9. Pojunas KW, Daniels DL, Williams AL,
Haughton VM. MR imaging of
prolactin-secreting microadenomas. AJNR 1986;