Greenhouse gas emissions from
and storm impacts on wastewater treatment plants:
Process modelling and control
Thèse
Li Sha Guo
Doctorat en génie des eaux
Philosophiae doctor (Ph.D)
Québec, Canada
III
Résumé
Cette thèse étudie l'interaction entre les stations d’épuration (STEP) et le changement climatique: soit en premier lieu la production ainsi que les émissions de gaz à effet de serre (GES), en particulier le protoxyde d’azote (N2O), généré à la STEP et en second lieu l’effet des pluies plus intenses dues aux changements climatiques sur la STEP. Des campagnes de mesure sur le terrain et la modélisation à échelle réelle ont été utilisées conjointement dans cette recherche.
Une campagne de mesure d'une durée d’un mois a été réalisée dans une STEP traitant les eaux usées de 750,000 équivalents habitants, soit la STEP d’Eindhoven aux Pays-Bas. Des capteurs en ligne ont été installés dans la zone d'aération du bioréacteur.
Une usine virtuelle de grande échelle, soit la STEP décrit par le Benchmark Simulation Model No.2 (BSM2), ainsi qu’une usine réelle de grande échelle, soit la STEP d’Eindhoven aux Pays-Bas, étaient incluses dans cette étude. Dans les deux cas, les modèles ont été modifiés afin de prendre en compte les GES, en particulier la production de N2O. Deux modèles de boues activées (ASM) ont été développés, soit l’ASMG1 et l’ASMG2d. En plus de la conversion de N2O par les bactéries hétérotrophes, les deux modèles sont en mesure de simuler la production de N2O par la dénitrification catalysée par les bactéries oxydant l'ammoniac (AOB). Les modèles décrivent aussi l'effet de l’oxygène dissous (OD) sur la cinétique de production de N2O par les AOB grâce à une modification de la cinétique d’Haldane.
Les résultats montrent que les AOB produisent beaucoup de N2O tandis que les hétérotrophes en consomment considérablement. Les émissions de N2O augmentent lorsque les concentrations de NH4+ sont élevées et que les concentrations d’OD sont modérées (jusqu’à 2.5 mg O2/l dans cette étude). Ces conditions peuvent avoir été créées
IV
par le contrôle en cascade de NH4+-OD qui vise à réduire la consommation d'énergie en diminuant les concentrations d'OD lorsque la concentration de NH4+ est suffisamment faible. En outre, ce contrôleur en cascade est une stratégie de rétroaction à gain faible. C'est-à-dire, un retard significatif se produit entre la détection d'une augmentation de NH4+ et l'accroissement de l'aération. Toutes ces propriétés produisent des conditions favorables à la production de N2O par les bactéries AOB.
Différents scénarios alternatifs ainsi que des stratégies de contrôle ont été comparés selon la qualité de l'effluent, le coût d’opération et les émissions de GES. Dans le cadre de BSM2, un bon équilibre entre la qualité de l'effluent, le coût d’opération et les émissions de GES a été obtenu avec à la mise en œuvre d'un contrôleur rétroactif pur de l’OD sur la première zone d'aération et d’un contrôleur en cascade de NH4+-DO sur les deux zones d'aération suivantes et en utilisant soit une stratégie d'alimentation étagée ou le contrôle du recyclage des boues afin de gérer les pics de débits.
Mots-clés:
Traitement des eaux usées par boues activées, contrôle de procédé, campagne de mesures en terrain, modélisation mathématique à échelle grandeur réelle, gaz à effet de serre, protoxyde d’azote, temps de pluie
V
Abstract
This PhD thesis studied the interaction between wastewater treatment plants (WWTPs) and climate change, i.e. the production and emission of greenhouse gases (GHGs), especially nitrous oxide (N2O), from WWTPs and the effect of the climate change induced more intense rain events on WWTPs. Both field measurements and full-scale modelling were pursued in this research.
A one-month measurement campaign was performed by installing on-line sensors at the aeration zone of the bioreactor of a 750,000 person equivalents WWTP, i.e. the Eindhoven WWTP in the Netherlands. The models of a full-scale virtual plant, i.e. the Benchmark Simulation Model No.2 (BSM2), and a full-scale real plant, i.e. the Eindhoven WWTP in the Netherlands, were extended with respect to GHG emissions, especially the pathways involving N2O. Two types of extended Activated Sludge Models (ASM) were developed, i.e. ASMG1 for COD/N removal and ASMG2d for COD/N/P removal. Besides heterotrophic N2O production, both proposed models include N2O production by nitrite denitrification by ammonia-oxidizing bacteria (AOB) and describe the DO effect on AOB N2O production by a modified Haldane kinetics term.
Results showed that AOB are the major producer of N2O while the heterotrophs consume N2O considerably. The high N2O emissions occurred under high NH4+ and intermediate DO concentrations (up to 2.5 mg O2/l in this work). Such conditions can be created by NH4+-DO cascade control which aims at reducing energy consumption by lowering the DO concentrations when the NH4+ concentration is sufficiently low. Moreover, this cascade controller is a low-gain feedback control strategy, i.e. a significant delay will occur between the detection of a NH4+ increase and the increase in aeration. All these properties lead to conditions favourable to N2O production by AOB.
VI
Different alternative scenarios and control strategies were compared in terms of effluent quality, operational cost and GHG emissions. In the framework of BSM2, a good balance among effluent quality, operational cost and GHG emissions was realized by implementing a pure DO feedback controller in the first aeration zone and a NH4+-DO cascade controller in the following two aeration zones and using either step feed or sludge recycling control to deal with hydraulic shocks.
Keywords:
Activated sludge, wastewater treatment, process control, field measurements, full-scale mathematical modelling, greenhouse gases, nitrous oxide, wet weather conditions
VII
Table of Contents
Résumé ... III Abstract ... V Table of Contents ... VII List of Tables ... XI List of Figures ... XIII Nomenclature ... XV Foreword ... XXV
1 Introduction ... 1
2 Literature review ... 3
2.1 GHGs emissions from WWTPs ... 3
2.1.1 WWTPs borne GHGs: classification and evaluation framework ... 3
2.1.2 Full-scale N2O emissions ... 6 2.2 N2O production pathways ... 7 2.2.1 Biochemical pathways ... 7 2.2.2 Chemical pathway ... 14 2.3 Modelling of N2O emissions ... 15 2.3.1 Model structures ... 18
2.3.2 Model applications in full-scale plants ... 31
2.4 Control of N2O emissions ... 38
2.4.1 Control in BSM2 ... 38
2.4.1 Alternative N2O mitigation strategies ... 39
2.5 Controlling under rain events ... 40
2.6 Problem statement ... 41
2.6.1 Insufficient full-scale measurement data ... 41
2.6.2 Insufficient model development ... 42
2.6.3 Lack of control strategy studies including GHGs models ... 42
2.7 Objectives ... 43
3 Benchmark GHG modelling and controlling ... 45
3.1 Introduction ... 45
VIII
3.2.1 Implementation and calibration/validation approaches ... 46
3.2.2 Results ... 54
3.2.3 Discussion ... 63
3.3 Control of GHG emissions in BSM2 ... 69
3.3.1 Methods ... 69
3.3.2 Results and discussion ... 75
3.4 Conclusion ... 79
4 Measuring and modelling N2O emissions from a real WWTP ... 81
4.1 Introduction ... 81
4.2 Measuring N2O emissions from a real WWTP ... 82
4.2.1 Materials and methods ... 82
4.2.2 N2O emissions under dry weather conditions ... 91
4.2.3 N2O emissions under wet weather conditions ... 95
4.2.4 Relationship between N2O emissions and control strategies ... 98
4.2.5 Control improvement ... 105
4.3 Modelling N2O emissions from a real WWTP ... 109
4.3.1 ASMG2d model and implementation of a real WWTP ... 109
4.3.2 Simulation results of a real WWTP ... 125
4.3.3 Discussion ... 133
4.4 Conclusion ... 140
5 Conclusions and perspectives ... 143
5.1 Conclusions ... 143
5.1.1 Full-scale measurement experience ... 143
5.1.2 DO effect on AOB denitrification ... 144
5.1.3 Model calibration and validation... 145
5.1.4 Model discrimination ... 147
5.1.5 Contribution from AOB denitrification ... 147
5.1.6 N2O emissions under wet-weather conditions ... 149
5.1.7 Control strategies ... 150
5.2 Perspectives ... 152
5.2.1 A unified model of AOB N2O production ... 152
5.2.2 Wet-weather studies ... 153
IX
5.2.4 Other GHGs besides N2O ... 155
5.2.5 Integrated models ... 156
References ... 157
Appendix A Calculation of N2O emissions ... 175
Appendix B Contribution of AOB pathway to N2O emissions ... 179
Appendix C Liquid-gas equilibrium of N2O ... 183
Appendix D Stoichiometric matrix of ASMG1 ... 185
Appendix E Kinetic equations of ASMG1 ... 189
Appendix F Component matrix of ASMG1 ... 191
Appendix G Stoichiometric matrix of ASMG2d ... 193
Appendix H Kinetic equations of ASMG2d ... 203
Appendix I Component matrix of ASMG2d ... 209
XI
List of Tables
Table 2.1 Structures of models ... 16
Table 2.2 Stoichiometric matrices of the different AOB N2O production models... 27
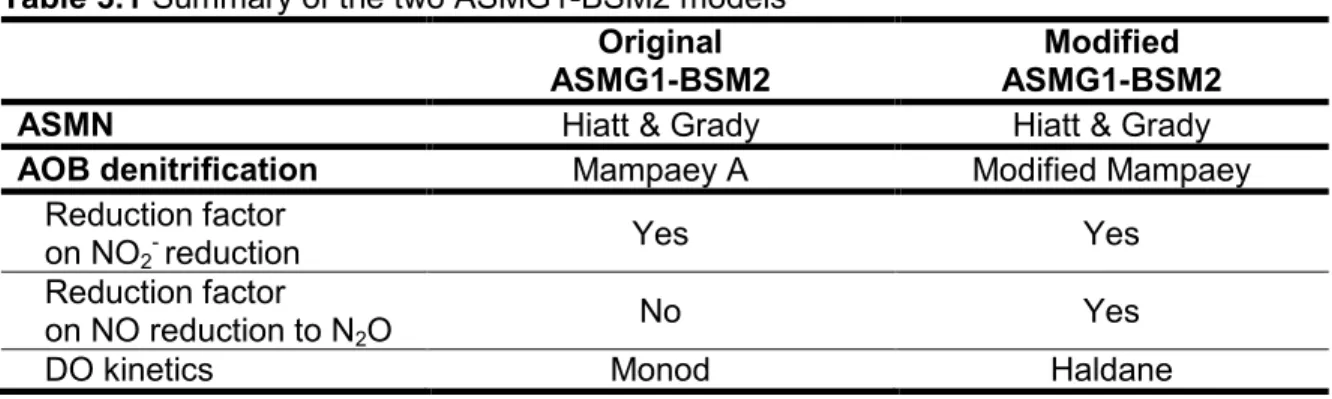
Table 3.1 Summary of the two ASMG1-BSM2 models ... 46
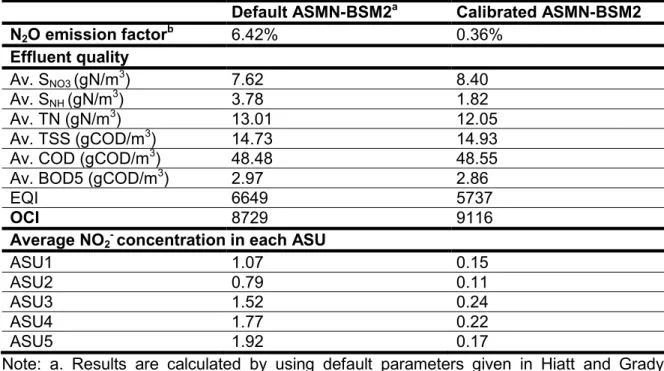
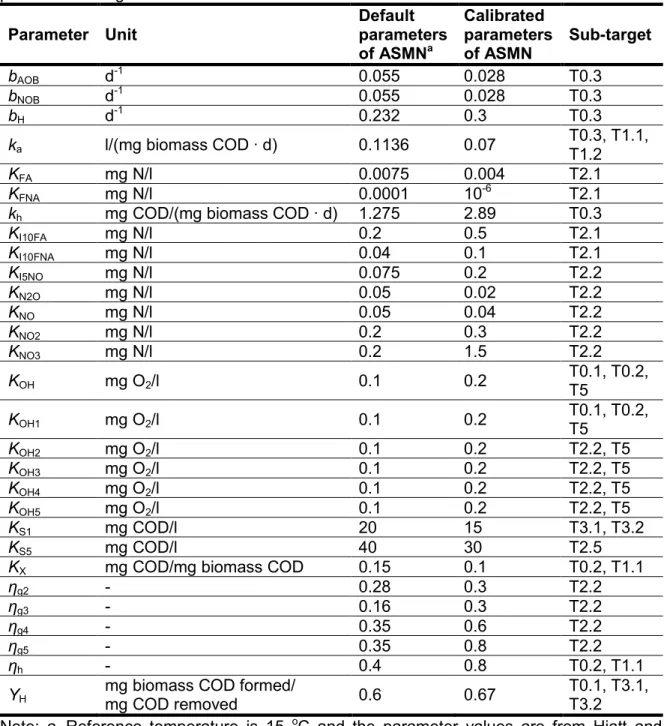
Table 3.2 Open loop BSM2 results obtained with ASMN with default and calibrated parameters ... 55
Table 3.3 Tuned parameters of the ASMN submodel and corresponding target of each parameter tuning ... 56
Table 3.4 Tuned parameters of the two AOB denitrification submodels and corresponding target of each parameter tuning ... 57
Table 3.5 Calibration results of ASMG1 BSM2 in open loop ... 57
Table 3.6 Validation of calibrated ASMG1 in BSM2 control strategies ... 61
Table 3.7 Comparison of average heterotrophic and autotrophic N2O production rates and the emission rate for the two AOB models ... 61
Table 3.8 Control strategies tested in the thesis ... 71
Table 3.9 Parameters of the PI controllers ... 71
Table 4.1 Average N2O emission rates and emission factors ... 91
Table 4.2 Parameters of ASMG2da ... 118
XIII
List of Figures
Figure 2.1 GHG emission sources from a WWTP. The GWP values are from the IPCC
report (2013) ... 5
Figure 2.2 Scheme of biochemical N removal and N2O productions ... 8
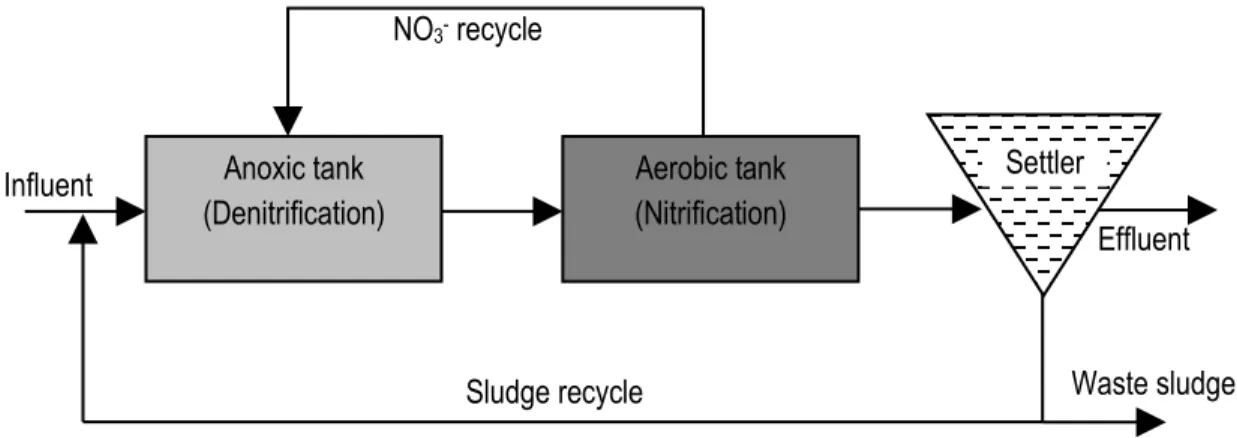
Figure 2.3 Illustration of the MLE process configuration for nitrogen removal ... 9
Figure 2.4 Scheme of the chemical NO2- reduction ... 14
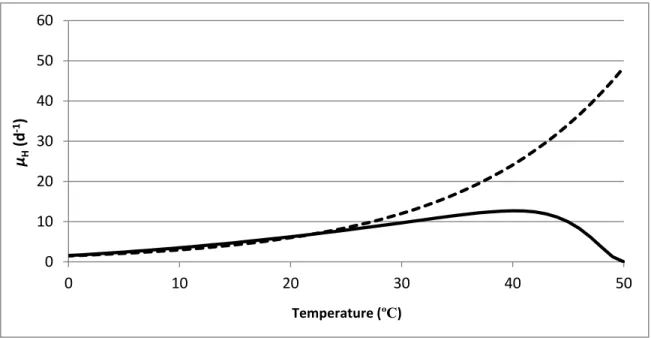
Figure 2.5 Maximum specific growth rate of heterotrophs expressed by the Arrhenius equation (dashed) and the Ratkowsky equation (solid). ... 20
Figure 2.6 Scheme of the model proposed by Pan et al. (2013)... 22
Figure 2.7 Scheme of the model proposed by Ni et al. (2011) (a) and the model proposed by Ni et al. (2013a) (b) ... 24
Figure 2.8 Scheme of the model proposed by Law et al. (2012) ... 24
Figure 2.9 Scheme of the models proposed by Mampaey et al. (2013) ... 25
Figure 2.10 BSM2 plant layout. ... 34
Figure 2.11 BSM2 default control strategies ... 35
Figure 3.1 Illustration of kinetic relationship between SO and DOHaldane in the modified Haldane term. ... 48
Figure 3.2 The calibration procedure and the sub-targets of each step ... 53
Figure 3.3 Comparison of daily averaged dynamic results of ASU4 obtained with the original, the modified ASMG1-BSM2 and the finalized ASM1-BSM2 in open loop (a) and with 1-DO strategy (b). ... 58
Figure 3.4 Comparison of total dynamic N2O emissions in the two warmest (a) and the two coldest weeks (b) in open loop and under the three tested control strategies. ... 62
Figure 3.5 Comparison of daily averaged N2O emissions in open loop under steady-state simulation and dynamic simulation with the modified ASMG1-BSM2. . 64
Figure 3.6 Comparison of daily averaged dynamic N2O production rates by different bacteria groups simulated with the modified ASMG1-BSM2 in open loop. ... 67
Figure 3.7 NH4+-DO cascade with minimal DO requirement strategy ... 72
Figure 3.8 NH4+-DO cascade plus 1 DO controller strategy ... 72
Figure 3.9 Comparison of different control strategies using the current influent file ... 75
Figure 3.10 Comparison of different control strategies using the future influent file ... 75
XIV
Figure 4.2 Temporal variation of N2O emission rate at the beginning (a), the middle (b) and the end section (c) of the summer package. ... 87 Figure 4.3 Comparison of N2O emission rates at the end section of the summer package
with influent flow rate and influent NH4+ concentrations and loads (a), local aeration flow rate and DO concentration (b), and N component concentrations at the end of the summer package (c). ... 88 Figure 4.4 Comparison of N2O emission rates at the end section of the summer package
with the local aeration flow rate and the DO concentration (a), and with N components concentrations at the end of the summer package and influent NH4+ concentrations and loads (b) for one typical dry day ... 89 Figure 4.5 Off-line measurement of NO2- concentration under three dry-weather days (a-c) and two wet-weather days (d-e). ... 90 Figure 4.6 Comparison of aeration flow rate, NH4+ concentration and influent flow rate
for the wet weather day August 25th (a) and comparison of N
2O emission rate, NH4+ concentration, DO concentration and NO3- concentration for the same wet weather day (b). ... 100 Figure 4.7 Comparison of aeration flow rate, NH4+ concentration and influent flow rate
for the wet weather day August 26th (a) and comparison of N
2O emission rate, NH4+ concentration, DO concentration and NO3- concentration for the same wet weather day (b). ... 104 Figure 4.8 Scheme of control strategies. ... 107 Figure 4.9 Comparison of different μPAO values in ASM2d based on the Arrhenius
temperature dependency (μA,T,PAO) and in ASMG2d based on the Ratkowsky temperature dependency (μR,PAO). ... 112 Figure 4.10 ASMG2d influent fractionation model. ... 114 Figure 4.11 Comparison of kLa calculated by original aeration model and the modified
model at 20.26 ºC with sludge age of 5.74 d. ... 116 Figure 4.12 Comparison in terms of DO and N2O simulation results between using
original aeration model (a and c) and modified aeration model (b and d) ... 124 Figure 4.13 Comparison of the measured DO concentrations near the outlet of the
bioreactor with the simulation results. ... 125 Figure 4.14 Comparison of the measurement results with the simulation results of NH4+ (a), NO3- (b) and NO2- (c). ... 126 Figure 4.15 Comparison of simulated and measured N2O emissions at the beginning (BM)
(a), the middle (MM) (b) and the end section (EM) (c) of the summer aeration package. ... 128 Figure 4.16 Comparison of the internal recycle flow rate from the middle ring to the inner
ring (QA) and the internal recycling flow rate from the outer ring to the middle ring (QB) on August 16th-17th (b) with the values under two normal dry days (a). ... 132
XV
Nomenclature
ANRA Assimilative NO3- reduction to ammonia
AMO Ammonia monooxygenase
AOB Ammonia-oxidizing bacteria
ASM1, ASM2d, ASM3 Activated sludge model No. 1, No. 2d No. 3 ASMN Activated sludge model for Nitrogen
ASMG1 Activated sludge model for GHG No. 1
ASMG2d Activated sludge model for GHG No. 2d
ASMN-BSM2 BSM2 implemented with ASMN
ASMG1-BSM2 BSM2 implemented with ASMG1
ASM1-BSM2 BSM2 implemented with ASM1
ASU1-5 Activated sludge unit 1-5
BSM1 Benchmark simulation model No. 1
BSM2 Benchmark simulation model No. 2
C/N Ratio between organic carbon and nitrogen
CODs Soluble chemical oxygen demand
CODt Total chemical oxygen demand
CSTR Completely stirred tank reactors DN-N Denitrification-nitrification
DO Dissolved oxygen
EPRI Electric Power Research Institute
EQI Effluent quality index
GAOs (DGAOs) Glycogen accumulating organisms (Denitrifying GAOs)
GHG Greenhouse gas
GWP Global warming potential
HAO Hydroxylamine oxidoreductase
HRT Hydraulic retention time
IPCC Intergovernmental Panel on Climate Change MLE process Modified Ludzack-Ettinger process
NAR Nitrate reductase
NGGI National Greenhouse Gas Inventory
XVI
NiRK Nitrite reductase used by AOB
NOR Nitric-oxide reductase
NOB Nitrite-oxidizing bacteria
NOS Nitrous oxide reductase
NXR Nitrite oxidoreductase
OCI Operational cost index
PAOs (DPAOs) Phosphorous accumulating organisms (Denitrifying PAOs)
PHA Polyhydroxyalkanoates
SBR Sequencing batch reactor
SHARON Single reactor system for High activity Ammonia Removal Over Nitrite
SP Setpoint
UCT process University Cape Town process
WWTP Wastewater treatment plant
kLa Oxygen transfer coefficient
BOD5 Five-day biochemical oxygen demand
CH4 Methane
CO2 Carbon dioxide
Fe2+ Ferrous iron
Fe3+ Ferric iron
FNA Free nitrous acid
FA Free ammonia N Nitrogen NH2OH Hydroxylamine NH4+ Ammonia NO3- Nitrate NO2- Nitrite NO Nitric oxide
NOH Hyponitrous acid
N2O Nitrous oxide
N2 Dinitrogen
XVII
PO4- Phosphate
TKN Total Kjeldahl nitrogen
TN Total nitrogen
TSS Total suspended solids
VFA Volatile fatty acids
S‖soluble_component‖ Concentration of ―soluble components‖ X‖partical_component‖ Concentration of ―particle components‖
I dedicate this thesis to my parents
XXI
Acknowledgement
First of all, I would like to express my gratitude to my supervisor Prof. Peter A. Vanrolleghem who taught me a lot in the past four years. With his creative mind and broad knowledge, Peter has achieved high reputation in the field of wastewater treatment. From him I have learnt not only the expertise, but also the way of thinking and the attitude to have in work and life. There are many things for which I would like to thank him. He is a patient advisor who spent great efforts on correcting my papers and thesis. He is a funny person who often came up with jokes and shared them with us. He has a kind heart. I will never forget that during my difficult time, he always encouraged and trusted me. People are often impressed by his enormous energy during work. His enthusiasm also inspired me to be more positive and happier in my studies and life. All these stories, either small or big, were weaved into a warm memory.
I also want to thank Prof. Ingmar Nopens who is my co-supervisor from the Ghent University in Belgium. His knowledge and experience on hydraulic modelling elevated my understanding of wastewater treatment. His comments on my papers and thesis expanded my mind with new ideas. Ingmar is a young and amicable professor, who feels like a friend. During my visiting studies at the Ghent University, I got a lot of help from him and his BIOMATH team. Through discussions with them, I learnt how to design and carry out the field measurements and gathered working experience in the lab.
At the same time, I want to give a special thanks to my committee members, Prof. Ulf Jeppsson, Prof. Paul Lessard and Dr. Stefan Weijers. Thanks for your brilliant comments which profoundly improved my thesis and thanks for joining my defense which gave my PhD study a beautiful ending. I also thank Prof. Kartik Chandran, Prof. Mark C. M. van Loosdrecht, Dr. Sudhir Murthy, Dr. Andrew R. Shaw, Prof. Eveline I.P. Volcke and Prof. Zhiguo Yuan. Conferences and cooperation provided me great opportunities to learn from
XXII
those preeminent and reputable scholars, especially in terms of mechanisms and modelling of N2O production.
modelEAU team is the research group where I did my PhD study with Prof. Peter A. Vanrolleghem. Team members are from different places around the world. They are all helpful and kind persons. This created an enjoyable working environment during my whole PhD period. I want to thank especially Coralie Lamaire-Chad. She worked at the Eindhoven plant with me for a one-month measurement campaign in the summer of 2012. I also want to thank Giulia Bachis, Ji Fan, Sovanna Tik, Cristina Martin, Thibaud Maruejouls, Janelcy Alferes, Frédéric Cloutier, Mansour Talebizadeh, Ruyi Wang, Queralt Plana and all the other members at modelEAU team who offered their generous help to my studies and life.
Unforgettably, I also had a joyful time with the members of the BIOMATH team at the Ghent University in Belgium. Giacomo Barni fully participated in the two measurement campaigns carried out at the Eindhoven WWTP in the Netherlands. Thanks to his expertise and experience of field measurements we could solve all difficulties occurring during the experiments. He is such a kind man and did most of the strenuous work at the plant. Besides, Tinne De Boeck helped analyze the component concentrations. Youri Amerlinck shared with me his modelling experience of the Eindhoven WWTP. He and Thomas Maere organized the BIOMATH days, during which some members from the BIOMATH team came to the Eindhoven plant to help in sampling and lab experiments. Other persons from the BIOMATH team who were involved in the BIOMATH days include Katrijn Cierkens, Wouter Naessens, Usman Ur Rehman and Hannu Poutiainen. Without them, the measurement campaigns would not have been so successful, especially for the sampling task on August 26th 2012, which was a day of heavy rain.
XXIII Moreover, I also appreciate the staff at Waterschap De Dommel (the Eindhoven WWTP). During the measurement campaigns at the plant, they gave me so much help, e.g. transporting and moving the big hood. Also, from them, especially from Mr. Peter van Dijk, I learnt how the plant is operated and how the control strategies are adjusted.
Furthermore, Jose Porro is the Chair of the IWA Task Group on Greenhouse Gases. We had a good cooperation in terms of measurement and modelling of GHGs. His research on the integrated modelling of GHGs improved my understanding of GHG emissions from an overall perspective. I also want to thank Matthijs Daelman who has good knowledge about the N2O measurement equipment (Emerson). I’m also thankful to the staff from DHI, i.e. Enrico Ulisse Remigi and Filip Hector André Claeys, who answered my questions on the WEST software. Dr. Xavier Flores-Alsina and Dr. Lluis Corominas work on the benchmark simulation models. Their previous work provided me with a good basis.
In addition, I acknowledge the financial support obtained through the TECC project funded jointly by the Québec Ministry of Economic Development, Innovation and Exports (MDEIE), the Flemish Fund for Scientific Research (FWO - G.A051.10) and the Canada Research Chair on Water Quality Modelling.
Finally, I would like to express the greatest thanks to my parents. They gave me birth, raised me in a home which is not rich but full of happiness, and stayed with me in any situations. Without them I could not have made such achievements. Their love is the footstone for me to stand up and the motive for me to go further. Thank you.
XXV
Foreword
This PhD thesis was composed based on 6 papers as follows:
1. Guo L.a and Vanrolleghem P.A.a (2014) Calibration and validation of an Activated Sludge Model for Greenhouse gases No. 1 (ASMG1) - Prediction of temperature dependent N2O emission dynamics. Bioprocess and Biosystems Engineering, 37, 151-163.
2. Guo L.a, Porro J.b,c, Sharma K.d, Amerlinck Y.c, Benedetti L.e, Nopens I.c, Shaw A.f,g, Van Hulle S.W.H.c,h, Yuan Z.d and Vanrolleghem P.A.a (2012) Towards a benchmarking tool for minimizing wastewater utility greenhouse gas footprints. Water Science and Technology, 66, 2483-2495.
3. Guo L.a, Martin C.a,i, Nopens I.c and Vanrolleghem P.A.a (2012) Climate change and WWTPs: Controlling greenhouse gas (GHG) emissions and impacts of increased wet weather disturbances. In proceedings of IWA Nutrient Removal and Recovery 2012: Trends in NRR, Harbin, China, September 23-25 2012.
4. Guo L.a, Lamaire-Chad C.a, Bellandi G.c, Daelman M.j,k, Amerlinck Y.c, Maere T.c, Nous J.l, Flameling T.l, Weijers S.l, van Loosdrecht M.C.M.k, Volcke E.I.P.j, Nopens I.c and Vanrolleghem P.A.a (2014) Full-scale field measurement of nitrous oxide (N
2O) gas emissions and its relationship with other nitrogen species under dry and wet weather conditions. Submitted.
5. Guo L.a and Vanrolleghem P.A.a (2014) Interaction of weather conditions and ammonia-based feedforward and feedback control strategies on N2O emissions at full-scale wastewater treatment plants. In preparation.
6. Guo L.a and Vanrolleghem P.A.a (2013) Full-scale simulation of N
2O emissions with ASMG2d and elucidation of its different production and emission sources in nitrogen (N) and phosphorus (P) removal systems. Submitted.
XXVI
The institutions of the co-authors are given below:
a modelEAU, Département de génie civil et de génie des eaux, Université Laval, 1065 av. de la Médecine, Québec, QC, Canada G1V 0A6.
b Malcolm Pirnie, TheWater Division of ARCADIS, 27-01 Queens Plaza North, Ste. 800, Long Island City, NY 11101, USA.
c BIOMATH, Department of Mathematical Modelling, Statistics and Bioinformatics, Ghent University, Coupure Links 653, 9000 Gent, Belgium.
d Advanced Water Management Center (AWMC), The University of Queensland, Brisbane QLD 4072, Australia.
e WATERWAYS srl, Via del Ferrone 88, 50023 Impruneta (FI), Italy
f Black & Veatch, 8400 Ward Parkway, Kansas City, MO 64114, USA.
g Department of Civil, Architectural, and Environmental Engineering, Illinois Institute of Technology, Chicago, IL 60616, USA.
h EnBiChem, University College West Flanders, Graaf Karel de Goedelaan 5, 8500 Kortrijk, Belgium.
i Deustotech, avenida de las Universidades, 24, 48007 Bilbao, Spain
j Department of Biosystems Engineering, Ghent University, Coupure links 653, 9000 Ghent, Belgium.
k Department of Biotechnology, Delft University of Technology, Julianalaan 67, 2628 BC Delft,The Netherlands.
XXVII The author of this PhD thesis (Lisha Guo) is the first author and corresponding author of all these papers. For paper 1, 5 and 6, the author of this thesis did most of the research and writing work under the supervision of PhD supervisor Prof. Peter A. Vanrolleghem, modelEAU, Unversité Laval. Paper 2, 3 and 4 involved a lot of cooperation with other persons and groups. In paper 2, the author of this PhD thesis did all simulation work related to BSM2, which is the major part of this paper, and compiled the manuscript by integrating the work from other groups. In paper 3, the author of this PhD thesis did most of the simulation work except the generation of the future influent file, and wrote the manuscript. Paper 2 and paper 3 were finished before paper 1 that carried out the calibration work. Therefore, the results in paper 2 and paper 3 were updated using the calibrated parameters of paper 1. In paper 4, the author of this PhD thesis took charge of the field measurement, performed the data analysis and wrote the manuscript. However, this field measurement campaign required a large effort that cannot be accomplished by only one or two persons. Therefore, a lot of people participated in the measurement campaign. Note that although the author of this thesis wrote all the manuscripts for these papers, the co-authors also contributed with extensive review comments.
1
1 Introduction
Wastewater treatment plants (WWTPs) are large human engineering constructions used to treat wastewater produced by municipalities and industries. They are developed and designed to have a positive impact on the aquatic environment. Indeed, the treated wastewater that is discharged to the receiving natural water body is much higher in quality than raw sewage and, hence, preserves its quality. However, recent studies investigated the relation between WWTPs and climate change more closely. The latter is found to be a bidirectional effect. On the one hand, WWTPs produce greenhouse gases (GHGs), mainly including carbon dioxide (CO2), nitrous oxide (N2O) and methane (CH4). GHGs are regarded as contributing to global warming or climate change, although the specific relationship is still under research and debate. On the other hand, climate change causes an increasing number of extreme weather events, e.g. storms, which bring (hydraulic) shock loads to WWTPs and affect plant operation and performance.
Among the aforementioned GHGs, N2O is more powerful compared to CH4 and CO2. According to the report of Intergovernmental Panel on Climate Change (IPCC, 2013), the global warming potential (GWP) value for N2O is 298 in CO2 equivalents for a 100-year time horizon, i.e. 1 kilogram (kg) of N2O has the same global warming effect as 298 kg of CO2. Hence, full-scale measurement campaigns of N2O is necessary and urgent for proper evaluation of N2O emissions from WWTPs and, hence, to quantify the local and global contribution of WWTPs to climate change. Moreover, in view of mitigation, the N2O generation mechanism, especially through autotrophic pathways, should be understood, which is not the case to date. This would allow for control strategies for emission mitigation to be developed, with special considerations for N2O emissions but also trading off between GHG emissions, energy consumption and effluent quality standards instead of
2
only focusing on the latter two criteria. Such a complex interplay of processes calls for a model-based approach.
Based on such studies, the general process models, e.g. Activated Sludge Model No.1 (ASM1)-ASM3 (Henze et al., 2000), should be extended with pathways for N2O production by both heterotrophs and autotrophs. The integrated model can then be applied to full-scale plants to provide a comprehensive understanding on the N2O emissions over the whole process.
Climate change on the other hand may have negative effects on WWTPs performance. Extreme rain events bring a sudden hydraulic shock to WWTPs which usually exceeds the capacity of WWTPs. Meanwhile, in combined sewer systems, after a long period of drought, a large amount of deposits are flushed with stormwater and transported to WWTPs. This further impairs the solids removal performance of primary and secondary clarifiers (Henze et al., 2008). Moreover, rain events may also have effects on N2O emissions and total GHG emissions but no literature is available on this topic as far as the author is aware. It thus deserves to be further studied through experiments and plant-wide simulations.
The scope of this study is limited to the N2O production and emission for biological nutrient removal processes in WWTPs. Instead of process mechanism studies run in lab-scale experiments, this research was carried out on full-scale plants to investigate N2O emissions and production by different processes in a whole treatment plant, especially from the activated sludge reactor, and under complex and less controlled conditions, e.g. different weather conditions.
3
2 Literature review
2.1 GHGs emissions from WWTPs
2.1.1 WWTPs borne GHGs: classification and evaluation framework
Generally, in a WWTP there are fossil CO2, biogenic CO2 and biogenic non-CO2 GHG emissions. The fossil CO2 and the biogenic CO2 is related to the long-term and the short-term carbon cycle in the biosphere respectively. The atmosphere gaseous CO2 is taken up by plants or autotrophic bacteria, like ammonia-oxidizing bacteria (AOB) and nitrite-oxidizing bacteria (NOB), to produce carbohydrates through photosynthesis or chemosynthesis. The plants are the food for animals which means the carbon assimilated in plants is transferred to animals. However, the carbohydrates are also decomposed into CO2 that is released again to the atmosphere through respiration by the organisms. Such a carbon cycle is called the short-term carbon cycle and the gaseous CO2 in this cycle is called biogenic CO2. After the organisms die, their dead cells sink to the rocks under the earth and after millions of years become fuels such as coal or oil. These fuels are explored by mankind to produce energy. CO2 produced by burning these fossils is called fossil CO2 and the corresponding carbon cycle is a comparatively long-term process. In the evaluation framework of the Intergovernmental Panel on Climate Change (IPCC, 2006), the fossil CO2 is included for evaluating the total GHG emissions while the biogenic CO2 is not included. Besides CO2, there are also biogenic non-CO2 GHGs produced in WWTPs, like CH4 and N2O. They do not participate in the carbon cycle but have high GWP values. These non-CO2 GHGs are also included in the evaluation framework of the IPCC (2006). However, U.S. Environmental Protection Agency (U.S. EPA, 2013) suggests that the effect of biogenic CO2 on climate change should be evaluated in the same framework as N2O, CH4 and fossil CO2.
4
According to the concept of the Bridle model (Bridle et al., 2008), which was developed starting from the comprehensive model of Monteith et al. (2005), the GHG emissions from the wastewater treatment plants can be divided into five parts: (1) biotreatment, (2) sludge processing and digestion, (3) net power, (4) chemical use and (5) sludge disposal and reuse. However, the Bridle model does not include the GHG emissions due to the construction and decommissioning of the plant and the reaction of the pollutants, e.g. nitrogen (N), remained in effluent. Figure 2.1 shows the CO2 emission sources of a WWTP based on the Bridle model. In a WWTP context, N2O is produced in nitrogen removal processes and CH4 is a product of sludge digestion. N2O and CH4 can be expressed in CO2 equivalents through the GWP index. Energy consumption for aeration, pumping, etc. and chemical use can also be converted into CO2 equivalents if they are fossil-sourced. However, the WWTP’s fossil CO2 can be reduced by using CH4 which is produced during sludge treatment. Usually the CO2 emissions occur through biomass decay, organics degradation and sludge processing, which are considered as biogenic CO2 and, hence, are excluded from the evaluation (IPCC, 2006). However, an isotope experiment in Australia showed that 4-14% of the influent wastewater contained fossil carbon (e.g. as part of detergents and other chemicals produced in the petrochemical industry). 88-98% of these fossil carbons were removed either through biomass assimilation or through transformation into CO2 (Law et al., 2013).
5 Figure 2.1 GHG emission sources from a WWTP. The GWP values are from the IPCC report (2013).
According to reports of the U.S. EPA (2013) and the Electric Power Research Institute (EPRI, 2002), CH4 and N2O emissions from WWTPs account for about 0.4% and the electricity consumption makes up about 1.3% of the total national GHG emissions. According to the 2005 Australian National Greenhouse Gas Inventory (NGGI), CH4 and N2O emissions from WWTPs contribute 0.4% of the total national GHG emissions (Foley et al., 2008). However, these numbers should be treated with care as the N2O emission is calculated following the method proposed by the IPCC (2006), i.e. based on generic emission factors. In IPCC (2006), the default N2O emission factor is 0.005 kg N2O-N/kg N discharged as wastewater effluent and it is 2.24 g N2O-N/person/year for the N2O emissions during the wastewater treatment at the plant. In other words, these values are not based on specific processes and mechanisms. This has been stated to significantly underestimate N2O emissions (Ahn et al., 2010; Foley et al., 2010). On the other hand, since CH4 is a useful source of renewable energy, it only leads to biogenic CO2 and thus reduces the fossil CO2 when assuming that all CH4 can be used as energy supply.
Chemical use, aeration, pumping,
heating, transport Bioreaction Sludge treatment
CO2 Energy consumption N2O GWP: 298 CO2 GWP: 34 Greenhouse gases (GHGs) CH4
6
2.1.2 Full-scale N2O emissions
For comparison purposes of N2O emission quantities among different conditions, types of WWTPs and plant locations, it would be better to normalize the measurement data rather than using N2O emission rates directly. Usually, the N2O emission is normalized to the nitrogen load, i.e. kg N2O-N per kg of nitrogen where the latter can be either influent or removed load of either total nitrogen (TN) or total Kjeldahl nitrogen (TKN). It is recommended to use the removed nitrogen but it is also dependent on the reactor type (Porro et al., 2014). For example, in a one-stage partial nitritation-anammox system, it is hard to differentiate the amount of NH4+ removed by AOB and by anammox bacteria. Therefore, under such situations, it is suggested to use nitrogen influent load.
A survey of 12 WWTPs of various treatment processes across the USA (Ahn et al., 2010) reported N2O emission factors of 0.01-1.8% or 0.01-3.3 % which were normalized respectively by influent TKN load and removed TN load. The measurements compared N2O emissions between the aerated zone and the non-aerated zone and stated that generally the aerated zone emitted more N2O. Another full-scale experimental campaign was carried out at 7 WWTPs in Australia (Foley et al., 2010) which to a large extent covered the typical full-scale biological nutrient removal processes in use, and N2O generation was 0.6-25.3% of influent TN removed. Full-scale measurements also showed that the process technologies, in which the dissolved oxygen (DO) was evenly distributed to encourage simultaneous nitrification and denitrification (e.g. an oxidation ditch) emits low N2O (Ahn et al., 2010; Foley et al., 2010). Ye et al. (2013) proposed a method for measuring the N2O emissions from open oxidation ditches equipped with surface aerators. This method calculated the N2O emissions from the gas transfer coefficient and dissolved N2O measurements, resulting in an emission factor of 0.16-0.52% of influent TKN load for the Australian WWTP.
7 One year dynamic N2O emissions were calculated using the on-line data of dissolved N2O concentration and the off-gas gas flow rate at a WWTP in the Netherlands (Daelman et al., 2013a). The results from the different measurement strategies suggested that long-term on-line sampling better estimated the N2O emissions and better captured the N2O variation dynamics. Given the cost of such a one-year campaign, the experiment can be designed as a set of short-term sampling periods randomly distributed over the year (Daelman et al., 2013a).
2.2 N
2O production pathways
The production of N2O in wastewater treatment processes can be related to different mechanisms which are either chemical or biochemical in nature.
2.2.1 Biochemical pathways
Figure 2.2 shows the mechanisms involved in the biochemical N removal process. In the traditional theory, biological N-removal is described by 2-step autotrophic nitrification, ammonia (NH4+) nitrite (NO2-) nitrate (NO3-), and 4-step heterotrophic denitrification, NO3- NO2- nitric oxide (NO) N2O dinitrogen (N2). Therefore, N2O is only considered to be an intermediate product of the heterotrophic denitrification.
8
Figure 2.2 Scheme of biochemical N removal and N2O productions (AMO: ammonia monooxygenase; HAO: hydroxylamine oxidoreductase; NAR: nitrate reductase; NiRK: nitrite reductase used by AOB; NiR: nitrite reductase; NOR: nitric-oxide reductase; NOS: nitrous oxide reductase; NXR: nitrite oxidoreductase).
Besides the heterotrophic denitrification, N2O may also be the result of the autotrophic metabolisms. This pathway is still under debate but the general view attributes the autotrophic N2O to the AOB (Bock et al., 1995; Colliver and Stephenson, 2000; Remde and Conrad, 1990; Schmidt and Bock, 1997). The denitrification enzymes NO2- reductase and nitric oxide reductase are found to exist in N. europaea, an AOB, but N2O reductase converting N2O to N2 was not reported yet (Chain et al., 2003; Hooper, 1968).
I. Heterotrophic pathways
In engineering practice, denitrification reaction zones are usually put in front of nitrification zones in order to provide readily biodegradable carbon sources for heterotrophic denitrification. This is usually referred to as the pre-denitrification configuration or the modified Ludzack-Ettinger (MLE) process (Figure 2.3). Sometimes external carbon sources (e.g. methanol or ethanol) are required because the influent ratio between organic carbon and nitrogen (C/N) is low. Another consideration for this reactor configuration is the fact that denitrification produces alkalinity which is destroyed by nitrification. Denitrification
NH4+ NO2- NO N2O N2O NO 3-Autotrophic reactions Heterotrophic reactions N2 AMO HAO NXR NiRK NOR NiR NOR NAR NOS
9 thus reduces the cost of alkalinity dosage. Moreover, nitrification bacteria prefer a somewhat alkaline environment with an optimal pH value of 7.5-8.0 and nitrification rates decrease sharply when the pH drops below 6.8 (Metcalf & Eddy, 2003).
Figure 2.3 Illustration of the MLE process configuration for nitrogen removal.
There are many factors affecting heterotrophic denitrification and related N2O production as discussed below.
– Organic substrates
In heterotrophic denitrification, the carbon substrate is used as electron donor. When the C/N is low, denitrification will be limited by lack of electron donors. The competition among different nitrogen oxides on the limited electrons results in either increasing or decreasing N2O production rates (Pan et al., 2012). Those phenomena were observed experimentally (Itokawa et al. 2001; Alinsafi et al., 2008).
The type and properties of the carbon source also affect N2O emissions. Simple and easily biodegradable substrates like volatile fatty acids (VFAs) are usually preferred by denitrifiers (Elefsiniotis and Wareham, 2007), while the complex organics have to be decomposed into simple organics by hydrolysis for heterotrophic consumption. Adouania
Effluent
Waste sludge Influent Anoxic tank
(Denitrification) Aerobic tank (Nitrification) NO3- recycle Sludge recycle Settler
10
et al. (2010) compared N2O and NO emission by using three types of carbon sources and reported that acetate produced more N2O and NO per N denitrified than the other two kinds, and ethanol generated the lowest, while the mixture of short and long chain carbon sources caused quite low N2O and NO emissions.
- NO2
-NO2- is an intermediate product of denitrification. Accumulation of NO2- changes N2O generation and emission because of the higher abundance of NO2- potentially producing NO and N2O as well as the well-known inhibition effect of NO2- or NO on heterotrophs to reduce N2O (Alinsafi et al., 2008; Stein and Yung, 2003; Stouthamer et al., 1997).
- DO
N2O reductase is more sensitive to oxygen compared to other reductases of denitrification, and, consequently, a low concentration of DO around 0.4-2 mg O2/l may cause N2O accumulation and emission (Otte et al., 1996; von Schulthess et al., 1994).
- pH
Heterotrophs have been shown to be more sensitive to pH during the reduction of N2O compared to the reduction of other nitrogen oxides. It is reported that under low pH conditions more N2O is produced by heterotrophic denitrification (Hanaki et al., 1992; Thörn and Sörensson, 1996; Van Den Heuvel et al., 2011). This could also be due to competition for electrons among different nitrogen oxides (Pan et al., 2012).
II. AOB pathway
Two biochemical AOB pathways exist. In the first one N2O is generated as an intermediate product during NH4+ oxidation to NO2- via hydroxylamine (NH2OH). The second pathway is the so-called the AOB denitrification, i.e. NO2- reduction (Ni et al., 2013a; Kampschreur et
11 al., 2007; Wunderlin et al., 2012). N2O can also be produced from the chemical cission of the hyponitrous acid (NOH) which is formed during NH2OH oxidation (Law et al., 2012).
The scientific discussions regarding the AOB pathways of N2O production concern the effects of NH4+, NO2-, NH2OH and DO on the process rates.
- NH4+, NO2- and NH2OH
It is generally agreed that an increase of NH4+, NH2OH and NO2- leads to an increase of N2O formation (Kampschreur et al., 2008; Kim et al., 2010; Law et al., 2012; Wunderlin et al., 2012; Yu et al., 2010). No matter which pathway dominates, NH4+ is source for all N components, including N2O. Therefore, an increase of NH4+ increases the N pool and results in higher N2O production potential. The debate on different pathways of N2O production by AOB is caused by experimental data that showed an increase of N2O by either increasing NO2- or increasing NH2OH. In the NH2OH oxidation pathway, NH2OH serves as electron donor and, hence, adding more NH2OH supplies more electrons. In the NO2- reduction pathway, NO2- is first reduced to NO and subsequently to N2O and, hence, adding more NO2- leads to higher N2O production. The observation of both phenomena indicates that both pathways possibly coexist in the system. Which of the two is dominating depends, according to current understanding, on the system’s operational conditions (Wunderlin et al., 2012). However, these authors also mention that in real WWTPs the NH2OH concentration is usually found to be lower than under experimental conditions in the laboratory and the NO2- reduction pathway might then be the main contributor.
Regarding the NO2- reduction pathway, another study showed that free nitrous acid (FNA), instead of NO2-, is the real electron acceptor (Shiskowski and Mavinic, 2006). Therefore, the pH value would affect N2O production. The sequencing batch reactor (SBR)
12
experiments carried out by these authors indicate an increase of N2O production through the AOB pathway as pH decreases. Wrage et al. (2001) conclude the same from thermodynamic calculations.
- DO
DO is another important factor for N2O formation through the AOB pathway. Some literature reports that AOB N2O production happens under oxygen-limited conditions (Kampschreur et al., 2008) or increases with decreasing DO concentrations (Aboobakar et al., 2013). Other researchers observed that AOB N2O production is occurring during the recovery from an anoxic shock, which in this study consists of a transitent anoxic period of 48 hours imposed to the AOB cultivated under chemostat conditions (Yu et al., 2010). According to this finding, an anoxic shock may be created in a MLE process at the place where the wastewater is recycled from the aerobic zone to the anoxic zone, which could thus lead to AOB N2O production. However, there would be little N2O production expected from this mechanism, because the anoxic condition is not ―transitent‖ in the anoxic zone of a MLE process. There also appears to be a threshold value of DO at which N2O production by AOB is maximized (Tallec et al., 2006; Law et al., 2012). The different opinions on the DO effect are also due to different experimental observations. However, there seems to be a dual effect by either increasing or decreasing DO. On the one hand, AOB, as aerobic bacteria, prefer aerobic conditions and, hence, higher DO concentrations benefit AOB growth and thus potentially lead to more N2O production. However, higher DO concentrations can also increase NO2- oxidation by NOB, leaving less NO2- for N2O production. The same reasoning can be applied to DO limiting conditions. On the one hand, AOB growth might be hampered by low DO conditions. On the other hand, NO2- may accumulate when the DO is insufficient for NO2- oxidation to NO3- and the large amount of NO2- will potentially cause high N2O production. Changes in DO usually lead to
13 simultaneous dynamics of other components, like NH4+, NO2- and NO3-, making the understanding of the different impacts difficult. It is thus important to take into account other components to achieve a comprehensive understanding of AOB N2O production under different DO conditions.
III. PAO pathway
Under anoxic conditions, it has been observed that some phosphorous accumulating organisms (PAOs) can denitrify NO3- and NO2-, while storing phosphorous (P) as polyphosphate (Kuba et al., 1993; Ahn et al., 2001). Similar to the ordinary PAOs, denitrifying PAOs (DPAOs) store external carbon sources as internal polyhydroxyalkanoates (PHA) under anaerobic conditions and use the internally stored PHA as energy source for bacterial activities. However, instead of using DO as electron acceptors, DPAOs utilize NO3- and NO2- under anoxic conditions. The presence of DPAOs in WWTPs brings advantages of saving energy due to reduced aeration demand, lower chemical oxygen demand (COD) requirement and lower sludge production (Kuba et al., 1996).
However, PAOs are in competition with yet another kind of organisms, i.e. glycogen accumulating organisms (GAOs). They also store internal carbon sources, PHA, by uptake of external organic substrate under anaerobic conditions (Cech and Hartman, 1993; Liu et al., 1994). Just like DPAOs, denitrifying GAOs (DGAOs) also denitrify NO3- and NO2- by using internally stored PHA as electron donors. Obviously, the very similar metabolism between PAOs (or DPAOs) and GAOs (or DGAOs) triggers competition.
Zeng et al. (2003a, 2003b) ran two sets of experiments with a SBR. The first one was run in aerobic-anoxic cycles. The second one was operated in anaerobic-aerobic cycles but the aerobic periods had low DO concentrations to promote simultaneous nitrification and
14
denitrification. Both experiments show that the major end product of denitrification was N2O and not N2. However, it were the DGAOs playing the major role in the denitrification. P-uptake by PAO is more likely to happen under aerobic conditions. Similar results were obtained by Lemaire et al. (2006) who also ran an anaerobic-aerobic SBR with low DO concentrations in aerobic periods. By comparing the performance of PAOs and ordinary heterotrophic organisms on denitrification, Hu et al. (2002) found that the DPAOs participated in denitrification only when the NO3- load was in excess. These studies indicate that DPAOs play a minor role in denitrification when competing with GAOs and ordinary heterotrophs. In this PhD thesis GAOs are not differentiated from other heterotrophs.
2.2.2 Chemical pathway
In the wastewater treatment industry the chemical pathway of N2O formation was thought to have little or no effect on N2O production compared to the biochemical pathways. However, under certain conditions it can contribute significantly to N2O production (Kampschreur et al., 2011). Under anoxic conditions, it was found that when pH was approximately neutral N2O was produced chemically through the reduction of NO2- with simultaneously oxidation of ferrous iron (Fe2+) to ferric iron (Fe3+) as shown in Figure 2.4 (Kampschreur et al., 2011; Tai and Dempsey, 2009; van Cleemput, 1998). Kampschreur et al. (2011) suggested that the chemical NO2- reduction should be considered when iron is dosed and a large amount of NO2- is present.
Figure 2.4 Scheme of the chemical NO2- reduction (Kampschreur et al., 2011).
NO2- NO
Fe2+
N2O
15 Finally, stated before in Section 2.2.1 ―II. AOB pathway‖, NOH may also be formed during NH2OH oxidation and be further broken down chemically to N2O by AOB.
2.3 Modelling of N
2O emissions
This section only discusses the modelling of the biochemical pathways, excluding the chemical pathway. However, the structure of the text is similar as that of Section 2.2.1. Traditional ASMs, i.e. ASM1-ASM3, simply model the nitrification process as a one-step process of ammonia oxidation to NO3- and autotrophs are taken as one species without discrimination between AOB and NOB. A similar situation occurs for the heterotrophic denitrification which is described as one step of NO3- denitrification to N2. Therefore, in order to simulate the dynamics of N2O produced during heterotrophic denitrification, the single processes of denitrification must be replaced by a multistep process. Moreover, if the N2O production by AOB is to be taken into consideration, the autotrophic biomass and the nitrification process must be split into separate bacterial consortia and processes.
Page | 16
Table 2.1 Structures of models Models Extension on IWA ASMs Nitrification N2O (or NO) production by AOB pathways Heterotrophic denitrification PAO denitrification
N2O production Calibration and application Heterotrophs AOB PAO
Iacopozzi et al.
(2007) ASM3 2 steps No 2 steps No No No No BSM1
Kaelin et al.
(2009) ASM3 2 steps No 2 steps No No No No
Lab-scale batch tests and pilot DN-N plant von Schulthess
and Gujer (1996) ASM1 2 steps No 3 steps No Yes No No Real DN-N plant
Hiatt and Grady
(2008) ASM1 2 steps No 4 steps No Yes No No
Virtual CSTR and MLE processes Flores-Alsina et
al. (2011) ASM1 2 steps No 4 steps No Yes No No BSM2
Samie et al.
(2011) ASM1 1 step No 4 steps No Yes No No
Real denitrifying biofilter
Pan et al. (2013) - - - 4 steps - Yes - - Lab-scale SBR
Ni et al. (2011) ASM1 2 steps NH2OH pathway 4 steps No Yes Yes No
Lab-scale batch tests, lab-scale SBRs and pilot aeration tank Ni et al. (2013a) ASM1 3 steps NH2OH pathway 4 steps No Yes Yes No Real oxidation ditch
Law et al. (2012) - - NH2OH pathway - - Yes - -
Lab-scale batch tests and lab-scale SBR
Note: ―-‖ means not mentioned in the reference paper; ―DN-D‖ stands for denitrification-nitrification; ―SBR‖ stands for sequencing batch reactor; ―BSM‖ stands for benchmark simulation model.
Table 2.1 Structures of models (continued) Models Extension on IWA ASMs Nitrification N2O (or NO) production by AOB pathways Heterotrophic denitrification PAO denitrification
N2O production Calibration and application Heterotrophs AOB PAO
Mampaey et al.
(2013) - 2 steps NO2- pathways - - Yes - - Virtual SHARON reactor
Kampschreur et
al. (2007) ASM2d 2 steps
NH2OH pathway and
NO2- pathway
2 steps 1 step No No No Lab-scale SBR
Ni et al. (2014) - 3 step NHand 2OH pathway NO2- pathway
- - No Yes No Lab-scale batch tests and
lab-scale SBR Houweling et al.
(2011) - - Empirical method - - - Yes -
Lab-scale SBR and pilot-scale MLE process
Ali et al. (2013) - - Empirical method - - - Yes - Lab-scale SBR
Sin and Vanrolleghem (2006)
ASM2d 2 steps No 2 steps 1 step No No No Pilot-scale SBR
Oehmen et al.
(2010) - - - 4 steps 4 steps Yes - Yes Lab-scale SBRs
Rodriguez-Garcia
et al. (2012) ASM1 2 steps NO2- pathways 4 steps No Yes Yes No Virtual MLE processes Pocquet et al.
(2012) ASM3 2 steps
NO2- pathways NH2OH pathway Empirical method
4 steps - Yes Yes No Lab-scale SBRs
Note: ―-‖ means not mentioned in the reference paper; ―DN-D‖ stands for denitrification-nitrification; ―SBR‖ stands for sequencing batch reactor; ―BSM‖ stands for benchmark simulation model; in the combined model of Pocquet et al. (2012) which is based on ASM3, only the empirical method (Houweling et al., 2011) is used to describe the AOB N2O production, although all three AOB N2O production models are tested in the aerobic phase of the SBR.
18
2.3.1 Model structures
In the sequel the different model structures will be presented in the following order: I. heterotrophic N2O production; II. autotrophic N2O production; III. N2O production by PAO; IV. production of N2O by heterotrophs and autotrophs combined; V. comprehensive N2O production, including other GHG emissions.
I. Heterotrophic production of N2O
Biokinetic models with 2-step nitrification and 2-step denitrification existed for some time prior to this PhD study (Iacopozzi et al., 2007; Kaelin et al., 2009; Sin et al., 2008b), i.e. the nitrification had two steps as NH4+ NO2- NO3- and the denitrification also had two steps mainly as NO3-NO2-N2 or NO3- (NO2-) N2. The main objective of those models was NO2- simulation and the primary reasons for describing denitrification in only two steps without consideration of NO and N2O were the minor contributions of NO and N2O to the total nitrogen mass flow and the difficulties of predicting NO/N2O (Sin et al., 2008b). However, the 2-step denitrification models do not allow modelling the N2O production and thus cannot be used for GHG studies.
von Schulthess et al. (1994) extended the denitrification process of ASM1 into three steps, i.e. NO3- NO2- N2O N2. The inhibition effect of NO2- was considered by an inhibition term in the kinetic equation of each step. Later, this model was further modified by (i) adding an organic substrate Monod term in the three denitrification process steps, (ii) separating the nitrification process into two steps by AOB and NOB respectively and (iii) integrating an anoxic hydrolysis process (von Schulthess and Gujer, 1996).
The big change came when Hiatt and Grady (2008) proposed the Activated Sludge Model for Nitrogen (ASMN) which was also based on ASM1 and describes 2-step nitrification and 4-step denitrification. In ASMN, instead of NH4+ and NO2-, free ammonia (FA) and FNA
19 were considered as true substrates for nitrification of AOB and NOB respectively. The concentrations of FA and FNA are calculated as Eq. (2.1) and Eq. (2.2).
pH FA NH 6344/(273.15 + ) pH 10 e T 10 S S Eq. (2.1) FNA NO2 -2300/(273.15 + ) pH
1
1+e
T10
S
S
Eq. (2.2)where SNH and SNO2 are the concentrations of NH4+ and NO2- and T is the Celsius temperature.
FA inhibition of AOB growth, FNA inhibition of NOB growth and NO inhibition of NO reduction by heterotrophs were described as competitive inhibition terms, Eq. (2.3).
S I Competitive Term / S K S K S Eq. (2.3)
where S is the concentration of FA (for NH4+ oxidation) or FNA (for NO2- oxidation), KS is the half-saturation coefficient and KI is the inhibition coefficient.
Instead of the Arrhenius equation which is usually used in ASM1-ASM3, the temperature dependence of the maximum specific growth rates of AOB, NOB and heterotrophs were described by the Ratkowsky equation in which the maximum specific growth rate first increases and then decreases with increasing temperature (Ratkowsky et al., 1983), Eq. (2.4).
bacteria( Max,bacteria)
2R,bacteria bacteria Min,bacteria
1
c T T
b
T T
e
Eq. (2.4)where bμbacteria and cμbacteria are coefficients, and TMax,bacteria and TMin,bacteria are the maximum and minimum temperatures. Figure 2.5 illustrates the difference between the Arrhenius
20
and Ratkowsky equations on the maximum specific growth rate of heterotrophs with temperature dependency. The parameters of the Arrhenius equations were taken from Henze et al. (2000) and the parameters of the Ratkowsky equations from Hiatt (2006).The two equations give similar kinetics between 5 ºC and 25 ºC, the typical activated sludge operating range. However, there are cases requiring the model to be applicable for temperatures higher than this boundary. For example, in the SHARON (Single reactor system for High activity Ammonia Removal Over Nitrite) processes, which are used to treat wastewater with high NH4+ concentration, a high temperature is usually applied, i.e. between 30-40 ºC (Hellinga et al., 1999; Volcke et al., 2007). Therefore, for such reactors, the Ratkowsky equation has advantages over the Arrhenius equation.
Figure 2.5 Maximum specific growth rate of heterotrophs expressed by the Arrhenius equation (dashed) and the Ratkowsky equation (solid).
Besides the nitrification-denitrification process ASMN also modelled mixotrophic growth of NOB, i.e. also using organic carbon for growth next to CO2, assimilative NO3- reduction to ammonia (ANRA), and biodegradation of nitrification inhibitors and priority pollutants. All
0 10 20 30 40 50 60 0 10 20 30 40 50 μH (d -1) Temperature (ºC)
21 these features make ASMN applicable to high-nitrogen load and industrial wastewater treatment. Hiatt and Grady (2008) compared the simulation results of ASMN with ASM1 using the same influent loads. The biomass concentration of nitrifiers was substantially higher for ASMN than the autotrophs in ASM1, because of the mixotrophic growth of NOB in ASMN.
Based on the nitrification and denitrification processes in ASMN of Hiatt and Grady (2008), Flores-Alsina et al. (2011) proposed a model which is suitable for municipal wastewater treatment. ASM1 was used as the basic biokinetic model to model hydrolysis, ammonification, and aerobic growth and decay of heterotrophs. The aerobic growth and decay of autotrophs, AOB and NOB, and the anoxic growth of heterotrophs was modelled as in ASMN (Hiatt and Grady, 2008), and the substance N2 was added as the product of N2O reduction. Allowing to make the model’s N mass balance, following Henry’s law, an aeration equation was included for the oxygen transfer and gas stripping equations modelled the gas emitted flux of NO, N2O and N2. Samie et al. (2011) also extended the denitrification of ASM1 into four steps as in ASMN (Hiatt and Grady, 2008), but the nitrification was still simulated as one step, since their simulation study was focused on denitrifying biofilters.
Instead of using kinetic parameter tuning, Pan et al. (2013) recently proposed a novel model to describe the competition among the four steps of the heterotrophic denitrification on the electrons originating from the organics (Figure 2.6). Two new state variables were added, i.e. SMox standing for the oxidized mediator and SMred standing for reduced mediator. The sum of SMox and SMred is a constant, i.e. the total concentration of the electron carriers. Instead of directly using the organic substrate as the electron donor, an oxidized mediator is reduced in carbon oxidation processes and subsequently the reduced mediator is used as electron donor for the heterotrophic denitrification. With such a model, the observations
22
regarding N2O accumulation can be explained more easily and it proves that the electron competition also happens under carbon-abundant conditions.
Figure 2.6 Scheme of the model proposed by Pan et al. (2013) (The nomenclature of the enzymes is explained in Figure 2.2).
II. AOB production N2O
Since the N2O production through the AOB pathways has not obtained consensus yet, there is no widely accepted corresponding model. Based on various pathways and influencing factors, different biokinetic models have been proposed (Law et al., 2012; Ni et al., 2011; Ni et al., 2013a; Mampaey et al., 2013). These models can be roughly divided into two groups, i.e. models that simulate N2O production during NH2OH oxidation and models that simulate N2O as a product of NO2-reduction (also called AOB denitrification).
The two models of Ni et al. (2013a) and Law et al. (2012) belong to the first group. They all assume that first NH4+ is oxidized to NH2OH which then serves as electron donor.
CO2 Carbon source SMox SMred NAR NIR NOR NOS NO3 -NO2 -NO N2O N2
23 According the model of Ni et al. (2013a), NH2OH is first oxidized to NO which is then further oxidized to NO2- where N2O is directly produced from NO denitrification (Figure 2.7 b). The model of Law et al. (2012) further includes NOH, besides NH2OH. It followes the sequence: NH4+ NH2OH NOH NO2-. N2O is formed from the chemical breakdown of NOH (Figure 2.8).
In the model of Ni et al. (2011) NH2OH is also firstly produced from NH4+ oxidation but then it is directly oxidized into NO2- which is further reduced to NO and N2O (Figure 2.7 a). The models of Mampaey et al. (2013) do not consider NH2OH and focus on the NO2reduction pathways. Two model hypotheses were presented, i.e. scenario A and scenario B. They both assume that NH4+ is oxidized into NO2- which is further reduced to NO and N2O. The difference between the models is the dependence on DO and electron donor. Scenario A assumes that AOB denitrification is preferred over aerobic conditions and NH4+ is used as electron donor whereas in Scenario B the AOB biomass acts as the electron donor and the process occurs under either aerobic or anoxic conditions (Figure 2.9). The effect of pH was considered in Scenario A which assumed FNA, instead of NO2-, as the real substrate. Actually, Scenario A of Mampaey et al. (2013) is quite similar to the model of Ni et al. (2011). They both denitrify in steps of NO2- NO N2O, but they use different electron donors, i.e. NH4+ (Mampaey et al., 2013) or NH2OH (Ni et al., 2011). However, NH2OH is essentially an oxidation product of NH4+. Therefore, the model of Ni et al. (2011) and the models of Mampaey et al. (2013) belong to the group of NO2- reduction pathway models.
24
Figure 2.7 Scheme of the model proposed by Ni et al. (2011) (a) and the model proposed by Ni et al. (2013a) (b) (The nomenclature of the enzymes is explained in Figure 2.2).
Figure 2.8 Scheme of the model proposed by Law et al. (2012) (The nomenclature of the enzymes is explained in Figure 2.2).
NH4+ AMO NH4+ NH2OH HAO NH2OH NO 2-NH4+ NO 2-NO NH2OH N2O N2O NO NOH AMO NO 2-Chemical breakdown HAO N2O AMO NiRK NOR HAO NOR HAO HAO a. b.