Science Arts & Métiers (SAM)
is an open access repository that collects the work of Arts et Métiers Institute of
Technology researchers and makes it freely available over the web where possible.
This is an author-deposited version published in: https://sam.ensam.eu Handle ID: .http://hdl.handle.net/10985/15236
To cite this version :
Qiaorui SI, Wenting HE, Gérard BOIS, Qianglei CUI, Shouqui YUAN, Keyu ZHANG
-Experimental and numerical studies on flow characteristics of centrifugal pump under air-water inflow - International Journal of Fluid Machinery and Systems - Vol. 12, p.31-38 - 2019
Any correspondence concerning this service should be sent to the repository Administrator : [email protected]
Experimental and numerical studies on flow characteristics
of centrifugal pump under air-water inflow
Qiaorui Si
1, Wenting He
1, Gerard Bois
2, Qianglei Cui
1, Shouqi Yuan
1*and Keyu Zhang
11
National research center of pumps, Jiangsu University
No301 Xuefu Road, Zhenjiang City, 212013, China, [email protected],
[email protected][email protected]
2
LMFL, FRE CNRS 3723, Arts et Métiers ParisTech
8 boulevard Louis XIV, Lille City, 59000, France, [email protected]
Abstract
A two-phase liquid pumping test ring is built to study the flow induced characteristics of centrifugal pump under the air-water flow working condition. Pump performances are measured under different flow rates and different inlet air void fraction (a). Pressure pulsation signal spectrums and their probability density maps are also recorded. The calculations, using URANS k-epsilon turbulence model combined with the Euler-Euler inhomogeneous two-phase model, are also performed to obtain inner flow structure inside the impeller and volute channels under different air-water conditions in order to understand the pump characteristic evolutions. The results show that the performance of centrifugal pump is more sensitive to air inlet injection at low flow rates. The maximum air void fraction of model pump could reach 10% when the pump operates at the highest efficiency point, and the performance drops sharply when the air void fraction is more than 8%. The dominant frequency of pump outlet pressure pulsation is still at the blade passing frequency even under two-phase condition. Frequency amplitude increases with the increase of a. The greater the a, the more low frequency appears in broadband characteristics. With the increase of a, the probability density amplitude of pressure pulsation decreases gradually, and its span becomes gradually wider as well. Comparisons between numerical local results, experimental unsteady pressure can explain part of the phenomena that are found in the present paper.
Keywords: two phase flow, centrifugal pump, flow characteristic, Euler-Euler inhomogeneous model
1. Introduction
Pumping and processing fluids with different properties have revealed to be some of the major challenges in the last decades in the energy and process engineering field. In engineering practice, the case of pumping air-water inflow is often encountered. However, gas handling capabilities of radial impellers can be quite limited because the two-phase flows pattern are subject to phase separating effects due to blade to blade pressure gradients as well as Coriolis acceleration with additional strong radial pressure gradients caused by centrifugal forces. It is necessary to understand the pump behaviour under two-phase flow conditions.
Since the 1970s, experimental overall performance tests such as, Murakami and Minemura[1], Chisely [2], Sato et al.[3], including the effect of outlet blade angle and researches perform by Tulsa University team such as Cirillo[4], Romero[5] and Rodrigues[6], allow to get more understanding on global flow features and surging phenomena. More recently, Kosyna et al.[7] measure impeller blade unsteady static pressure on the rotating impeller blade pressure and suction sides. Local flow visualizations, bubble trajectories and sizes evaluation have been performed, for example by Secoguchiet et al.[8], Izturiz [9], and Barrios[10]. An evaluation of local void fraction in two phase flows recently obtained by Neumann et al.[11], using X-Ray tomography technique, also detected a thin gas film on the pressure side for the first time. Thanks to the support of experimental studies, rather efficient flow models have been proposed in the open literature. Mijielewicz et al.[12] developing a semi-empirical method to obtain the so called “head loss ratio”. Furuya et al.[13] evaluated 1D loss including bubble drag force. Minemura et al.[14] introduces the effect of slippage between the two phases and proposes an extended formulation, using a two-fluid model under the assumption of rather homogeneous gas-liquid mixture. Based on the model proposed by Sachdeva et al.[15], Sun[16] proposed an improved new gas-liquid model using a stratified assumption and new drag correlations. More specific models were also developed and propose prediction methods for pump surge and gas lock such as Estevam et al.[17] and Barrios[18]. Recently, 3D numerical approaches are known as more useful to understand two-phase flow evolution. Interesting results have been obtained by Minemura and Uchiyama[19], Caridad and Kenyery[20] who undergoes bubble size effects, using a steady flow assumption, Clarke et al.[21], Noghrehkar et al.[22] and more recently Müller et al.[23] obtained local void fraction evaluation using a mono dispersed gas model for single channel steady calculation. As shown in previous published papers from the present research team (Si et al.[24-25]), CFD results show quite good agreement with overall experimental results. These calculations solve Unsteady Reynolds Average Navier-Stokes (URANS) equations using the k-e turbulence model and flow mixture inhomogeneous one (instead of usually homogeneous model). However, few of unsteady results between numerical and experimental ones have been showed for flow characteristic analysis.
2
2. 2. Test Rig
The design parameters of the chosen centrifugal pump are as follows: flow Qd=50.6 m3/h, head Hd=20.2 m, rotational speed
nd=2910 m3/h.Test rig is shown in Figure 1 More details of the pump parameters and loop operation could be found in Si et
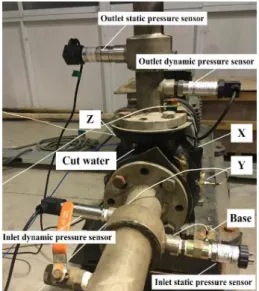
al.[24-25]. Figure 2 shows a general view of sensor locations close to the pump environment. Pump head and global efficiency is also obtained following ISO 9906:2012. It has to be noticed that only air volume flow rate is measured at this step, bubble diameter distribution including bubble number per volume at pump inlet is not available.
Pump Upstream Tank Mixer Compressor Gas-liquid flow Non-return valve Air flow meter
Gas-liquid flow
Flow meter
Regulating valve
Water flow meter Ball valve
Downstream Tank
Flexible connecting pipe
Fig.1 Test rig Fig.2 Sensor locations
3. 3. Experimental Pump Flow-induced Characteristics
3.1 Pump Overall Performance
Figure 3 shows pump performance curves at different given void fraction values. It can be seen, as already pointed out by several previous researchers, that pump performance starts to be significantly lower when void fraction reaches 3% and more.
The value of the head performance degradation also depends on the water flow rate. A decrease of 20% of head compared with single phase shut-off conditions is achieved for all water flow rates below nominal conditions for void fraction going up to 7%. Lowest void fraction up to 10% can be achieved without pump surge for water flow rates around 32~40 m3/h. These values correspond to 0.7 up to 0.8Qd when the pump normally operates at the highest efficiency region. Pump performance drops sharply
when the air void fraction is more than 8%.
0 5 10 15 20 25 30 35 40 0.0 20.0 40.0 60.0 80.0 H /m Q/m3·h-1
a=0 a=1% a=3% a=5%
a=7% a=8% a=9% a=10%
0 10 20 30 40 50 60 70 80 0 . 0 2 0 . 0 4 0 . 0 6 0 . 0 8 0 . 0 η/% Q/m3·h-1 a = 0 a = 1 % a = 3 % a = 5 % a = 7 % a = 8 % a = 9 % a = 1 0 %
(a) Head (b) Efficiency Fig.3 Pump overall performance curves for different α 3.2 Pressure Pulsation
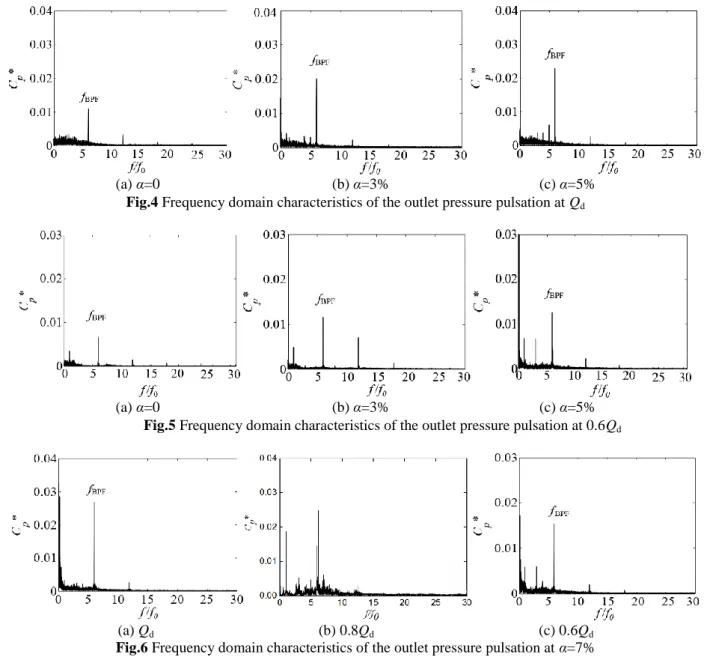
Figure 4 gives the frequency domain characteristics of the outlet pressure pulsation measured at volute outlet section for Qd. It
shows the main frequency of pressure pulsation is obviously the blade passing one, whatever the a is. The amplitude of pressure pulsation at blade passing frequency shows a gradual increase trend. The amplitude of pressure pulsation at low frequency region increases when the a is more than 5%. The larger the a, the more the low frequency region is excited. Note that when the flow rate is decreasing (Figure 5), the amplitude of the pressure pulsation is decreasing as well. For a given a value (Figure 6), it is believed that this phenomena is probably related to a damping effect due to the development of high local void fraction inside the impeller and to the related decrease of blade loading because of stronger pressure losses along the blade passage. These frequencies emergence will be analyzed next.
(a) α=0 (b) α=3% (c) α=5% Fig.4 Frequency domain characteristics of the outlet pressure pulsation at Qd
(a) α=0 (b) α=3% (c) α=5% Fig.5 Frequency domain characteristics of the outlet pressure pulsation at 0.6Qd
(a) Qd (b) 0.8Qd (c) 0.6Qd
Fig.6 Frequency domain characteristics of the outlet pressure pulsation at α=7%
Figure 7 presents the pressure pulsation characteristics of the pump. It is shown from Figure 7(a) and 7(b) that the
overall amplitude of the pressure pulsation would significantly decrease in the whole frequency range with the
increase of a, especially in small flow condition (0.6 Q
d). With the increase of a, the probability density amplitude of
pressure pulsation decreases gradually, and its span becomes wider gradually. Figure 7(c) shows that the pressure
pulsation coefficient defined by equation (1) and (2) increase with the increase of a, especially in 0.6 Q
d, the pressure
pulsation coefficient increase faster than Q
d, indicating that it has a greater influence on pressure pulsation coefficient
under small flow condition. Therefore, the pressure pulsation law of these two signals with different a could be used
as an important basis for flow monitoring.
2 2
p
0.5
C
p
p
u
(1)
2 1( )
N p i pu
C i
N
(2)
4 PD PD 0 1 2 3 4 5 6 7 0% 1% 2% 3% 4% 5% 6% 7% 8% up /10 -4 IAVF Qd 0.6Qd
(a) Probability densities: Qd (b) Probability densities: 0.6Qd (c) Pressure pulsation coefficient
Fig.7 Flow-induced pressure pulsation characteristics of pumps
4. Numerical Simulation Analysis
4.1 The Eulerian-Eulerian Inhomogeneous Two-phase model
There are two kinds of Eulerian-Eulerian multiphase flow models: homogeneous and inhomogeneous flow model. In the inhomogeneous model, each phase has its own fluid field and passes through the phase transfer unit. This paper adopts the inhomogeneous model regardless of the temperature field, in which the liquid phase is continuous and gas phase is discrete. Moreover, phase transfer unit utilizes Particle model, which assumes that the gas-liquid two-phase flow pattern as bubbles, meeting the principle of the mass and momentum conservation.
The governing continuity equation and momentum equation is
(
k k)
(
k kw
k)
0
t
(3) T(
k k k)
(
k k k k)
kp
k(
k k(
k(
k) ))
k kt
w
w
w
w
w
M
f
(4)The gas and liquid meet the following formula, which are expressed as:
1
g l
(5)/ (
)
gQ
gQ
gQ
l
(6) The action between the two phases only take into account the resistance, which the resistance equation acting on the liquid phase is expressed as:3
(
)
4
l l g D g g l g l BM
M
c
w
w w
w
d
(7) where 0.687 24 (1 0.15 ) (Re 1000) 0.44 (Re 1000) D Re c Re (8)The SST turbulence model is adopted in the liquid phase, taking into account the transport of the turbulent shear stress, which gives a more accurate prediction of the flow separation under the inverse pressure gradient. Meanwhile, the gas phase is model by zero equation theory.
4.2 Pump model, meshes and boundary condition
The calculated pump domain is divided into five parts such as the inlet, ring, impeller, volute and chamber to build a model mesh for a complete pump, as shown in Figure 6. The grids for the computational domains are generated using Ansys ICEM 14.5 with blocking method. The resulting pump model consisted of 2775915 elements is chosen in total after independence analysis.
(a)flow domain (b)Grid independence Figure8. 3D model of numerical domain with local meshing
Figure 9. Monitoring points
Simulation process by Ansys CFX 14.5 at different a is performed with total pressure at the inlet and mixture mass flow rate at the outlet. Smooth wall condition is used for the near-wall function. Initial inlet bubble diameter is set as 0.2mm. Time step was set as 1.718×10⁻⁴s,amount to 3° rotation for each step and a total time as 0.206s for the unsteady calculation. As shown in Figure 9, several monitoring points are set for further analysis. Comparison overall performance between experiment and CFD under different a (below 7%) shown in SI et al.[24-25] validated the credibility of the simulation.
4.3 Numerical results
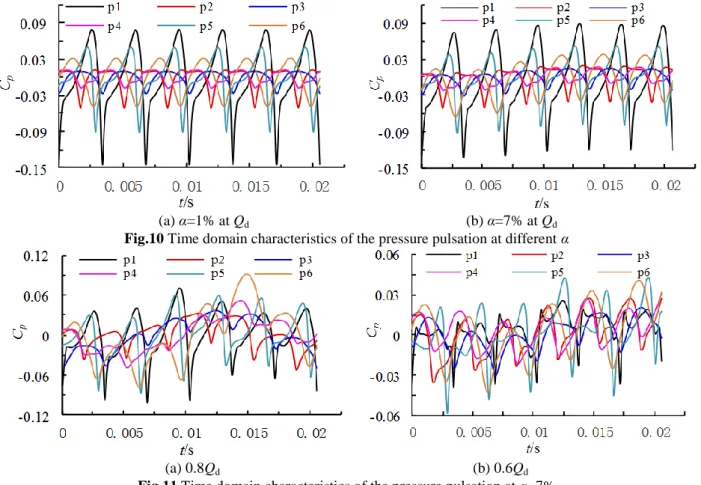
Figure 10 is a time domain plot of pressure pulsation at various monitoring points for different a. It looks the pressure pulsation coefficient values at various monitoring point exhibit periodic changes with time at different α conditions. Due to the dynamic and static interference between the impeller and the tongue, the pressure peaks at each monitoring point occur when the impeller moves for one cycle. The number is equivalent to the number of blades. The pressure fluctuations of p1 is the greatest, indicating that the flow instability is very important at this location, close to the tongue. Along the direction of the flow path of the impeller, the pressure fluctuation is smaller and smaller, along monitoring point p2, p3, and p4. The outlet pressure fluctuation of volute p6 is slightly smaller than the fluctuation of the monitoring point near the tongue. When the import a is less than 5%, the periodical regularity of pressure changes at each monitoring point is obvious. Figure 11 is a time domain diagram of pressure pulsation at various monitoring points at different flow rates when the a is 7%. Seen from it, the more deviated from the design flow conditions, the more obvious the periodic damage, and the smaller the flow, the smaller the pressure fluctuation amplitude.
(a) α=1% at Qd (b) α=7% at Qd
Fig.10 Time domain characteristics of the pressure pulsation at different α
(a) 0.8Qd (b) 0.6Qd
Fig.11 Time domain characteristics of the pressure pulsation at α=7%
Looking at Figure 12, one can see that the turbulent kinetic energy looks quasi periodic at Qd .Then, at 0.8 Qd, two adjacent
passages have got strong values, they are rotating at the same speed than the rotor. Time dependent pictures can show this (Figure 13), looking at different time steps from numerical results. These specific results can explain that unsteady pressure at p6 exhibits a strong value for rotor frequency (see Figure 14(a)). At Q=0.6 Qd, the distribution is more spread along the different blade
6
(a) 0.6Qd (b) 0.8Qd (c) Qd
Figure 12. Turbulent kinetic energy distribution in the impeller passage at α=7%
(a) time domain (b) frequency domain
Figure 13. Time and frequency domain characteristics of the pressure pulsation of monitor p6 at Qd
(a) 0.8Qd (b) 0.6Qd
Figure 14. Frequency domain characteristics of the pressure pulsation at α=7% of monitor p6
The combined effects of partial flow conditions and void fraction distribution inside the impeller (and the consequences on turbulent kinetic energy) can modify the unsteady pressure measurements when flow rate reaches 0.8 Qd. Numerical results show
exactly the same evolution for 0.8 Qd looking at Figure 10(b). It is so suspected that 0.8 Qd corresponds to the volute adapted flow
rate since it corresponds to the measured best efficiency point, whereas the initial design point was initially predicted at Qd.
5. Conclusion
Experimental overall pump performances and pump outlet pressure pulsation characteristics have been performed under air-water two phase conditions for a centrifugal geometry. Corresponding numerical simulation based on the Eulerian-Eulerian inhomogeneous two-phase model also have been processed to calculate the inner flow. Main results are the following:
1. Centrifugal pump performance is more sensitive to air in small flow condition under air water two phase inflow. The maximum air void fraction of model pump could reach 10% when the pump operates at the highest efficiency and the performances drop sharply when the air void fraction is more than 8%.
2. The dominant frequency of pump outlet pressure pulsation corresponds to the blade passing frequency even under two-phase condition. Frequency amplitude increases with the increase of inlet air void fraction. The greater of it, the more obvious of low frequency broadband characteristics appears. With the increase of inlet air void fraction, the probability density amplitude of pressure pulsation decreases gradually, and its span becomes wider gradually.
3. All above experimental results are well reproduced and partially explained using flow pattern simulated by the numerical approach.
Acknowledgments
The authors gratefully acknowledge the financial support by National Natural Foundation of China (51779107), China Postdoctoral Science Foundation Funded Project (2015M581735, 2016T90422) and Senior Talent Foundation of Jiangsu University (15JDG048).
Nomenclature
H Q a ρ Head [m]Volume flow rate [m3/h] Inlet air void fraction [%] Density of mixed fluid (kg/m3)
n P η *
Rotational speed [r/min] Shaft power
Global efficiency of the pump (%), ρgQH/P Result from FFT
References
[1] Murakami, M., and Minemura, K., 1974, “Effects of Entrained Air on the Performance of Centrifugal Pumps: 2nd Report, Effects of Number of Blades,” Bulletin of JSME, Vol. 40, No.330, pp.459-470.
[2] Chisely, E. A., 1997, “Two-phase Flow Centrifugal Pump Performance,” Dissertation Abstracts International, Volume: 58-07, Section: B, pp: 3901.
[3] Sato, S., Furukawa, A., Takamatsu, Y., 2008, “Air-water Two-Phase Flow Performance of Centrifugal Pump Impellers with Various Blade Angles,” Bulletin of the JSME, Vol. 39, No.2, pp. 223-229.
[4] Pak, E. T., and Lee, J. C., 1998, “Performance and Pressure Distribution Changes in a Centrifugal Pump under Two-phase Flow,”. Proceedings of the Institution of Mechanical Engineers. Part A. Journal of Power & Energy, Vol. 212, No.3, pp.165-171. [5] Romero, M., 1999, “An Evaluation of an Electrical Submersible Pumping System for High GOR Wells,” M.S. Thesis, University of Tulsa, USA
[6] Rui, F. P. R., 2001, “Experimental Investigation of Two-phase Flow Performance of Electrical Submersible Pump Stages,” International Journal of Quantum Chemistry, Vol.44, No.5, pp.785-794.
[7] Kosyna, G., Suryawijaya, P., and Friedrichs, J., 2001, “Improved Understanding of Two Phase Flow Phenomena Based on Unsteady Blade Pressure Measurements,” Journal of Computational & Applied Mechanics, Vol.2, No.2, pp.45-52.
[8] Sekoguchi, K., Takada S., and Kanemori, Y., 2008, “Study of Air-water Two-phase Centrifugal Pump by Means of Electric Resistivity Probe Technique for Void Fraction Measurement,” Bulletin of JSME, Vol.27, No.227, pp.931-938.
[9] Izturiz, D. L., 2007, “D_Lopez Effect of Bubble Size on an ESP Performance Handling Two-phase Flow Conditions,” M.S. Thesis, Simón Bolívar University.
[10] Barrios, L., and Prado, M. G., 2009, “Modeling Two Phase Flow Inside an Electrical Submersible Pump Stage,” Journal of Energy Resources Technology, 2009, Vol.133, No.4, pp.227-231.
[11] Neumann, M., Schäfer, T., Bieberle, A., and Hampel, U., 2016, “An Experimental Study on the Gas Entrainment in Horizontally and Vertically Installed Centrifugal Pumps. ASME Journal of Fluids Engineering, Vol.138, No.9, pp.091301-091301-9.
[12] Mikielewicz, J., Wilson, D. G., Chan, T. C., and Goldfinch, A. L., 1978, “A Method for Correlating the Characteristics of Centrifugal Pumps in Two-phase Flow,” ASME Journal of Fluids Engineering, Vol.100, No.4, pp.395-409.
[13] Furuya, O., 1985, “An Analytical Model for Prediction of Two-phase (Non-condensable) Flow Pump Performance,” ASME Journal of Fluids Engineering, Vol.107, No.1, pp. 39-147.
[14] Minemura, K., Murakami, M., and Katagiri, H., 1985, “Characteristics of Centrifugal Pumps Handling Air-water Mixtures and Size of Air Bubbles in Pump Impellers,” Transactions of the Japan Society of Mechanical Engineers Part B, Vol.28, No.244, pp.2310-2318.
[15] Sachdeva, R., 1988, “Two-pase Flow through Electrical Submersible Pumps,” Ph.D. Dissertation, The University of Tulsa, Oklahoma.
[16] Sun, D., 2004, “Modeling Gas-liquid Head Performance of Electrical Submersible Pumps,”. Journal of Pressure Vessel Technology, Vol.127, No.1, pp.31-38.
[17] Estevam, V., França, F. A., Alhannati, F. J. S., 2003, “Mapping the Performance of Centrifugal Pumps under Two-phase Conditions,” Proceedings of COBEM, 17th International Congress of Mechanical Engineering, November 10-14, 2003, Sao Paulo, SP.
[18] Barrios, L., and Prado, M. G., 2011, “Experimental Visualization of Two-phase Flow inside an Electrical Submersible Pump Stage,”. Journal of Energy Resources Technology, Vol.133, No.4, pp.453-467.
[19] Minemura, K., and Uchiyama, T., 1993, “Three-dimensional Calculation of Air-water Two-phase Flow in Centrifugal Pump Impeller Based on a Bubbly Flow Model with Fixed Cavity,” Jsme International Journal.ser.b Fluids & Thermal Engineering, Vol.37, No.2, pp.726-735.
[20] Caridad, J., Kenyery, F., 2004, “CFD Analysis of Electric Submersible Pumps (ESP) Handling Two-phase Mixtures,” Journal of Energy Resources Technology, Vol.126, No.2, pp.99-104.
[21] Clarke, A. P., and Issa, R. I., 1995, “Numerical Prediction of Bubble Flow in a Centrifugal Pump,” Multiphase Flow1995, pp.175-181.
[22] Noghrehkar, G. R., Kawaji, M., Chan, A. M. C., Nakamura, H., and Kukita, Y., 1995, “Investigation of Centrifugal Pump Performance under Two-phase Flow Conditions. Journal of Fluids Engineering, Vol.117, No.1, pp.129-137.
[23] Müller, T., Limbach, P., and Skoda, R., 2015, “Numerical 3D RANS Simulation of Gas-liquid Flow in a Centrifugal Pump with an Euler-Euler Two-Phase Model and a Dispersed Phase Distribution,”. European Turbomachinery Conference.
[24] Si, Q. R., Cui, Q. L., Zhang, K. Y., Yuan, J. P., Bois, G., 2018, “Investigation on Centrifugal Pump Performance Degradation under Air-Water Inlet Two-Phase Flow Conditions,” La Houille Blanche, No.3, pp.41-48.
[25] Si, Q. R., Bois, G., Zhang, K. Y., Yuan, S. Q., 2017, “Air-water Two-Phase Flow Experimental and Numerical Analysis in a Centrifugal Pump,” Proceedings of 12th European Conference on Turbomachinery Fluid Dynamics and Thermodynamics,