Science Arts & Métiers (SAM)
is an open access repository that collects the work of Arts et Métiers Institute of Technology researchers and makes it freely available over the web where possible.
This is an author-deposited version published in: https://sam.ensam.eu Handle ID: .http://hdl.handle.net/10985/18206
To cite this version :
Kwame ANANE-FENIN, Esther Tililabi AKINLABI, Nicolas PERRY - A Numerical And Statistical Approach For Optimization Of Tab Design For Non-Crimp Fabric Composites - Procedia Manufacturing - Vol. 35, p.820-825 - 2019
Any correspondence concerning this service should be sent to the repository Administrator : [email protected]
A Numerical and Statistical Approach for Optimization of
Tab Design for Non-Crimp Fabric Composites
K. Anane-Fenin
a*, E. T. Akinlabi
a, N. Perry
baDepartment of Mechanical Engineering Science, University of Johannesburg, South Africa bArts et Metiers ParisTech, CNRS, 12M Bordeaux, Esplanade des Arts et Metiers, France
Abstract
In standard practice, testing of composites in tension requires the use of stress inducing serrated grips. The low transverse compressive strength of unidirectional non-crimp fabric composites limits the application of high clamping forces. Tabs are therefore essential as they ensure a reduction in grip pressure transmission, surface damage and induced stress damage. Tabs, however, tend to introduce induced stress concentrations at the tab termination region. The objective of this study was to minimise stress concentration by varying tab design configurations to determine the optimal design most suitable for tensile testing of non-crimp fabric composites using finite element and statistical tools. Finite element models generated from experimental data were used for accessing the stress concentrations. A two (2)-level full factorial design was adopted and utilised for statistical analysis. Results revealed that tab stiffness, tab taper angle, adhesive thickness and manufacturing process (bonded or molded) were statistically significant for minimising stress concentration. molded tabs were found to be acceptable if the stiffness of tab was significantly lower than test specimen. The optimal configuration derived from the multiple response optimisation was tab stiffness (20 Gpa), tab Thickness (0.5 mm), tab length (50 mm), tab taper angle (5o) and adhesive thickness (1.5 mm).
Keywords: Composite desirability. Factorial design. Finite element • Response optimization • Tab • Stress concentration
1. Introduction
In the mechanical characterisation of materials, tensile testing is one of the primary techniques utilised to determine critical in-plane properties such as the modulus of elasticity. During the process of experimental setup, both ends of coupons are clamped with serrated grips to prevent slippage during testing. The grips also provide the axial loading required for testing through grip friction and the applied shear force [1-3]. For metals and several materials, testing is carried out without the need for an intermediate medium between grips and test specimen. However, for composites such as non-crimp fabrics which tend to have very low transverse compressive stress, tabs are essential for accurate testing [1,2]. The use of bonded tabs offers several advantages namely; high grip forces can be accommodated, and coarse grips which are required for friction can be used without the negative effects of surface damage and out-of-plane stress-induced damage. It must, however, be noted that while tabs are
recommended as standard practice, its use, unfortunately, creates the problem of high-stress concentrations at tab termination regions of test specimen during tensile and compressive testing [2]. As a result of these induced stresses, Hart-Smith [4] concludedthat although tab usage is the standard, they may not necessarily be better depending on the test specimen.
Premature failure or a significant reduction in tensile properties such as measured stress and strain failures are directly linked to localized stress concentrations induced by tabs at the ends. For standardized tensile testing, ASTM 3039/D3039M-08 [5] recommends tapered tabs while ASTM5083-10 [6] and ISO 527-5 [7] propose the use of prismatic tabs. In a study conducted by Hojo et al. [8] on 10o tapered and squared tabs, no significant difference was observed with regards to the tensile strength. Belingardi et al. [9] observed that there was a significant difference in tensile strength resulting from the presence of residual stresses when coupons were molded with tabs. A 30o bevel shaped tab design was recommended as it had lower stress concentration factor and hence a higher tensile strength when compared with 90o bevel angled tabs. Results from [2, 10, 11] showed that tab geometry affected the intensity of the stress concentration and recommended optimised tab designs. A study by De Baere et al. [12], concluded that although, finite element results from chamfered glass epoxy tab gave the lowest stress concentrations, the problem of premature failure due to poor bonding between test specimen and tab still existed. Therefore, straight ended tabs were recommended. Winsom et al. [13-15] designed a unidirectional test specimen manufactured by symmetrical ply drop-offs to create a taper. Although this reduced stress concentration, end tabs or emery paper were still used for protection from grips. Recent studies by Czel et al. [16], focused on the total elimination of stress concentration by designing unidirectional interlayered hybrid carbon-glass epoxy composites that do not require the use of tabs. Although, these new approaches for stress concentration elimination are available, tab ended testing is the most standardised and often used. The study by [2] concentrated on only bonded tabs and the use of finite element analysis to determine stress concentrations while [9] worked on both bonded and molded tabs however, their work was only experimental and had no finite element component for the assessment of stress concentrations. None of the the following studies [2, 8-16] used statistics to clearly define the optimal design configuration and significance of the design factors. This study provides a simple methodology that is material specific for optimising tab designs.
Available literature on bonded or molded tabs is scanty. It is an area that is often glossed over when discussing tensile testing of specimen. Therefore, the purpose of this study is to conduct finite element analysis for both bonded and molded tabs and apply statistical tools in determining the most significant tab design configuration suitable for minimising the stress concentrations. Furthermore, multiple response optimization using the desirability approach was conducted for the tab design variables which include material stiffness, tab thickness, tab length, tab angle, adhesive thickness and manufacturing process.
2. Materials and Methods
A 4-step approach was designed for this study. Tensile testing in accordance with ASTM D3039 was initially conducted to determine elastic properties. The experimental results were then used as baseline inputs for finite element modelling. A full 2-level full factorial design was adopted for statistical analysis of normalised stress concentrations derived from the finite element analysis. The main factors were generated and further finite element analysis conducted on these factors to determine the stress concentration behaviour. Finally, a multiple response optimisation approach is used for design optimisation.
1.1 Specimen Material
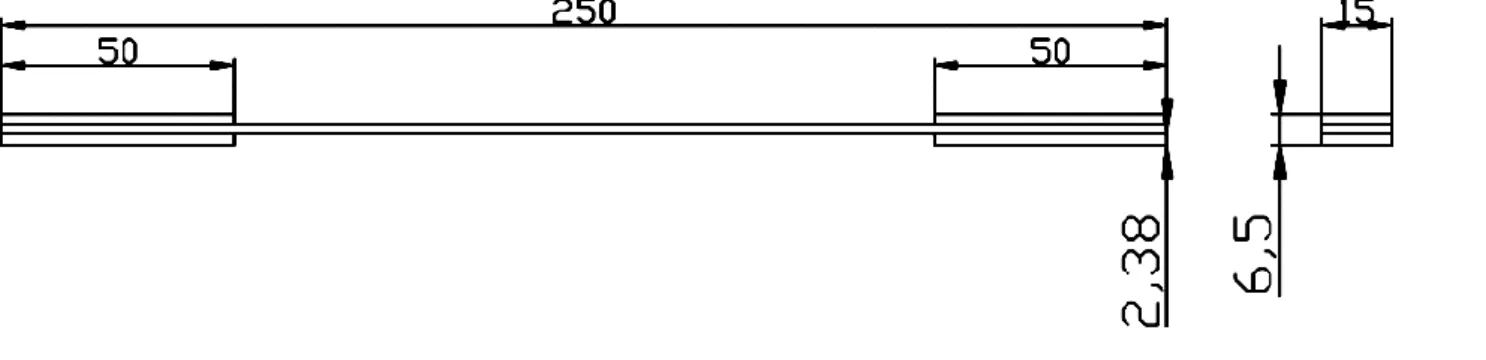
Unidirectional non-crimp fabric composite plate from Chomarat were cut to specimen of 0o and 10o fiber orientations and used for experimentation. Tensile testing according to ASTM D D3039 standard was conducted on the specimen to derive the elastic properties. Rectangular tabs were fabricated from G-10 glass/epoxy and bonded to the specimen using Hysol 907 two-part paste adhesive. The test specimen dimensions are shown in Figure 1.
Figure 1 Dimensions of test specimen
1.2 Experimental Setup
The MTS Alliance RF/100 Tensile machine with a capacity of 100 kN and crosshead speed of 2 mm/min was used in conducting the experimentation. The 0o and 10o specimen were tested using bonded strain gauges with configurations 0o/90o and 0o/45o/90o respectively as shown in Figure 2 and Figure 3.
1.2.1 The 0
ounidirectional Tensile Testing
A 0o/90o Vishay CEA-06-125 UT-120 strain gauge was used for the measurement of strains within the 0o unidirectional specimen as illustrated in Figure 2. The strain gauge was used in measuring the longitudinal (
𝜀
1) and transverse (𝜀
2) strains aid in the derivation of the Young’s modulus (direction fibre) 𝐸𝑥 and Poisson’s ratio 𝑉𝑥 from the stress-strain curve. The 0o implies the following simplified equation (1) can be used:[𝜎] = [ 𝜎1 0 0 ] ; [𝜎′] = [ 𝜎𝑥 = 𝜎1 0 0 ] ; [𝜀] = [ 𝜀1 𝜀2 0 ] , [𝜀′] = [ 𝜀𝑥 = 𝜀1 𝜀𝑦= 𝜀2 0 ]………(1)
Where [𝜎] = Stress in specimen direction, [𝜎′] = stress in fibre direction of material, [𝜀] ==Strain in specimen direction and [𝜀′] = strain in fibre direction of material.
Figure 2 0o tensile test specimen
1.2.2 The 10
oOff-Axis Shear Tensile Test
The determination of inter-laminar shear strength is difficult and not a straight forward process. Some of the shear strength characterisation tests available include; 10o off-axis, Isoipescu, Torsional tube, Slotted Tensile, ±45o Tensile, Two-rail, Cross beam sandwich, Picture-frame panel and Arcan tests. However, the 10o off-axis and Iosipescu shear tests are mostly preferred due to the ease of specimen fabrication and testing low cost, and accuracy of shear strength values [17,18]. Chamis and Sinclair [19] were first to propose the 10o off-Axis method. The fundamental basis for this test requires the application of uniaxial tension to unidirectional composites specimen with fibre oriented at 10o to ensure that at failure the shear stress (𝜎𝑠) is closest to its critical value as expressed in the equations (2);
𝜎𝑥= 𝐹𝑐𝑜𝑠2𝜃 𝐴 ; 𝜎𝑦= 𝐹𝑠𝑖𝑛2𝜃 𝐴 ; 𝜎𝑠= 𝐹𝑠𝑖𝑛2𝜃 2𝐴 ……….(2)
Where θ = 10o, F = Global applied load and A = Specimen Cross-section [19].
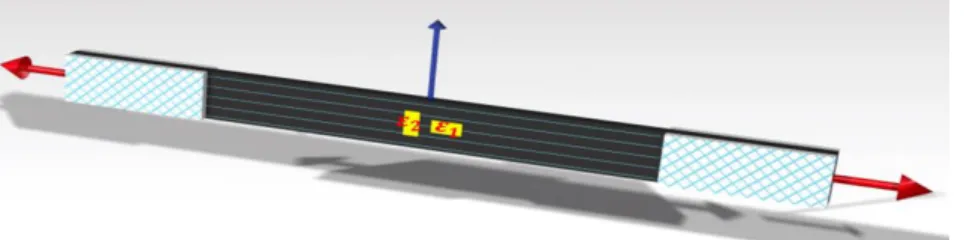
A 0o/45o/90o Vishay CEA-066-125 UR-120 rosette strain gauge was used to measure the shear modulus. The measurement of three strains
𝜀
1, 𝜀
2and
𝜀
3 shown in Figure 3a and Figure 3b … makes is it possible to calculate the shear strains. The shear stress (𝜎𝑠) is obtained from the load measurement during the tensile testing while the shear strength was derived from the shear curve. The equations used for transforming the measured strains from the strain gauge are presented in (3) –(6).𝜎𝑠= −𝜎1𝑐𝑜𝑠𝜃𝑠𝑖𝑛𝜃………...(3) ε450 =ε1+ε2 2 + ε1−ε2 2 cos(2α)………(4) ε6 = 2ε450− (ε1+ ε2)……….(5) Where 𝛼 = 45o; 𝜎
𝑠 = shear stress;
𝜀
1, 𝜀
2and
𝜀
45° are measurements from the strains: The field strains in the material direction are deduced as:[ εx εy εs ] = [ m2 n2 mn n2 m2 −mn −2mn 2mn −n2 ] [ ε1 ε2 ε6
], where m=cosθ, n=sinθ with θ=10o………(6)
(a) (b)
Figure 3a and 3b Bonded strain gauge configuration (0o/45o/90o)
1.3 Finite Element Analysis
Finite element analysis is an essential tool for stress analysis through modelling. The stress within the tabs, adhesive bond and the test specimen, can be conveniently assessed and analysed. ANSYS APDL Mechanical 18 was used to investigate the stress concentrations induced at the regions. All stress concentration results were normalized.
Specimen A and B described in Figure 3 have a constant width and therefore can be analysed using a two-dimensional, model. Two main approaches can be adopted namely; the plain strain or the plain stress assumptions. he plain stress assumption 𝜎𝑧= 𝜏𝑥𝑧= 𝜏𝑦𝑧 = 0 is however preferred for surfaces and edges of the specimen are critical. For composite materials, this assumption is often recommended because it encapsulates most of the specimen’s volume [2]. The finite element model was simplified by use of symmetry which gives a quarter of the specimen also shown in Figure 3.
Figure 3 Finite element model configurations
For grip simulation, [12] developed an elaborate equation (1) which described the relationship between the tensile load applied on specimen (𝐹), plunger load (𝑅𝑎) and grip force (𝑃).
𝑃 =
𝐹 cos 𝛼 − 𝜇
𝐵𝐶sin 𝛼
2 sin 𝛼 + 𝜇
𝐵𝐶cos 𝛼
+ 𝑅
𝐴(1 − 𝜇
𝐴𝐶𝜇
𝐵𝐶) cos 𝛼 − (𝜇
𝐵𝐶− 𝜇
𝐴𝐶) sin 𝛼
sin 𝛼 + 𝜇
𝐵𝐶cos 𝛼
… … … . . (7)
A much simpler approach is presented in [20] and well suited for this study. The simulation of tab gripping requires the introduction of both normal gripping traction (Py) and shear traction (Pxy) on the surface of the tab. The simple expressions in (8) and (9) below were used in determining the normal (Fy) and shear forces (Fxy) applied, where the coefficient of friction is µand grip taper angle is Ø:𝑃𝑥𝑦 𝑃𝑦 = 𝐹𝑥𝑦 𝐴𝑡𝑎𝑏 𝐹𝑦 𝐴𝑡𝑎𝑏 =𝐹𝑥𝑦 𝐹𝑦 = tan(tan−1(𝜇) + ∅) … … … (8) 𝜇 = 0.06, ∅ = 15𝑜 𝑃𝑥𝑦 𝑃𝑦 =𝐹𝑥𝑦 𝐹𝑦 = 0.33 … … … . . (9) To ensure simplicity, all finite element analyses were conducted using linear elastic analyses. The 8 node 183 element in ANSYS was used for meshing. To minimize errors the adhesive region was meshed with double layered elements through thickness with aspect ratios not greater than 2:1. Two variations of finite element models were designed, namely glued or adhesively bonded tabs and molded tabs as shown in Figures 4a and 4b. The material properties for the NCF composite, tab and adhesive are summarized in Table 1.
(a) (b)
Figure 4(a) is meshing for bonded tabs, (b) meshing for molded tabs
Table 1. Material input for finite element analysis
*Source [2]
Material Properties UD glass NCF-epoxy Tab Material (G-10 glass fabric-epoxy) * Two-part Adhesive*
Ex (GPa) 132 20 3.17 Ey (GPa) 10 6.9 Ez (GPa) 10 6.9 Vxy 0.307 0.06 0.31 Vyz 0.307 0.06 Vxz 0.307 0.06 Gxy (GPa) 6.5 3.45 Gyz (GPa) 66 10 Gxz (GPa) 6.5 3.45
3. Results
1.4 Experimental Results
Tensile testing experimentation was successfully carried out on 0o and 10o specimen for in-plane characterization of the non-crimp fabric composite material. The stress-strain and shear stress-shear strain curves are presented in Figures (5 and 6) and Figure (7) respectively. The 10o interlaminar shear failure is shown in Figure 8. The in-plane properties derived are summarised in Table 2.
Figure 5 Stress-strain curve for 0o test specimen Figure 6 Stress-strain curve for 10o test specimen
Figure 7 Shear stress-shear strain curve Figure 8 10o Shear failure
Table 2. Elastic properties of E-glass Non-crimp fabric composite
Composite Fibre Volume Fraction (%) Ex (GPa) Gxy (Gpa) Vxy
UD-Glass/Epoxy NCF 71 132 7.5 0.307
1.5 Finite Element Results and Statistical results
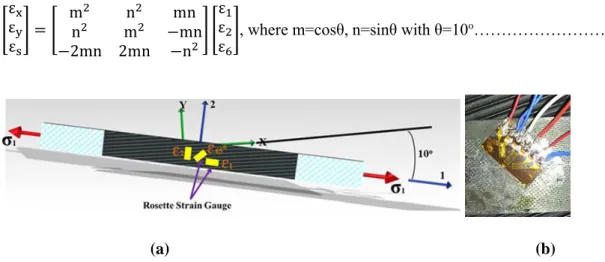
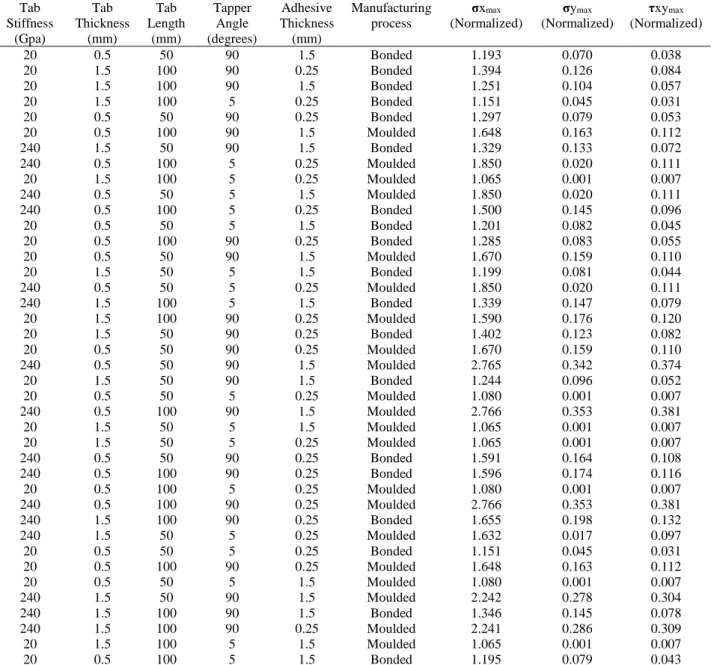
After conducting 64 simulations for a full factorial 2-level six-factor design, the normalized stress concentrations are summarized in Table 3. The design factors were Tab stiffness, Tab thickness, Tab length, Tab taper angle, Adhesive Thickness and manufacturing process (bonded or molded). Further
-500 0 500 1000 1500 2000 2500 -10000 -5000 0 5000 10000 15000 20000 Str e ss σ1(M p a) Strain (μm) Strain gauge ɛ1 Strain gauge ɛ2 -50 0 50 100 150 200 250 300 350 400 -4000 -2000 0 2000 4000 6000 8000 Str e ss σ 1 (M p a) Strain (μm) Strain gauge (ε1) Strain gauge (ε45 Deg.) Strain gauge (ε2) -10 0 10 20 30 40 50 60 -5000 0 5000 10000 15000 20000 25000 Sh e ar Str e ss σ s (M p a) Shear Strain εs (μm) Es = 7.5 Gpa
simulations were conducted on the statistically significant factors to determine the stress concentration behaviours. The results from these analysis are summarised Table 3. Figure 9 is a finite element solution showing the location if the maximum stress concentrations.
Figure 9 Finite element result showing the location of maximum stressconcentration
Table 3. 2-level factorial design.
Tab Stiffness (Gpa) Tab Thickness (mm) Tab Length (mm) Tap Tapper Angle (degrees) Adhesive Thickness (mm) Manufacturing process σxmax (Normalized) σymax (Normalized) τxymax (Normalized) 20 0.5 50 90 1.5 Bonded 1.193 0.070 0.038 20 1.5 100 90 0.25 Bonded 1.394 0.126 0.084 20 1.5 100 90 1.5 Bonded 1.251 0.104 0.057 20 1.5 100 5 0.25 Bonded 1.151 0.045 0.031 20 0.5 50 90 0.25 Bonded 1.297 0.079 0.053 20 0.5 100 90 1.5 Moulded 1.648 0.163 0.112 240 1.5 50 90 1.5 Bonded 1.329 0.133 0.072 240 0.5 100 5 0.25 Moulded 1.850 0.020 0.111 20 1.5 100 5 0.25 Moulded 1.065 0.001 0.007 240 0.5 50 5 1.5 Moulded 1.850 0.020 0.111 240 0.5 100 5 0.25 Bonded 1.500 0.145 0.096 20 0.5 50 5 1.5 Bonded 1.201 0.082 0.045 20 0.5 100 90 0.25 Bonded 1.285 0.083 0.055 20 0.5 50 90 1.5 Moulded 1.670 0.159 0.110 20 1.5 50 5 1.5 Bonded 1.199 0.081 0.044 240 0.5 50 5 0.25 Moulded 1.850 0.020 0.111 240 1.5 100 5 1.5 Bonded 1.339 0.147 0.079 20 1.5 100 90 0.25 Moulded 1.590 0.176 0.120 20 1.5 50 90 0.25 Bonded 1.402 0.123 0.082 20 0.5 50 90 0.25 Moulded 1.670 0.159 0.110 240 0.5 50 90 1.5 Moulded 2.765 0.342 0.374 20 1.5 50 90 1.5 Bonded 1.244 0.096 0.052 20 0.5 50 5 0.25 Moulded 1.080 0.001 0.007 240 0.5 100 90 1.5 Moulded 2.766 0.353 0.381 20 1.5 50 5 1.5 Moulded 1.065 0.001 0.007 20 1.5 50 5 0.25 Moulded 1.065 0.001 0.007 240 0.5 50 90 0.25 Bonded 1.591 0.164 0.108 240 0.5 100 90 0.25 Bonded 1.596 0.174 0.116 20 0.5 100 5 0.25 Moulded 1.080 0.001 0.007 240 0.5 100 90 0.25 Moulded 2.766 0.353 0.381 240 1.5 100 90 0.25 Bonded 1.655 0.198 0.132 240 1.5 50 5 0.25 Moulded 1.632 0.017 0.097 20 0.5 50 5 0.25 Bonded 1.151 0.045 0.031 20 0.5 100 90 0.25 Moulded 1.648 0.163 0.112 20 0.5 50 5 1.5 Moulded 1.080 0.001 0.007 240 1.5 50 90 1.5 Moulded 2.242 0.278 0.304 240 1.5 100 90 1.5 Bonded 1.346 0.145 0.078 240 1.5 100 90 0.25 Moulded 2.241 0.286 0.309 20 1.5 100 5 1.5 Moulded 1.065 0.001 0.007 20 0.5 100 5 1.5 Bonded 1.195 0.079 0.043
20 1.5 50 5 0.25 Bonded 1.151 0.045 0.031 240 0.5 100 90 1.5 Bonded 1.313 0.130 0.070 240 0.5 100 5 1.5 Bonded 1.328 0.142 0.077 20 0.5 100 5 0.25 Bonded 1.151 0.045 0.031 240 1.5 100 5 1.5 Moulded 1.632 0.017 0.097 20 0.5 100 90 1.5 Bonded 1.197 0.076 0.042 20 1.5 50 90 0.25 Moulded 1.603 0.174 0.118 240 0.5 50 5 1.5 Bonded 1.338 0.147 0.079 240 1.5 50 5 0.25 Bonded 1.505 0.149 0.098 240 1.5 100 90 1.5 Moulded 2.241 0.286 0.309 240 1.5 50 90 0.25 Bonded 1.651 0.191 0.127 240 1.5 50 5 1.5 Bonded 1.342 0.148 0.080 20 0.5 100 5 1.5 Moulded 1.080 0.001 0.007 240 1.5 50 5 1.5 Moulded 1.632 0.017 0.097 240 0.5 50 90 0.25 Moulded 2.765 0.342 0.374 240 0.5 100 5 1.5 Moulded 1.850 0.020 0.111 240 0.5 50 5 0.25 Bonded 1.501 0.148 0.098 240 1.5 100 5 0.25 Moulded 1.632 0.017 0.097 20 1.5 100 5 1.5 Bonded 1.198 0.080 0.044 240 1.5 100 5 0.25 Bonded 1.505 0.149 0.098 20 1.5 50 90 1.5 Moulded 1.603 0.174 0.118 240 0.5 50 90 1.5 Bonded 1.299 0.119 0.064 240 1.5 50 90 0.25 Moulded 2.242 0.278 0.304 20 1.5 100 90 1.5 Moulded 1.590 0.176 0.120
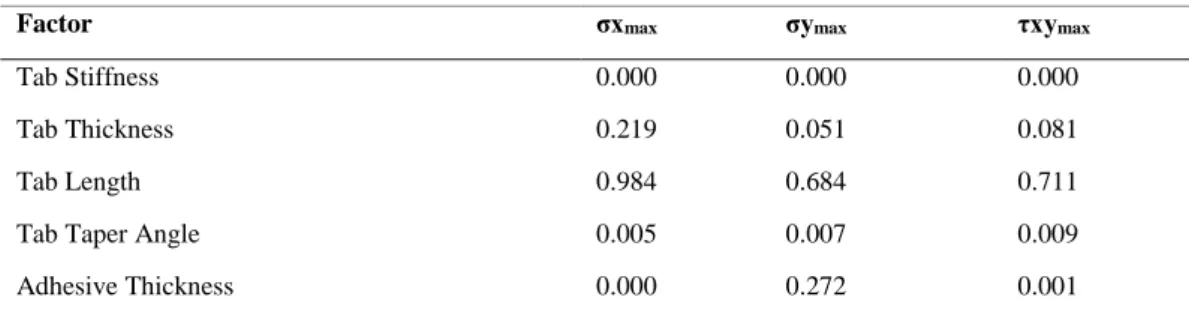
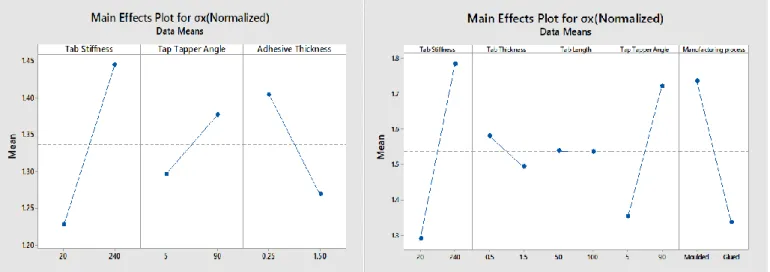
Analysis of variance (ANOVA) was used to determine the main factors influencing stress concentration and their significant levels. The P-values derived are presented in Table 4 and Table 5. Graph plots of the main effects influencing stress concentrations for bonded and molded tabs are presented in Figure 9 and Figure 10. Further finite element analysis were conducted on the significant or main effects and results presented in Figures 11 - 14.
Table 4. P-values for stress concentrations in bonded tabs
Factor σxmax σymax τxymax
Tab Stiffness 0.000 0.000 0.000
Tab Thickness 0.219 0.051 0.081
Tab Length 0.984 0.684 0.711
Tab Taper Angle 0.005 0.007 0.009
Adhesive Thickness 0.000 0.272 0.001
Table 5. P-values for stress concentrations in bonded and molded tabs
Factor σxmax σymax τxymax
Tab Stiffness 0.000 0.000 0.000
Tab Thickness 0.165 0.973 0.737
Tab Length 0.977 0.851 0.900
Tab Taper Angle 0.000 0.000 0.000
Figure 9 Main Effect Plot for bonded tabs Figure 10 Main Effect Plot for bonded and molded tabs
Figure 11 Effect of Tab stiffness on stress concentration Figure 12 Effect of taper angle on stress concentration
Figure 13 Influence of Adhesive thickness on stress concentration Figure 14 Situations when molded tabs are acceptable
1.5.1 Response optimization
Composite desirability (D) is an evaluating tool for assessing the best optimal settings for a set of responses. The fundaments basis of this optimisation process was introduced by Derringer and Suich
0.020 0.040 0.060 0.080 0.100 0.120 0.140 1.120 1.170 1.220 1.270 1.320 1.370 1.420 0 50 100 150 200 250 σy (No rm a li ze d ) τx y (No rm a li ze d ) σx (No rm a li ze d ) Tab Stiffness σx (Normalized) σy (Normalized) τxy (Normalized) 0.040 0.060 0.080 0.100 0.120 0.140 0.160 0.180 1.200 1.250 1.300 1.350 1.400 1.450 1.500 1.550 1.600 0 20 40 60 80 100 σy (No rm a li ze d ) τx y (No rm a li ze d ) σx (No rm a li ze d )
Tab Taper Angle
σx(Normalized) σy(Normalized) τxy(Normalized) 0.035 0.040 0.045 0.050 0.055 0.060 0.065 0.070 0.075 1.100 1.150 1.200 1.250 1.300 1.350 1.400 0 0.5 1 1.5 σy (N o rm a lize d ) τx y (No rm a li ze d ) σx (N o rmal iz ed ) Adhesive Thickness σx(Normalized) σy(Normalized) τxy(Normalized) Molded (lower tab mechanical properties) Molded (same material for tab
and test specimen) Bonded Series1 1.065 1.233 1.151 0.95 1 1.05 1.1 1.15 1.2 1.25 σx (No rm a li ze d )
[21]. The desirability value lies between zero (0) and one (1) for which a value close to 1 is an indication of approaching acceptable responses from settings. The purpose of this optimization was to minimize the stress concentration induced (response) in the tab termination region, generate individual desirability’s as shown in (10) to (12) and lastly derive the composite desirability as in equations (13) and (14). The parameters used for optimization are presented in Table 6 and the optimization result is shown in Table 7. The visual representation of the response optimization is shown in Figure 15. 𝑑𝑖= 0 𝑦̂ < 𝐿𝑖 𝑖… … … (10) 𝑑𝑖= ( (𝑈𝑖− 𝑦̂)𝑖 (𝑈𝑖− 𝑇𝑖) ) 𝑟𝑖 𝑇𝑖 ≤ 𝑦̂ ≤ 𝑈𝑖 𝑖… … … (11) 𝑑𝑖= 1 𝑦̂ < 𝑇𝑖 𝑖… … … . (12)
The composite desirability which is the weighted geometric mean of all the individual desirabilities is calculated as:
𝐷 = (∏(𝑑𝑖𝑤𝑖)) 1 𝑊
… … … (13) For cases where all responses have the same importance, the desirability is calculated as: 𝐷 = (𝑑1× 𝑑2× … × 𝑑𝑖) 1 𝑛… … … (14) Where: 𝑑𝑖= 𝑖𝑛𝑑𝑖𝑣𝑖𝑑𝑢𝑎𝑙 𝑑𝑒𝑠𝑖𝑟𝑎𝑏𝑖𝑙𝑖𝑡𝑦 𝑓𝑜𝑟 𝑡ℎ𝑒 𝑖𝑡ℎ 𝑟𝑒𝑠𝑝𝑜𝑛𝑠𝑒 𝐷 = 𝑐𝑜𝑚𝑝𝑜𝑠𝑖𝑡𝑒 𝑑𝑒𝑠𝑖𝑟𝑎𝑏𝑖𝑙𝑖𝑡𝑦 𝐿𝑖 = 𝑙𝑜𝑤𝑒𝑠𝑡 𝑎𝑐𝑐𝑒𝑝𝑡𝑎𝑏𝑙𝑒 𝑣𝑎𝑙𝑢𝑒 𝑓𝑜𝑟 𝑖𝑡ℎ 𝑟𝑒𝑠𝑝𝑜𝑛𝑠𝑒 𝑛 = 𝑛𝑢𝑚𝑏𝑒𝑟 𝑜𝑓 𝑟𝑒𝑠𝑝𝑜𝑛𝑠𝑒𝑠 𝑟𝑖 = 𝑤𝑒𝑖𝑔ℎ𝑡 𝑜𝑓 𝑑𝑒𝑠𝑖𝑟𝑎𝑏𝑖𝑙𝑖𝑡𝑦 𝑓𝑢𝑛𝑐𝑡𝑖𝑜𝑛 𝑜𝑓 𝑖𝑡ℎ 𝑟𝑒𝑠𝑝𝑜𝑛𝑠𝑒 𝑇𝑖 = 𝑡𝑎𝑟𝑔𝑒𝑡 𝑣𝑎𝑙𝑢𝑒 𝑜𝑓 𝑖𝑡ℎ 𝑟𝑒𝑠𝑝𝑜𝑛𝑠𝑒 𝑈𝑖 = ℎ𝑖𝑔ℎ𝑒𝑠𝑡 𝑎𝑐𝑐𝑒𝑝𝑡𝑎𝑏𝑙𝑒 𝑣𝑎𝑙𝑢𝑒 𝑓𝑜𝑟 𝑖𝑡ℎ 𝑟𝑒𝑠𝑝𝑜𝑛𝑠𝑒 𝑤𝑖 = 𝑖𝑚𝑝𝑜𝑟𝑡𝑎𝑛𝑐𝑒 𝑜𝑓 𝑖𝑡ℎ 𝑟𝑒𝑠𝑝𝑜𝑛𝑠𝑒 𝑊 = 𝑠𝑢𝑚 𝑜𝑓 𝑤𝑖𝑜𝑟 ∑ 𝑤𝑖 𝑦̂ = 𝑃𝑟𝑒𝑑𝑖𝑐𝑡𝑒𝑑 𝑣𝑎𝑙𝑢𝑒 𝑜𝑓 𝑖𝑖 𝑡ℎ 𝑟𝑒𝑠𝑝𝑜𝑛𝑠𝑒
Table 6. Optimization Parameters
Response Goal Target Upper Weight Importance τxy (Norm) Minimum 0.00728 0.38079 1 1
σy (Norm) Minimum 0.00131 0.35278 1 1
σx (Norm) Minimum 1.06457 2.76636 1 1
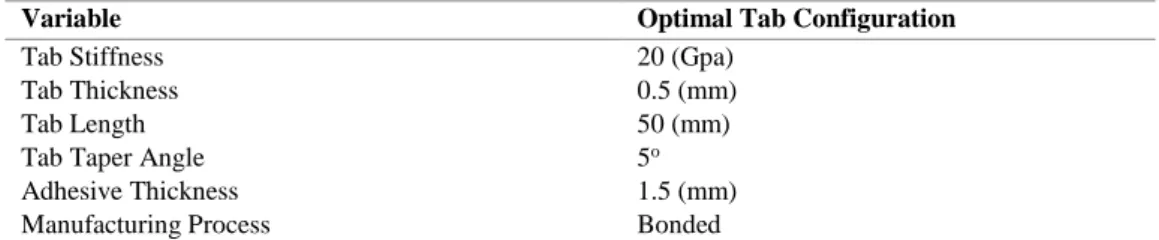
Table 7. Multiple Response Prediction (Optimized configuration)
Variable Optimal Tab Configuration
Tab Stiffness 20 (Gpa)
Tab Thickness 0.5 (mm)
Tab Length 50 (mm)
Tab Taper Angle 5o
Adhesive Thickness 1.5 (mm)
Figure15 optimization plot
4. Discussion
The longitudinal young’s modulus (𝐸𝑥) of 132 GPa and the shear modulus (𝐺𝑥𝑦) of 7.5 GPa were derived from the slope of the linear portions of the stress-strain curve (Figures 5) and shear stress-shear strain curves (Figure 7) respectively. The summary of material’s in-plane properties are presented in Table 2 and were used as inputs for the finite element models as shown in Table 1. The fractured specimen from the 10o off-axis test clearly shows that failure due to shearing occurred at the 10o fibre orientation and by using 0o/45o/90o strain gauges as shown in Figure 8.
The results in Table 3 represent 64 simulations from finite element analysis for bonded and molded tabs using a 2-level full factorial design. Analysis of Variance (ANOVA) was used to derive P-values for determining the significance of the design variable as summarised in Tables 4 and 5. A factor is significant if the P-value <0.05 From Table 4, the most statistically significant factors for bonded tabs were tab stiffness, adhesive thickness and tab taper angle with P-values of 0.000, 0.001 and 0.009 respectively. The main effect graph is shown in Figure 9. The main effect plot displays the nature of the significance by the orientation of the line. A horizontal line indicates no main effects while a non-horizontal line represents the presence of main effects. The magnitude of the main effect corresponds to how steep the line is. The interaction effects were found to be insignificant, and therefore the plots could be used for interpreting the main effect. The most influencing factors for bonded tabs in
descending order were tab stiffness > adhesive thickness > tab taper angle. Table 5 presents the P-values of factors that significantly influence stress concentration when bonded and molded tabs are considered. The most statistically significant factors were tab stiffness, tab taper angle and manufacturing process with corresponding P-values of 0.000 each. From Figure 10 it is observed that the most influencing effects are tab stiffness > manufacturing process > tab taper angle.
Further finite element analysis was conducted on the significant factors to investigate the behaviour of the three (3) stress concentrations 𝜎𝑥, 𝜎𝑦 and 𝜏𝑥𝑦. The baseline configuration used were tab stiffness (20 GPa), tab thickness (0.25 mm), tab length (50 mm), tab taper angle (5o) and adhesive thickness (0.25 mm). However, each significant factor was varied within a minimum and maximum range when they were under consideration. In Figure 8, the effect of tab stiffness on the three stress concentrations increased with increment in tab stiffness. Therefore, low tab stiffness is an indication of how compliant the material is and an important factor for minimising stress concentration. There must, however, be a compromise between material compliance and strength to ensure that tab is capable of transmitting grip load to test specimen. The tab stiffness was varied from 20 to 240 GPa. The G-10 glass-epoxy tabs were compliant enough for minimising the stress concentrations at the tab termination region. These findings are supported in literature by [2,22].
Geometry is an important factor to consider when minimisation of stress concentration is the main objective. The results from the finite element analysis shown in Figure 9 reveals that all three stress concentrations increased with increasing tab taper angle when it was varied from 5o to 90o. This outcome is supported in literature by [2,9]. A small taper angle is therefore recommended. It must be noted that if the tapered region is not gripped and therefore a combination of the peel stress (𝜎𝑦) and shear stress (𝜏𝑥𝑦) within the adhesive can cause premature failure as the taper angle decreases. Several studies including [2,9,22] have suggested 10o to 30o taper angle as the most practical for ease of manufacture. In Figure 10, the adhesive thickness was varied from 0.25mm to 1.5 mm, and the behaviour of the stress concentrations plotted. The normal stress concentration (𝜎𝑥) reduces significantly as adhesive thickness increases. The slight increase in the peel stress (𝜎𝑦) may be attributed to the taper geometry which tend to increase peel stress within the adhesive. The shear stress (𝜏𝑥𝑦) was relatively constant.
The manufacturing process as seen in Table 5 is statistically significant in minimising stress concentration. The two approaches considered were bonding with adhesive and molding tabs with the specimen. From the main effect plot (Figure 7) and Table 7, the computed best option was the bonded tabs. This conclusion is the same as those established in [9]. The study conducted by [9] was on tabs and test specimen made from the same material and therefore have the same stiffness. The use of same material for tab and specimen may have accounted for the high-stress concentrations at the tab termination regions which led to premature failures. The conclusion that molded tabs are unsuitable as presented by [9] is challenged in this study. From Figure 11, it is observed that molded tabs with
significantly lower stiffness than the test specimen gave the lowest stress concentrations while on the average bonded tabs were the most suitable. Therefore, this study proposes that in general bonded tabs are most suitable but molded tabs may be considered only when their stiffness is lower than the test specimen’s.
Tab thickness and tab length were not statistically significant having P-values of 0.737 and 0.900 respectively as shown in Table 5. The implication of the P-values is that tab thickness ranging from 0.5 to 1.5 mm are acceptable. In standard practice, the selected tab thickness is often 1 to 4 times the test specimen thickness to ensure tab strength capable of withstanding grip loads. A minimum of 0.5mm is recommended [2,19]. The P-value for tab length also indicates that any length ranging from 50mm to 100mm is acceptable. Tab length corresponding to the length of the grips is recommended by [12]. Response optimisation aims at deriving the composite desirability close to 1. The combination of design variables which contributes to the best composite desirability is selected as the optimal design. Table 6 is the parametric input conditions required for minimising all three (3) stress conditions. Minitab 17 was used to run the multiple response optimizations to obtain the optimal design presented in Table 7. Although tab thickness and tab length were statistically non-significant in minimising the stress concentrations, the optimal design selection by default was the lower range values of 0.5mm and 50 mm respectively. Any value within the lower and upper ranges are acceptable. The optimisation plot in Figure 12, shows the individual desirabilities and the composite desirability of 0.9922. This value is very close to 1, and therefore an optimal design configuration (written in red on Figure 12) was achieved. The optimal design configuration for minimising stress concentration is tab stiffness (20 GPa), Tab thickness (0.5mm), tab length (50mm), tab taper angle (5o), adhesive thickness (1.5) and bonded tabs as the preferred manufacturing process.
5. Conclusion
Finite element models for bonded and molded tabs were developed and successfully used to analyze the influence of stress concentrations induced at the tab termination regions. 64 simulations were conducted to generate a 2-level full factorial design for statistical analysis. P-values derived from ANOVA were then used to statistically determine the most significant tab design factors. Main effect plots were generated, and finally, multiple response optimisations was conducted to predict the best configuration for the design of tabs. The statistically significant factors for stress concentration minimisation were identified. Although, some literature recommend only bonded tabs, this study proved that molded tabs could be used if tab stiffness was significantly lower in magnitude than the test specimen stiffness. The most suitable design configuration was succeffully obtained from the response optimization using the desirability approach.
References
1. Anane-Fenin, K., (2012) ‘The Mechanical characterisation of Non-Crimp Fabric (NCF) and design of a data management system to facilitate and enhance the collaborative process between manufacturers and researchers’, Master’s Thesis, ENSAM, ParisTech.
2. Adams, D. O. and Adams, D. F. (2002) ‘Tabbing Guide for Composite Test Specimens’. Available at: http://www.dtic.mil/docs/citations/ADA411472 (Accessed: 28 September 2017). 3. Coguill, R. J. and Adams, D. F. (1999) ‘Selection of the proper wedge grip surface for tensile
testing composite materials’, in International SAMPE Symposium and Exhibition (Proceedings).Available at: http://www.scopus.com/inward/record.url?eid=2-s2.0-0033309663&partnerID=tZOtx3y1.
4. HartSmith, L.J., (1980) ‘MechanicallyFastened Joints for Advanced Composites -Phenomenological Consideration and Simple Analyses’. In: Lenoe, E.M., Oplinger, D.W., and Burke, J.J. Fourth Conference on Fibrous Composites in Structural Design, Nov, 1978, San Diego, CA, USA, Plenum Press, New York, USA, pp. 543-574.
5. ASTM International (2014) ‘ASTM D3039/D3039M-14 Standard Test Method for Tensile Properties of Polymer Matrix Composite Materials’, Annual Book of ASTM Standards, pp. 1– 13. doi: 10.1520/D3039.
6. ASTM D5083 - 17 Standard Test Method for Tensile Properties of Reinforced Thermosetting
Plastics Using Straight-Sided Specimens (2017). Available at:
https://www.astm.org/Standards/D5083.htm (Accessed: 28 September 2017).
7. ISO 527-1:2012 - Plastics -- Determination of tensile properties -- Part 1: General principles (no date). Available at: https://www.iso.org/standard/56045.html (Accessed: 28 September 2017).
8. Hojo, M., Sawada, Y. and Miyairi, H. (1994) ‘Influence of clamping method on tensile properties of unidirectional CFRP in 0° and 90° directions - round robin activity for international standardization in Japan’, Composites, 25(8), pp. 786–796.
9. Belingardi, G., Paolino, D. S. and Koricho, E. G. (2011) ‘Investigation of influence of tab types on tensile strength of E-glass/epoxy fiber reinforced composite materials’, In Procedia Engineering, pp. 3279–3284.
11. Joyce, P. J., Violette, M. G. and Moon, T. J. (2002) ‘Finite element analysis of unidirectional composite compression test specimens: A parametric study’, Composite Materials: Testing, Design, and Acceptance Criteria, 1416, pp. 30–68.
12. Baere, I. De, Paepegem, W. Van and Degrieck, J. (2009) ‘On the design of end tabs for quasi-static and fatigue testing of fibre-reinforced composites’, Polymer Composites, 30(4), pp. 381– 390.
13. Wisnom, M. R. and Atkinson, J. W. (1997) ‘Reduction in tensile and flexural strength of unidirectional glass fibre-epoxy with increasing specimen size’, Composite Structures, 38(1– 4), pp. 405–411.
14. Wisnom, M. R., Khan, B., Hallett, S. R. (2008) ‘Size effects in unnotched tensile strength of unidirectional and quasi-isotropic carbon/epoxy composites’, Composite Structures, 84(1), pp. 21–28.
15. Wisnom, M. and Maheri, M. (1994) ‘Tensile Strength of Unidirectional Carbon Fibre-Epoxy from Tapered Specimens’. In: 2nd European Conf. on Composites Testing and Standardisation. Hamburg; p. 239–47
16. Czél, G., Meisam, J. and Wisnom, M. R. (2016) ‘Hybrid specimens eliminating stress concentrations in tensile and compressive testing of unidirectional composites’, Composites Part A: Applied Science and Manufacturing, 91, pp. 436–447
17. Pierron, F. and Vautrin, A. (1996) ‘The 10deg off-axis tensile test: A critical approach’, Composites Science and Technology, 56(4), pp. 483–488.
18. Odegard, G. and Kumosa, M. (2000) ‘Determination of shear strength of unidirectional composite materials with the Iosipescu and 10° off-axis shear tests’, Composites Science and Technology, 60(16), pp. 2917–2943.
19. Chamis, C. C. and Sinclair, J. H. (1977) ‘Ten-deg Off-axis Test for Shear Properties in Fiber Composites’, Experimental Mechanics, 17(9), pp. 339–346.
20. Product Manual, Series 647 Hydraulic Wedge Grips, (1998) MTS Systems Corporation, Minneapolis.
21. Derringer, G. and Suich, R. (1980) ‘Simultaneous-Optimization of Several Response Variables’, Journal of Quality Technology, 12(4), pp. 214–219.