Science Arts & Métiers (SAM)
is an open access repository that collects the work of Arts et Métiers Institute of
Technology researchers and makes it freely available over the web where possible.
This is an author-deposited version published in:
https://sam.ensam.eu
Handle ID: .
http://hdl.handle.net/10985/11801
To cite this version :
François CRISTOFARI, Boris PIOTROWSKI, Raphaël PESCI - Mechanical properties of a
nanoporous membrane used in implantable medical devices. Correlation between experimental
characterization and 2D numerical simulation - Journal of the Mechanical Behavior of Biomedical
Materials - Vol. 74, p.43-53 - 2017
Any correspondence concerning this service should be sent to the repository
Administrator :
[email protected]
Mechanical properties of a nanoporous membrane used in implantable
medical devices. Correlation between experimental characterization and 2D
numerical simulation
F. Cristofari
⁎, B. Piotrowski, R. Pesci
ENSAM-Arts et Métiers ParisTech, LEM3 UMR CNRS 7239, 4 rue Augustin Fresnel, 57078 Metz Cedex 03, France
A B S T R A C T
Nanoporous membranes are used for the elaboration of implantable medical devices. In order to guaranty their integrity after implantation in a patient body, it is necessary to characterize the microstructure and the mechanical behavior of such membranes. They present randomly distributed pores around 1 µm in diameter at the surface. X-ray nanotomography permits to get the geometry of the pores through the thickness with a reduction of the diameter in the core. A multiscale study is done to characterize the membranes: macroscopic tensile tests permit to get the behavior law of the non porous material and in situ tensile tests are carried on in a Scanning Electron Microscope in order to observe the evolution of pores and cracks during loading. A 2D Finite Element Model is also developed in parallel. The confrontation between experiments and numerical simulations permit to validate the accuracy of the model. The latter is then used to simulate several types of loadings considering various pore distributions and sizes.
1. Introduction
In order to improve type 1 diabetic's living conditions, cell-encapsulation devices are developed by several groups worldwide. The principle consists in carrying insulin secretory cells/islets from human or animal origins in order to physiologically respond to the patient's body needs in terms of insulin (Ludwig et al., 2013). Such devices are composed of living cells held within porous membranes that protect them from organisms such as antibodies which can destroy them (Dulebohn et al., 2014), and have porosities that allow some hormones and biomolecules to pass through (Stamatialis et al., 2008). This makes it possible to transplant cells for the endocrine regulation without the need of immunosuppressive drugs (Benhamou et al., 2012). These devices will be implanted subcutaneously or in the abdomen of the patient and will undergo some loads inherent to this implantation site (Schwab et al., 2008); these loads may affect the geometry of the pores and can induce the failure of the structure.
It is necessary to guarantee the patient the safe mechanical behavior of the system, even during mechanical solicitations, especially since the P.I.P. prosthesis scandal. It's now subject to EU regulation (AFNOR, 2016): the integrity of a device has to be preserved once implanted so that the patients can go about their daily life.
The selection of molecules which can cross the device is principally
based on their size; insulin and glucose can cross the constitutive membranes, but antibodies are too large. This selection is done by membranes presenting pores with a controlled size. The size of the pores is a parameter very important for the integrity of the device, because when the pores become too large due to growth and coales-cence, antibodies measuring a few dozen nanometers can cross the barrier formed by the membrane and attack pancreatic cells. A membrane presenting greater pores size (around 1 µm diameter) is also used in this device as another barrier protecting the patient's organism from the encapsulated cells in case of failure of the nanoporous membrane.
In particular case, the pores could be obtained by track etching technique applied to the membrane. Their size and geometry can vary according to the tracking and etching conditions (Chavan et al., 2014). A Scanning Electron Microscope (SEM) is therefore needed to observe them; this technique has been used for the inspection of track etched membranes by several authors in literature (Apel, 2001). (Vikingsson et al., 2015) have used Cryo-SEM technique in order to characterize the micro porosity in PCL scaffold; other techniques like X-ray tomography using synchrotron radiation (Sakdinawat and Attwood, 2010) or ion polishing (Erdman et al., 2006) may also be used in order characterize precisely the microstructure.
Safety criteria are based on the performances of the porous
MARK
membranes:first, the amount of stress that the device can undergo, and then the appearance of cracks which cannot grow more than a few microns to protect the organism from a breakout of the encapsulated cells islets. As the device will be loaded in various directions during its service life, two ways can be explored to validate its resistance. Thefirst requires the development of a multiaxial loading bench (different loading paths possible) and the realization of a lot of experiments on the device to guarantee its reliability. The other way to process is to develop a Finite Element Model (FEM), to validate it with normalized experiments and then to simulate some complex loads ( Hernández-Gascón et al., 2011). Several scales can be considered to analyze the behavior of such membranes: the macroscopic scale permits to get the behavior law of the material while the evolution of the microstructure and the apparition of damage have to be considered at the microscopic scale.
In order to fully utilize the properties of this active device and ensure the safety of patients, it is then imperative to develop and implement accurate models describing its overall mechanical proper-ties. It is now possible to predict the mechanical behavior by FEM of several medical devices (Wu, 2011) or medical multiphasic alloys, as nanostructured titanium-based materials (Mishnaevsky et al., 2014). Morris (1996)has proposed a methodology in which the main error sources of FE Analysis are characterized; it is useful for testing the reliability of devices in order to get their certification and qualification. The cell encapsulation device can be considered as a composite with homogeneous thermoplastic matrix which contains voids. Approaches at different scales used for modeling composite materials could be applied to porous structures. One of them involves the application of existing micromechanical techniques, such as the Mori and Tanaka (1973)and the self-consistent methods (Hill, 1965; Kröner, 1958). Both methods have been used to model macroscopic behavior of composites with inelastic phases (Cherkaoui and Berveiller, 2000; Hill, 1965; Hutchinson, 1970). An alternative approach for modeling the overall effective behavior of composites is based on the identification of a unit cell representative for the whole composite (Achenbach and Zhu, 1990; Nemat-Nasser and Hori, 2013). Once the unit cell is identified, the FE method is usually applied to solve the corresponding boundary-value problem and deduce the effective properties. These methods give accurate results with reasonable time computation. However, they have some limitations for modeling composite structures elaborated with high random manufacture parameters. In this case, the Represen-tative Volume Element (RVE) definition is more complex. Other limits of these methods are the shape of interface and its evolution during a mechanical loading. Another approach consists in modeling the com-posite structure with a FE model. This method can predict the global behavior of the composite structure and gives excellent accuracy of local phenomena. By using model generation programs based on input datafiles, it is possible to generate structures based on experimental in situ observations and apply similar boundary conditions. Moreover, structures based on statistical rules can be investigated in order to set up strength criteria related to random manufacture parameters. A drawback of this kind of model is the time computation, which requires to adopt some hypotheses as plane strain or plane stress, or to solve the mechanical problem with parallelization techniques and High Perfor-mance Computing servers.
The aim of this paper is about the understanding of the micro-structure and the mechanical behavior of the nanoporous membranes as well as the validation and the use of the model developed to predict their behavior and their resistance considering different loading paths. To achieve this, the study presented is divided in several parts. The aim of thefirst part is to get a full representation of a membrane and to study its behavior under loading. The characterization of the micro-structure has been managed using SEM facilities and X-ray nanotomo-graphy. The behavior of the material composing the membrane is also studied through macroscopic tensile tests (Krone et al., 2013; Li et al., 2014). Then in situ tensile tests on porous membranes are conducted
inside a SEM to follow the evolution of the pores during uniaxial loading; this type of test is necessary to detect and measure all submicroscopic cracks (Yan and Fan, 2016) and to link them to the strain imposed to the sample during loading (Chen et al., 2014). The second part is presenting the 2D FE numerical model developed concurrently with experimental characterization in order to simulate the behavior of the membranes during complex loading, considering a RVE with several distributions of pores. Thefinal part will be dealing with the results provided by both the experimentations conducted and the simulations; it includes a discussion about the validation of the numerical model comparing simulations and experimentations. 2. Experimentations
2.1. Geometrical characterization
The cell encapsulation device is constituted of nanoporous polymer membranes which make the selection of the molecules; this selection is mainly based on the size of the molecules which should be allowed to pass or not. The porosity is obtained by track etching of thin polymer films presenting a thickness between 5 and 100 μm. This technique permits to get pores through a combination of charged particle bombardment and chemical etching. It allows to control the membra-ne's pore size and density; the diameter can vary through the thickness of the membrane (Apel et al., 2008). These pores can also be tilted from the surface normal.
This section will focus on the geometrical characterization of the membrane i.e. the size and the geometry of the pores.
The easiest way to describe a porous membrane is to observe the surface, counting the number of pores, their size and their distribution. Because of the small size of the pores, a SEM is necessary to get all these data.
The surface of the membrane was first characterized using SEM imaging; the microstructure is presentedFig. 1(A) and (B). This surface is difficult to observe because the polymer membrane is electrically insulated so that a lot of electrons cannot be evacuated and the image is blurred (Cazaux, 2004). A thin gold coating (less than 10 nm) permits to reduce charge effects; a BackScattered Electron (BSE) detector is used to acquire all the images with a good contrast/brightness. Pores are displayed in black and the membrane in light grey. This strong contrast is ideal for image processing; once binarized, it can be used to calculate the porous surface, count the number of pores, measure them and also acquire their positions in the membrane.
Considering the size of the pores, it appears that the membrane is considerably thicker than the size of holes. Cross section polishing was used to neatly cut the section of the membranes and observe them with a SEM; it provides some information about the geometry and the orientation of each pore. InFig. 1(C), it appears that pores are oriented with some angles and also feature a smaller diameter in the thickness center (called “core” after in this paper) than at the surface. This technique allows a good resolution to measure pores, but the data is not sufficient to really quantify the parameters describing the microstruc-ture of the membrane with a statistical point of view.
In order to better characterize the membrane in 3D, X-ray nanoto-mography experiments were also conducted at the European Synchrotron Radiation Facility in Grenoble. Due to the small size of the pores, especially in the core of the membrane, ID16A beamline was chosen because the voxel resolution is about 10 nm and thefield of view allows to do more statistics about the geometry and the orienta-tion of the pores.
2.2. Mechanical testing
The previous section dealt with the membrane in a static point of view, providing the geometrical parameters. Since the membrane is a part of a medical device that will be implanted in human body, it is also
necessary to determine its mechanical behavior and assess its resis-tance. Two kinds of membranes are considered: first a non-porous membrane in order to get the behavior law of the material it is made of, and then another with pores. The goal is to link macroscopic values to mechanisms taking place at the microscopic scale.
Tensile tests are done according to the ISO 527-3 standard on a macroscopic tensile bench equipped with a video system in order to get the real extension of the material. The samples are cut by water jet in order to get a reproducible geometry and good edge conditions. They are clamped with pneumatic grips in order to control the pressure applied on the heads and the position in the machine. The strain rate is about 10−3s−1 (quasistatic loading) and only room temperature is considered.
The membrane is viable as long as no nanocrack appears to allow antibodies to penetrate inside. The only way to observe the presence of cracks is to use a SEM during loading with a micro tensile device. At this scale, the sample is also inspired by specimen 4 recommended by the
ISO 527-3 standard (AFNOR, 1995); some modifications are made in order to adapt it to the micro tensile device. In fact, the sample presents the same geometry but with a reducing factor of 3.8 and with a double fillet presenting a reducing factor of 2 (seeFig. 5). This sample was entirely coated with few nanometers of gold as described in the previous section.
The tensile micromachine PROXIMA® from the company MICROMECHA® is used to perform this experiment. It is not possible to get a high resolution SEM image during continuous loading; all the images are taken at different loading steps by blocking the displacement of the crosshead of the micromachine. The use of pneumatic grips is forbidden inside a SEM because high vacuum must be maintained inside the chamber; specialfixtures were designed and screw torque was controlled during tightening. The strain rate considered is about 5.10−4s−1.
The software of the tensile micromachine allows to monitor and record the load and the crosshead displacement during the test. At each Fig. 1. Geometrical characteristics of a membrane. A) and B) BSE SEM images of the surface presenting randomly distributed pores. C) Secondary Electron (SE) SEM image of a slice obtained using cross section polishing permitting to see the geometry and the orientation of the pores in the thickness of the membrane. D) 3D reconstruction of the membrane based on ESRF tomography's stack images. E) Projection of the ESRF topography's stack images in the (YZ), (XY) and (XZ) planes. Pores are tilted from the Z axis in plane (XZ).
step of loading, the crosshead displacement is stopped and the load value applied is tumbling down because of the springback effect and the machine; all the images are taken once the force value is stabilized.
InFig. 5which shows the behavior of two different samples, each circle on the graph represents a stop of the crosshead displacement to get the images. Different zones of interest are defined at the beginning of the test: these zones are investigated during the test at several magnifications (from ×1000 to ×4000) in order to highlight all the mechanisms occurring.
2.3. Image processing
SEM Image acquisition and visualization are enough to get a qualitative idea of the microstructure and the local behavior of the membrane, but to go further in the analyses, image processing is required to get more quantitative results like the position and the size of the pores. It is also possible to get the fields of displacement and deformation of the membrane during loading by using Digital Image Correlation (DIC) (Kammers and Daly, 2013).
SEM images of the membrane are treated using ImageJ® software in order to identify the position and the size of the pores. The procedure (Fig. 2) is inspired by the one described by Wei and Cao (2016), consisting in smoothing the image using a mean filter, then the application of a threshold separating the pores and the matrix, and finally the watershed treatment available in ImageJ in order to get the surface area and the coordinates of the centroid of each pore. The pores can be assimilated to perfect circles the diameters of which are calculated from Eq. (1), where D and S are the diameter and the surface area of each pore, respectively.
D= (4· / )S π1/2 (1)
This treatment can also be applied to each slice of the image stacks (plane XY) provided by X-ray nanotomography to get the surface ratio between the pores and the matrix through the thickness of the membrane. It is thus possible to calculate the variation of the diameter of the pores between two slices of the membrane using Eq.(2), where D1and D2are the average diameters of the pores and S1and S2the total
surface of the pores, respectively in slices 1 and 2.
D2= D1· ( /S S1 2)1/2 (2)
With in situ tensile tests, it is also possible to get some strainfields by analyzing the displacement between two images of the same zone under loading. Choosing low magnification images (×1000) of the surface, the pores of the membrane appear as a speckle pattern that can be used to calculate the deformation. For this study, the authors have chosen the commercial GOM Correlate software provided by GOM Company which is certified by the German organisms NIST and PTB (GOM mbH, 2016).
This method also permits to get the displacements of a particular region of interest. The principle of DIC method used here is to discretize the image in little groups of pixels called facets. The deformation of these facets and the displacement between each one are analyzed to calculate the displacement and deformationfields. The size of the facets chosen for the analysis is very important since it permits to analyze the displacementfield with more or less averaging and precision. Larger facets will make the deformationfield appearing smoother than small facets that will rather emphasize local effects.
The DIC applied to SEM images have to be analyzed with some precautions as described bySutton et al. (2007), because some shifts can appear during the image acquisition process. Here eventual shifts due to image acquisition can be neglected compared to the high strain field between 2 loading steps.
For this study, DIC is used to get the strainfield in the active part of the samples during macroscopic tensile tests; it permits to know if the deformation is uniform in the whole membrane or if some zones are more strained. At this scale, the pores are not visible so that a speckle pattern is applied on the sample. DIC is then applied to SEM images considering the pore distribution at the surface to analyze the displace-mentfield rather than the strain field from the images and to get the boundary conditions of the zone of interest followed at high magnifica-tion during loading. The size of the facets has been optimized in order to get results close enough to reality.
2.4. Experimental results
2.4.1. Geometrical characterization
The experimental investigations permit to better identify the geometry of the pores; the thickness of a membrane is about 50 times greater than the diameter of a pore at the surface.
A coordinate system is useful to describe the membrane in space, as Fig. 2. Image processing to identify the position and the size of the pores. A) SEM image. B) Black and white image obtained after application of adaptedfilters, thresholding and watershed process. C) Automatic analysis of the positions and size of pores. D) Results of the analyses presenting the label, the area (in µm2) and the X and Y positions (in µm) of each pore
defined in Fig. 1(D). The surface of the membrane is considered as plane (XY); plane (XZ) is that in which the pores presenting a tilt are contained; the last plan (YZ) is perpendicular to the other two in order to define a Cartesian coordinate system.
The observations permit to see that all the pores are roughly the same size and are randomly distributed at the surface (same distribu-tion in all direcdistribu-tions of the (XY) plane). The analyses show circular pores presenting a necking at the center of the membrane thickness, reducing the diameter of the pores with a factor 1.4. They also present a tilt angle from the normal of the surface Z only in plane (XZ); it varies from−45° to +45°.
2.4.2. Mechanical characterization
The constitutive law presented in Fig. 3is obtained after testing several specimens (true values considered). It shows two distinct domains identified as elastic and elastoplastic. The elastic domain can be described by the Young modulus E=5400 MPa and the Poisson ratio ν=0.3 both determined thank to a video extensometer system; the yield stress isσy=105 MPa, the maximum strength is Rm=330 MPa and the
elongation after fracture A%=57%.
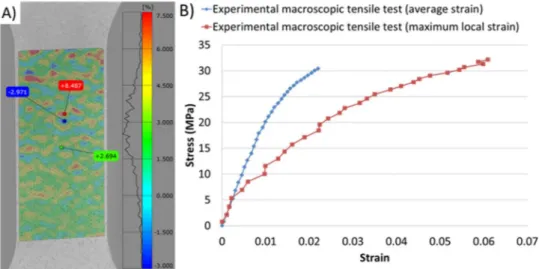
DIC applied to porous membranes shows that the strainfield is not homogeneous in the active part; it varies a lot depending on the observed zone. The comparison of the average behavior and the local maximum behavior as displayed in Fig. 4(B) highlights significant differences. This phenomenon should be considered in particular during in situ testing because the analyzed zone is reduced.
The results of two similar in situ tensile tests are presented inFig. 5. The images show that the microstructure is deforming at each step of loading. At a very local scale, it is possible to observe and quantify the displacement of each pore: some of them evolve from circles to ellipses
and cracks appear between pores which are close to one another and aligned perpendicularly to the tensile direction.
The comparison of two consecutive loading steps shows that the microstructure evolves in the same way until the appearance of damage around the followed zone, as presented inFig. 6: the composite colors permit to see two different steps of loading in the same image. The blue and red colors correspond to the old and new positions of the pores, respectively; the alignment is done in the center of the image.
Fig. 6shows the evolution of one part of the membrane during the test; the tensile direction is horizontal. An alignment of pores perpen-dicular to the tension direction and even a pore cluster are usually sources of weakness for the membrane; zone Z1 inFig. 6illustrates this point with thefirst occurrence of damage at the surface.Fig. 6(C) shows in particular that the appearance of a crack on the left (Z1″) induces elastic withdrawal; indeed, the pores displayed on the right side of the membrane (Z2) are moving in the opposite direction (Z2″) than before (Z2 and Z2′).
The DIC applied on the low magnification images of the membrane permits to analyze the displacementfield. It appears that the interesting zone admits average deformation of about 2.2% in the tensile direction for a deformation of about −0.6% in the transverse direction. It is interesting to notice that this result is in accordance with the value of the Poisson coefficient of 0.3 admitted for similar polymers. The displacement is not the same for each point of the boundary segment, because of the presence of pore clusters or the absence of pores. As a consequence, the strainfield is very variable.
Crossing DIC methods on this zone and load measurements given by the micro tensile bench permit to get the corresponding equivalent material behavior (Tasan et al., 2010). It appears that the equivalent Fig. 3. Comparison of the experimental true behavior and the implemented behavior of
the non-porous material.
Fig. 4. A) Strainfield in a porous membrane during macroscopic tensile test. B) Behavior of the membrane considering the average strain value and the maximal strain value. Fig. 5. Behavior of two membranes during in situ tensile tests in SEM.
Young modulus of the membrane is deteriorated to 1050 MPa which is pretty far of the 5400 MPa of the non-porous material. Moreover, the maximum strength of the porous membrane is about 30 MPa, for a strain of about 4% after failure (seeFig. 10A).
3. Numerical simulation
Experimental investigations allowed to determine the behavior of the membranes bulk material at the microscopic scale. But each membrane cannot be investigated by this way before implantation. Indeed, the pores are randomly distributed at the surface so that an infinity of distributions exists; the porous fraction is always the same from one membrane to another and the size of the pores follows a statistical law. A numerical model is therefore developed in order to simulate different types of loading that can be more or less representa-tive of the mechanisms occurring in the implantation site, and to get more statistics about the risk of failure, not only for uniaxial tensile tests, but also biaxial loading.
3.1. Numerical materials and methods
The proposed numerical model is a 2D plane-stress shell model; this hypothesis is used in order to reduce the computation time. The commercial FE software ABAQUS® has been used to implement and
solve the FEM.
This model consists in a membrane shell with an assumed isotropic behavior of the non-porous material identified from the experimental tensile tests (Fig. 3); the defined shell is presenting a distribution of holes. Two boundary conditions are considered and described inFig. 8. First, the line segment [AB] is blocked in translation on the X axis, point I (center of segment [AB]) is blocked in translation on the Y axis and a displacement U is imposed to the segment [CD]. These conditions have been chosen to simulate a uniaxial tensile test in the X direction. The other boundary conditions are directly based on experimental DIC results, which give exact displacements of considered areas as illu-strated inFigs. 6 and 7.
The model has been meshed with around 40,000 triangular CPS3 elements with at least 8 elements to describe a circle. This length has been adopted according to holes diameters in order to well consider their shape. Computations are conducted with static implicit direct solver, considering 20 increments in order to take into account the non linear behavior of the polymer. The numerical simulation gives the gradient of strain and stress in the membrane, especially around the pores and the clusters of pores. These results permit to locate the weakest areas for a given level of imposed strain or stress; it is possible to link the total applied deformation to the local maximum of the stress value. This investigation permits to highlight the effect of a locally applied deformation on the elasticity or at least the absence of fracture of the membrane, in order to verify that the medical device in the studied geometrical configuration can still perform its functions.
The simulation also gives the final geometry of the deformed membrane that can be used to measure the size of the pores after deformation or to compare with an experimental test.
This model can be used in order to get an idea of the 2D behavior of the membrane considering several pore distributions; the effect of the pore size is particularly investigated.
The geometrical characterization shows that the size of the pores evolves through the thickness of the membrane: the size of the holes is thinner in the core than at the surface. The comparison of two simulations of the same zone will permit to know which section is the most critical. If the most critical is at the surface, it will mean that the observations and the simulation of the surface can be enough to characterize the worst case of a given distribution.
There are two ways to manage the study, by applying the same displacement or the same stress to both simulations. The authors have here chosen to impose a displacement as boundary conditions to all simulations.
The developed numerical model has input parameters such as the position and the size of the pores and it is possible to apply the exact boundary conditions desired. These parameters can be identified from several real cases thanks to image processing, in order to simulate the same tests as the ones experimentally done (Fig. 8B).
3.2. Simulation results
Before being overconfident with the model, a first step consists in validating it. In order to do that, an experiment has been realized and the same conditions have been simulated: the results of these two tests are compared.
As explained in the second section, an in situ SEM tensile test is realized and a specific zone is followed at each step of the loading. The location and the size of the pores are determined using image processing on the image at the initial step. The boundary conditions are obtained thanks to the measurement of the displacementfield by DIC between the initial step and the deformed one. The simulation being processed, the results are compared to the experiment at each step considering the damage appearing during the experiment and the concentration of stress predicted by the model; the two membranes (experimentally and numerically deformed) can also be superimposed in order to compare the positions of the different pores.
Fig. 6. SEM images (magnification ×4000): superimposition of a same zone considering several loading steps. The images are aligned by the center. A) Between initial and step 2. B) Between step 4 and step 5. C) Between step 5 and step 6 (appearance of a fracture on the left of the image). (For interpretation of the references to color in thisfigure, the reader is referred to the web version of this article.)
In the simulation, stress concentration is located in the same zones as cracks initiate during the experiment; it means that the model is able to predict the zones presenting an augmented risk of failure.
Fig. 9 shows the superimposition at several loading steps of the same deformed microstructure for both experimental and simulated tests. The correlation is very good for the first loading steps; when deformation increases, some little differences appear locally.
Thanks to the model, it is possible to classify the elements in 3 categories: the elements still elastic defined by a stress value under 105 MPa, the elements close to the failure defined by a stress value greater than 330 MPa and the other elements presenting a stress value between 105 MPa and 330 MPa (plastic deformation with no failure).
The experimental and simulated tests highlight a gradient of strain and stress in the microstructure (Fig. 11). It is possible to focus on the maximum stress that appears for several randomly simulated config-urations. The results of several simulations show that the maximum stress accepted (σy=105 MPa) is reached locally for global deformation of the simulated microstructure around 0.4%, which corresponds to a macroscopic stress applied of 10 MPa; the ultimate stress (330 MPa: appearance of thefirst cracks locally) is reached for strain around 1.5%
corresponding to 30 MPa macroscopically.
The influence of the pore size on the behavior of the microstructure has also been evaluated. Indeed, as described in thefirst section, pores present a necking in the core of the membrane. The study of the same microstructure presenting a reduction of the pore diameter using Eq.(2) would permit to appreciate the location of the maximum stress in the microstructure; it is possible to simulate the same evolution (same positions and same boundary conditions) from the surface to the core of the membrane by applying a multiplicative coefficient on the diameter. The comparison ofFig. 11(B) and (C) andFig. 11(F) and (G) shows that increasing the value of the applied deformation increases the level of stress inside the considered zone.
Other simulations have been done in order to appreciate the effect of more complex loadings.Fig. 11(D) and (H) illustrate an equibiaxial loading for the same microstructure; this simulation has been compared to a uniaxial tensile test presenting the same imposed strain. It shows a modification of the stress gradient in the microstructure and the average Von-Mises stress value appears to be higher than with only uniaxial loading.Fig. 12 recapitulates the values of Von Mises stress obtained for the simulations displayed in Fig. 11; it also gives the Fig. 7. Displacementfield of a large scale image analyzed to get the displacements of the boundary of the zone of interest followed during the experiment.
Fig. 8. Simplified model with boundary conditions. A) Average conditions applied only in the left and right boundaries. B) Conditions applied to all the boundaries (can be used for experimental displacement).
proportion of elements which have not reached the yield stress of the material (105 MPa), and the proportion of elements close to the failure. Fig. 13permits to get the evolution of the proportion of elements still elastic and those which have already reached failure as a function of the applied stress. Two kinds of loadings are considered (uniaxial and biaxial tension) and show very similar results for the microstructure both at the surface and in the core. It appears that the proportion of elements still elastic is greater in the core than at the surface for a given loading; the opposite is true for the proportion of elements close to failure. Moreover, in all cases, the proportion of elements elastic starts to decrease before the proportion of elements reaching failure increases (plasticity effect).
4. Discussions
4.1. Validation of the model
The validation of the model can be done by several ways. Thefirst one consists in a simple comparison of the deformed microstructure observed during in situ test and the same one simulated, as shown in Fig. 9The simulation with the same boundary conditions presents the same evolution of pores and the maximum strength value is reached at the same positions as fracture appears during the experiment; the squares drawn inFig. 9(B) highlight this phenomenon. It is important to note that the behavior of the microstructure outside the observed zone can influence the boundary conditions; it is therefore crucial to get the real ones in order to well simulate the experimental test for an appropriate comparison.
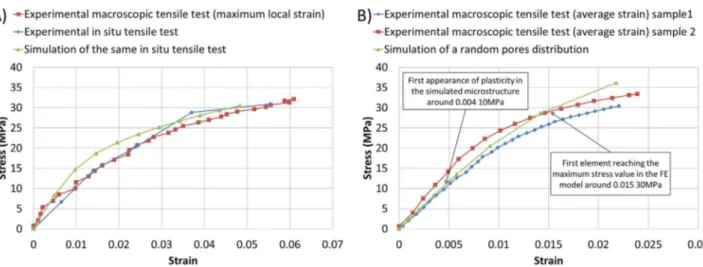
The second way to validate the model is to focus on the stress-strain
curves. As shown inFig. 10(A), the effective constitutive behaviors obtained with experiments and simulations are close enough to conclude that the model permits to simulate very local behavior with a good precision. Differences between both behaviors may come from "errors" which can be associated to the experimental issues like the resolution of the load sensor and also the hypothesis made on the experiments. A local progressive inelasticity highlights the fact that the local behavior is not at the same level of stress in all the microstructure; the behavior of the membrane is also considered as isotropic in the simulation, which can lead to some small deviations. The accumulation of all these hypotheses can explain the differences between experiments and simulations.
Finally, the behavior of a randomly simulated microstructure corresponding to the statistical distribution of pores in all the mem-branes is compared to the average behavior of a porous membrane obtained during macroscopic tests. Here again, it appears inFig. 10(B) that both are similar in elasticity. Then, damage appears during experiments while it is not considered in the FEM.
In both local and global cases, the model is adapted to appreciate the behavior of the microstructure. The limit of the model is the appearance of fracture because it does not present damaging function; so when damage appears in the experiment, it does not in the model.
The authors notice that the comparison between the behavior of the microstructure observed during in situ tensile test and the local maximum behavior of the membrane is the same. This can be explained by the microstructure observed during the in situ test that presents a porous fraction higher than the average of the membranes (here 25% rather than 20% of porous surface).
Fig. 9. Superimposition of the same microstructure for both experimental and simulated tests (same porous distribution and same boundary conditions). A) Initial step. B) Loading step 5.
Fig. 10. Comparison of the behavior of porous membranes between experiments and simulation. A) Comparison between the behavior of a membrane during macroscopic tensile test using the value of the maximum local strain, the equivalent local behavior of a microstructure during in situ tensile test and the equivalent local behavior simulated of the same microstructure. B) Comparison of the equivalent global behavior of two different membranes and the behavior of a microstructure presenting randomly distributed pores following the distribution law identified.
4.2. Interpretation
On the first hand, it appears that the concentration of stress is generally perpendicular to the loading direction, and principally favored by the alignment and the concentration of pores. This is explained by the decrease of the equivalent section under stress, as represented by the dash dot line inFig. 11(C). Through this section, the behavior of the microstructure appears more compliant for a uniaxial loading perpendicular to this section.
On the other hand, the lack of pores all along a line parallel to the tensile direction will increase the stiffness of the structure: such kind of line is represented by a dot line inFig. 11(B).
It is possible to impose two different kinds of loading to the microstructure, considering displacement or stress.
– For the same imposed displacement, the membrane presenting the pores with the smallest diameter presents higher values of local stress and also higher values of equivalent stress in the entire surface, as displayed inFig. 12. The interpretation of these results is that damage should start in the core of the membrane: for a same imposed displacement, the stress is higher because of the smaller size of pores.
– For the same imposed stress, the part of the membrane presenting the highest porous fraction (ie the surface) has the lowest mechan-ical resistance (Rm is reached more quickly): it is coherent with the first cracks that appear at the surface before propagating to the core, as observed during in situ tests in the SEM, since the same force is applied through the thickness, and not the same deformation. The conclusion of that part is that there are 2 main parameters that influence the behavior of the membrane. First, the level of macroscopic strain or stress undergone by the membrane is lower when the global fraction of pores increases. Then, a greater size of pores induces a higher stress concentration; moreover, when they are close to one another, the stress concentration also increases at the interface of two pores.
The difference between simulation and experiments can be ex-plained by the type of boundary conditions applied: the model is constrained only by imposed displacement but during a tensile test, the sample is constrained by a combination of displacements and loads
more complex; the displacement imposed by the boundary clamps on upper and lower surface of the sample is not necessary true in the entire thickness section and in particular in the core. Accommodation of displacement in the core is possible, which can explain that the maximum stress value is reached at the surface. For the same stress value, the core shows a better resistance than the surface which explains the observations made during in situ tensile tests in SEM with thefirst cracks appearing at the surface before propagating to the core. There is little data in literature, but in general, the ultimate strength of biological tissues and organs of the abdomen is around 10 kPa and is reached for a deformation of about 20% (Sommer et al., 2013). Uniaxial and biaxial simulations show that for a stress about 100 kPa (ten times the maximum stress admissible by human organs), the membrane is still fully elastic. Indeed, the apparition of plasticity in the membrane is generally reached for an applied stress around 10 MPa, and thefirst crack appears when the applied stress reaches about 75 MPa; the resistance of the membrane is therefore much greater than that of the abdominal tissues. However, the apparition of cracks starts for a deformation around 5%, which is 4 times lower than the maximum deformation admissible by human tissues. The most crucial point to control is therefore the level of deformation that the device can undergo in the implantation site; for an external load, the human tissue around the device would be highly deformed before the transmission of the load to the device, which should protect it from damageFig. 13. 5. Conclusions and perspectives
This study permits to understand and simulate the behavior of a complex nanoporous membrane during loading.
– The observations made using several techniques as microscopy, cross section polishing and X-ray nanotomography enabled to identify the main geometrical features of the membranes: pores randomly distributed and oriented, presenting a diameter around 1 µm at the surface and a section reduction around 40% in the core. Tensile tests gave the elastic-plastic behavior law of the bulk material and in situ SEM testing permitted to observe the local behavior of the microstructure during loading. This permits to get very local Young modulus of the porous membranes which is around 1050 MPa whereas the bulk one is around 5400 MPa.
Fig. 11. Comparison of the Von Mises stressfield for several loading states considering the same distribution of pores. A) Unloaded state of a randomly distributed porous zone representing the surface of a membrane. B) 5% deformation applied on the X direction for the A) zone. C) 10% deformation applied on the X direction for the A) zone. D) 10% deformation applied on both X and Y directions for the A) zone. E) Unloaded state of the same porous distribution than A) representing the core of a membrane. F) 5% deformation applied on the X direction for the E) zone. G) 10% deformation applied on the X direction for the E) zone. H) 10% deformation applied on both X and Y directions for the E) zone.
– The numerical 2D model of the membrane developed using the behavior law of the non-porous material and the distribution of pores experimentally identified has been validated through uniaxial loading proceeding by several comparisons between the model and the experiments. It shows the limit of resistance of the microstruc-ture under uniaxial loading. Considering an imposed stress, the surface and the core of the membrane can undergo 10 MPa and 30 MPa respectively until exhibiting plastic deformation as well as 20 and 60 MPa until the apparition of local failure; considering an imposed deformation, the surface and the core of the membrane can undergo a 0.1% and a 0.04% deformation,respectively until exhibit-ing plastic deformation as well as and a 0.5% and a 0.4% deformation until the apparition of local failure.
– According to several references, such a device can undergo an
imposed stress much greater than organs in the implantation site, but it won't be able to be deformed as much as the human tissues. – The model permits to simulate several distributions of pores for
different loading steps and to get an idea of the behavior inside the membrane, in the core, which is impossible with the experimental tests in SEM. One of the main results is for a stress of 40 MPa on the microstructure: 25% of the surface exhibits plastic deformation and some cracks start to initiate very locally whereas only 95% is still elastic and no element has reached the failure criterion, meaning that the membrane is still viable.
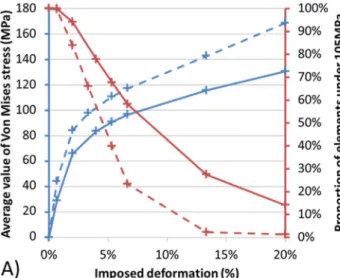
– The developed model can now be used to quantify the risk of failure of these membranes without the necessity to manage complex experimentations; it can also be transposed to other materials. Fig. 12. A) Comparison of equivalent behavior of the core under uniaxial and equibiaxial imposed deformations and proportion of elements still elastic. B) Comparison of equivalent behavior of the surface under uniaxial and equibiaxial imposed deformations and proportion of elements still elastic. C) Comparison of equivalent behavior of the core under uniaxial and equibiaxial imposed deformations and proportion of elements close to failure. D) Comparison of equivalent behavior of the surface under uniaxial and equibiaxial imposed deformations and proportion of elements close to failure.
Acknowledgments
The authors would like to acknowledge Alexandra Pacureanu for her help in microtomography at the ESRF, and also the Fond Unique Interministériel (DF13008L00/11), both regions Alsace and Lorraine and the Communauté Urbaine du Grand Nancy for their financial support.
References
Achenbach, J.D., Zhu, H., 1990. Effect of interphases on micro and macromechanical behavior of hexagonal-arrayfiber composites. J. Appl. Mech. 57, 956–963.http://dx. doi.org/10.1115/1.2897667.
AFNOR, 2016. ISO 13485 Medical Devices– Quality Management Systems – Requirements for Regulatory Purposes.
AFNOR, 1995. ISO 527-3 Plastiques– Détermination des propriétés en traction – Partie 3: Conditions d’essai pour films et feuilles.
Apel, P., 2001. Track etching technique in membrane technology. Radiat. Meas. 34, 559–566.http://dx.doi.org/10.1016/S1350-4487(01)00228-1.
Apel, P.Y., Blonskaya, I. V., Dmitriev, S.N., Mamonova, T.I., Orelovitch, O.L., Sartowska, B., Yamauchi, Y., 2008. Surfactant-controlled etching of ion track nanopores and its practical applications in membrane technology. In: Proceedings of the 23rd International Conference on Nuclear Tracks in Solids. Radiat. Meas., 43, pp. S552–S559.http://dx.doi.org/10.1016/j.radmeas.2008.04.057.
Benhamou, P.Y., Lablanche, S., Dalle, P., Rivera, F., Richard, M.J., Halimi, S., 2012. Thérapie cellulaire du diabète de type 1: un pancréas bio-artificiel, sinon rien? Med. des Mal Metab. 6, 397–402.http://dx.doi.org/10.1016/S1957-2557(12)70444-3. Cazaux, J., 2004. About the mechanisms of charging in EPMA, SEM, and ESEM with their
time evolution. Microsc. Microanal. Null 670–684.http://dx.doi.org/10.1017/ S1431927604040619.
Chavan, V., Agarwal, C., Pandey, A.K., Nair, J.P., Surendran, P., Kalsi, P.C., Goswami, A., 2014. Controlled development of pores in polyethylene terepthalate sheet by room temperature chemical etching method. J. Memb. Sci. 471, 185–191.http://dx.doi. org/10.1016/j.memsci.2014.07.077.
Chen, Z., Hao, X., Wang, Y., Zhao, K., 2014. In-situ observation of tensile fracture in A357 casting alloys. J. Mater. Sci. Technol. 30, 139–145.http://dx.doi.org/10.1016/j.jmst. 2013.04.014.
Cherkaoui, M., Berveiller, M., 2000. Micromechanical modeling of the martensitic transformation induced plasticity in steels. Smart Mater. Struct. 9, 592–603.http:// dx.doi.org/10.1088/0964-1726/9/5/303.
Dulebohn, J., Ahmadiannamini, P., Wang, T., Kim, S.-S., Pinnavaia, T.J., Tarabara, V.V., 2014. Polymer mesocomposites: ultrafiltration membrane materials with enhanced permeability, selectivity and fouling resistance. J. Memb. Sci. 453, 478–488.http:// dx.doi.org/10.1016/j.memsci.2013.11.042.
Erdman, N., Campbell, R., Asahina, S., 2006. Argon Beam Cross Sectioning. 164. GOM mbH, 2016. Digital Image Correlation And Strain Computation Basics. GOM User
Man.
Hernández-Gascón, B., Peña, E., Melero, H., Pascual, G., Doblaré, M., Ginebra, M.P., Bellón, J.M., Calvo, B., 2011. Mechanical behaviour of synthetic surgical meshes: finite element simulation of the herniated abdominal wall. Acta Biomater. 7, 3905–3913.http://dx.doi.org/10.1016/j.actbio.2011.06.033.
Hill, R., 1965. A self-consistent mechanics of composite materials. J. Mech. Phys. Solids 13, 213–222.
Hutchinson, J.W., 1970. Elastic-plastic behaviour of polycrystalline metals and composites. Proc. R. Soc. Lond. A Math. Phys. Eng. Sci. 319, 247–272.http://dx.doi. org/10.1098/rspa.1970.0177.
Kammers, A.D., Daly, S., 2013. Digital image correlation under scanning electron microscopy: methodology and validation. Exp. Mech. 53, 1743–1761.http://dx.doi. org/10.1007/s11340-013-9782-x.
Krone, R., Havenstrite, K., Shafi, B., 2013. Mechanical characterization of thin film, water-based polymer gels through simple tension testing of laminated bilayers. J. Mech. Behav. Biomed. Mater. 27, 1–9.http://dx.doi.org/10.1016/j.jmbbm.2013.05. 010.
Kröner, E., 1958. Berechnung der elastischen konstanten des vielkristalls aus den konstanten des einkristalls. Z. Phys. 151, 504–518.http://dx.doi.org/10.1007/ BF01337948.
Li, X., Kruger, J., Jor, J., Nielsen, P., Nash, M., Wong, V., Dietz, H.P., 2014. Characterizing the ex vivo mechanical properties of synthetic polypropylene surgical mesh. J. Mech. Behav. Biomed. Mater. 37, 48–55.http://dx.doi.org/10.1016/j.jmbbm.2014.05.005. Ludwig, B., Reichel, A., Steffen, A., Zimerman, B., Schally, A.V., Block, N.L., Colton, C.K., Ludwig, S., Kersting, S., Bonifacio, E., Solimena, M., Gendler, Z., Rotem, A., Barkai, U., Bornstein, S.R., 2013. Transplantation of human islets without
immunosuppression. Proc. Natl. Acad. Sci. USA. 110, 1–5.http://dx.doi.org/10. 1073/pnas.1317561110.
Mishnaevsky, L., Levashov, E., Valiev, R.Z., Segurado, J., Sabirov, I., Enikeev, N., Prokoshkin, S., Solov’Yov, A.V., Korotitskiy, A., Gutmanas, E., Gotman, I., Rabkin, E., Psakh’E, S., Dluhos, L., Seefeldt, M., Smolin, A., 2014. Nanostructured titanium-based materials for medical implants: modeling and development. Mater. Sci. Eng. R Rep. 81, 1–19.http://dx.doi.org/10.1016/j.mser.2014.04.002.
Mori, T., Tanaka, K., 1973. Average stress in matrix and average elastic energy of materials with misfitting inclusions. Acta Metall. 21, 571–574.http://dx.doi.org/10. 1016/0001-6160(73)90064-3.
Morris, A.J., 1996. The qualification of safety critical structures by finite element analytical methods. In: Arch. Proceedings Inst. Mech. Eng. Part G J. Aerosp. Eng. (vols 203–210) 210, 1989–1996, pp. 203–207.http://dx.doi.org/10.1243/PIME_ PROC_1996_210_361_02.
Nemat-Nasser, S., Hori, M., 2013. Micromechanics: overall properties of heterogeneous materials. Elsevier.
Sakdinawat, A., Attwood, D., 2010. Nanoscale X-ray imaging. Nat. Photonics 4, 840–848.
http://dx.doi.org/10.1038/nphoton.2010.267.
Schwab, R., Schumacher, O., Junge, K., Binnebösel, M., Klinge, U., Becker, H.P., Schumpelick, V., 2008. Biomechanical analyses of meshfixation in TAPP and TEP hernia repair. Surg. Endosc. Other Interv. Tech. 22, 731–738.http://dx.doi.org/10. 1007/s00464-007-9476-5.
Sommer, G., Eder, M., Kovacs, L., Pathak, H., Bonitz, L., Mueller, C., Regitnig, P., Holzapfel, G.A., 2013. Multiaxial mechanical properties and constitutive modeling of human adipose tissue: a basis for preoperative simulations in plastic and reconstructive surgery. Acta Biomater. 9, 9036–9048.http://dx.doi.org/10.1016/j. actbio.2013.06.011.
Stamatialis, D.F., Papenburg, B.J., Gironés, M., Saiful, S., Bettahalli, S.N.M., Schmitmeier, S., Wessling, M., 2008. Medical applications of membranes: drug delivery, artificial organs and tissue engineering. J. Memb. Sci. 308, 1–34.http://dx.doi.org/10.1016/j. memsci.2007.09.059.
Sutton, M.A., Li, N., Joy, D.C., Reynolds, A.P., Li, X., 2007. Scanning electron microscopy for quantitative small and large deformation measurements Part I: sem imaging at magnifications from 200 to 10,000. Exp. Mech. 47, 775–787.http://dx.doi.org/10. 1007/s11340-007-9042-z.
Tasan, C.C., Hoefnagels, J.P.M., Geers, M.G.D., 2010. Microstructural banding effects clarified through micrographic digital image correlation. Scr. Mater. 62, 835–838.
http://dx.doi.org/10.1016/j.scriptamat.2010.02.014.
Vikingsson, L., Claessens, B., Gómez-Tejedor, J.A., Gallego Ferrer, G., Gómez Ribelles, J.L., 2015. Relationship between micro-porosity, water permeability and mechanical behavior in scaffolds for cartilage engineering. J. Mech. Behav. Biomed. Mater. 48, 60–69.http://dx.doi.org/10.1016/j.jmbbm.2015.03.021.
Wei, X., Cao, Y., 2016. Automatic counting method for complex overlapping erythrocytes based on seed prediction in microscopic imaging. J. Innov. Opt. Health Sci. 9, 1650016.http://dx.doi.org/10.1142/S1793545816500164.
Wu, M.S., 2011. Strategies and challenges for the mechanical modeling of biological and bio-inspired materials. Mater. Sci. Eng. C 31, 1209–1220.http://dx.doi.org/10.1016/ j.msec.2010.11.012.
Yan, L., Fan, J., 2016. In-situ SEM study of fatigue crack initiation and propagation behavior in 2524 aluminum alloy. Mater. Des. 110, 592–601.http://dx.doi.org/10. 1016/j.matdes.2016.08.004.
Fig. 13. Proportion of elements still elastic (under 105 MPa) and elements close to failure (above 330 MPa) considering the same microstructure in the core and at the surface of the membrane for uniaxial and equibiaxial loadings. The microstructure considered is that displayed inFig. 11.