HAL Id: hal-01699337
https://hal-mines-albi.archives-ouvertes.fr/hal-01699337
Submitted on 23 Feb 2021HAL is a multi-disciplinary open access archive for the deposit and dissemination of sci-entific research documents, whether they are pub-lished or not. The documents may come from teaching and research institutions in France or abroad, or from public or private research centers.
L’archive ouverte pluridisciplinaire HAL, est destinée au dépôt et à la diffusion de documents scientifiques de niveau recherche, publiés ou non, émanant des établissements d’enseignement et de recherche français ou étrangers, des laboratoires publics ou privés.
TTT diagram of the anionic polymerization PA6 from
ϵ-Caprolactam
Céline Vicard, Olivier de Almeida, Arthur Cantarel, Gérard Bernhart
To cite this version:
Céline Vicard, Olivier de Almeida, Arthur Cantarel, Gérard Bernhart. TTT diagram of the anionic polymerization PA6 from ϵ-Caprolactam. ICCM 21 - 21th International Conference on Composite Materials, Aug 2017, Xi’an, China. 10 p. �hal-01699337�
TTT DIAGRAM OF THE ANIONIC POLYMERIZATION PA6 FROM
-CAPROLACTAM
Céline Vicard1, Olivier De Almeida1, Arthur Cantarel2, Gérard Bernhart1 1Institut Clément Ader, Ecole des Mines d’Albi-Carmaux
Campus Jarlard, 81013 Albi cedex 09, France [email protected], [email protected]
2 Institut Clément Ader, IUT Tarbes
1 rue Lautréamont, BP 1624, 65016 Tarbes, France [email protected]
Keywords: liquid reactive process, thermoplastic composite, synthesis kinetics, coupling modeling ABSTRACT
Adaptation of liquid reactive process for composite thermoplastic manufacturing has been studied through the polyamide 6 case. Its polymerization from ε-caprolactam monomer involves simultaneously the crystallization of the growing chains over the temperature range. In order to understand and predict the behavior of the coupling between both phenomena, an experimental study has been carried out by performing isothermal syntheses in DSC. Different curves morphology has been obtained, depending of the level of coupling between polymerization and crystallization. The final degree of conversion, characterized by TGA, has been recorded between 92 and 97 wt.%, indicating a high reaction yield. The crystalline phase obtained has been characterized by DSC and WAXS. The samples showed a high crystallinity and from α-type. This database has been used as input into phenomena modeling. Polymerization was described by Malkin’s model and crystallization by JMA’s model. The Hillier’s coupling has been adapted in the polymerization/crystallization case by adding a diffusion factor, allowing a better understanding of mechanisms. Thank to this work, isothermal TTT diagrams of the PA6 synthesis have been established.
1 INTRODUCTION
Fiber reinforced thermoplastic composites offer an interesting compromise between mechanical performances, chemical resistance and recyclability that make them serious challengers of thermoset composites. However, the high melting temperature and viscosity of thermoplastic matrices still restrict their growth mainly because of the expensive and time-consuming manufacturing processes like autoclave or hot press. Impregnation of reinforcing yarns is therefore necessarily a slow process although complex semi-finished products (commingled, powdered), or fast processes allow reducing the consolidation time of thermoplastic composites.
To overcome these limitations, reactive systems leading to a thermoplastic polymer represent a promising alternative for the fabrication of thermoplastic composites and allow the adaptation of liquid molding processes (RTM, infusion) [1, 2]. The thermoplastic matrix is obtained by in situ polymerization of its low-viscosity monomer after impregnation of the fibrous structure.
This study focuses on the semi-crystalline polyamide 6 (PA6) obtained by anionic ring-opening polymerization of ε-caprolactam monomer by means of an activator and a catalyst. The PA6 synthesis is particular in that both chain polymerization and polymer crystallization occur. This is due to the possible synthesis temperature range that coincides with the crystallization temperature of PA6. The consequence of these simultaneous mechanisms is a strong coupling between both phenomena: crystallization kinetics depends on the increasing amount of available polymer chains during polymerization.
Control of the synthesis kinetic is mandatory because the both phenomena induce an increase of the reactive mixture viscosity. A higher processing temperature moderates the crystallization, but it accelerates the polymerization and may limit the infusion time. Moreover, the polymerization-crystallization coupling may affects the porosity of composites and the fiber-matrix adhesion. Its understanding and modeling is critical for predicting the reaction evolution whatever the thermal cycle applied in order to optimize the process.
The characterization of PA6 synthesis has been mainly performed at a bulk scale thanks to an adiabatic reactor [2, 3]. This is an inverse approach that consists in monitoring the temperature of the reactive mixture at the core of an insulated reactor during polymerization and crystallization. The main advantage of this approach is that several hundred grams of polymer are synthesized which ensures reactive mixture homogeneity. However, as both phenomena are exothermic, the separation of their contribution to the temperature increase is hardly possible without the use of complex kinetic modeling. Another drawback of this method is that it does not allow for isothermal synthesis, the thermo-dependence of phenomena is thus difficult to characterize.
On the other hand, the Differential Scanning Calorimetry (DSC) is an interesting method to follow the in situ synthesis at a smaller scale. First studies have mainly been focused on the influence of the nature and concentration of catalysts on reaction kinetics [4, 5]. Syntheses were performed under a few representative conditions in order to highlight the coupling or separation of polymerization and crystallization. But this is only recently by Khodabakhshi et al. [6] that PA6 reactive mixtures have been investigated by DSC over a wide range of isothermal and non-isothermal conditions. However, they focused on mixtures designed for 3D inkjet printing involving a very high concentration of catalysts for a rapid reaction. The literature then lacks kinetic data on reactive mixtures dedicated to composite manufacturing.
From the modeling point of view, first mechanistic models of the PA6 synthesis have been developed in the 60’s [7] and considered each step of the reaction (initiation, propagation, side-reactions like catalyst degradation, ramification, etc.) . They have been progressively replaced by semi-empirical global models which consider the reaction as a whole. The works of Malkin et al. [8] are the first to describe anionic PA6 polymerization, its associated crystallization and their coupling. The modified version of Camargo et al. [9] remains the key reference to this day. It has been reused by many authors [2, 3, 10-12] although several enhancements have been proposed in the literature: modification of the polymerization model by Lin et al. [11], use of the Kamal-Sourour model by Teuwen [2] and Russo et al. [13] and modification of the crystallization model [10, 12].
This study investigates and proposes a modeling of the coupled polymerization-crystallization of PA6 from ε-caprolactam under isothermal conditions based on a complete DSC campaign. The reactive mixture selected presents a polymerization kinetic that suits with liquid molding process. The final monomer conversion has been determined by TGA [14] based on evaporation of residual monomer after polymerization. DSC and WAXS have been used to characterize the degree of crystallinity and microstructure of synthesized semi-crystalline PA6. An original coupled model of polymerization and crystallization is presented and TTT diagrams are edited.
2 EXPERIMENTAL STUDY OF THE SYNTHESIS 2.1 Materials
All reactants have been kindly supplied by Brüggemann Chemical, Germany. The products used for the anionic ring opening polymerization of PA6 are the ε-caprolactam monomer “AP-NYLON®” (moisture content of < 150 ppm), caprolactam magnesium bromide as catalyst (MgBrCL – “Nyrim C1®” 1.4 mol.kg-1 in caprolactam) and difunctional hexamethylene-1,6-dicarbamoylcaprolactam as activator (HDCL – “Brüggolen C20P®” 2.0 mol.kg-1 in caprolactam). Since the reaction is sensitive to moisture [35], products were dried overnight at 35°C under vacuum prior to mixture preparation and all subsequent handling was performed in an inert atmosphere to prevent any moisture uptake.
The reactive mixture was prepared by molten reactants under stirring. The ratio MgBrCL/HDCL used was 0.79/1.10 mol.% of CL. Once homogeneous, batch was quenched in liquid nitrogen to prevent early reaction. The product was then stored in a sealed pot at -18°C before sampling.
2.2 Isothermal synthesis in DSC
Isothermal PA6 syntheses were performed with few milligrams of reactive mixture in a power-compensated DSC. Samples were heated at 300°C/min to different isothermal temperature Tiso between
130 and 200°C (every 10°C) and kept until the full conversion. Figure 1 shows one representative DSC curve of each condition. The morphology of DSC curves changes over the investigated temperature range. Syntheses at 200°C lead to one sharp exothermic peak, while at 180°C and 190°C two distinct peaks are obtained. Between 150 and 170°C, syntheses are characterized by one dissymmetric peak with a shoulder; and at 130°C and 140°C the DSC scans exhibit a double exothermic peak with a first maximum at the early stage of the reaction.
These exothermic peaks correspond to the polymerization and crystallization of PA6. The polymerization is necessary the first mechanism since the monomer cannot crystallize at those temperatures. On the curves at 180 and 190°C, the first maximum is due to polymerization and the second to crystallization. Separation of phenomena is a consequence of the slow crystallization kinetic at high temperature due to the low undercooling.
Figure 1: DSC curves of isothermal syntheses of PA6
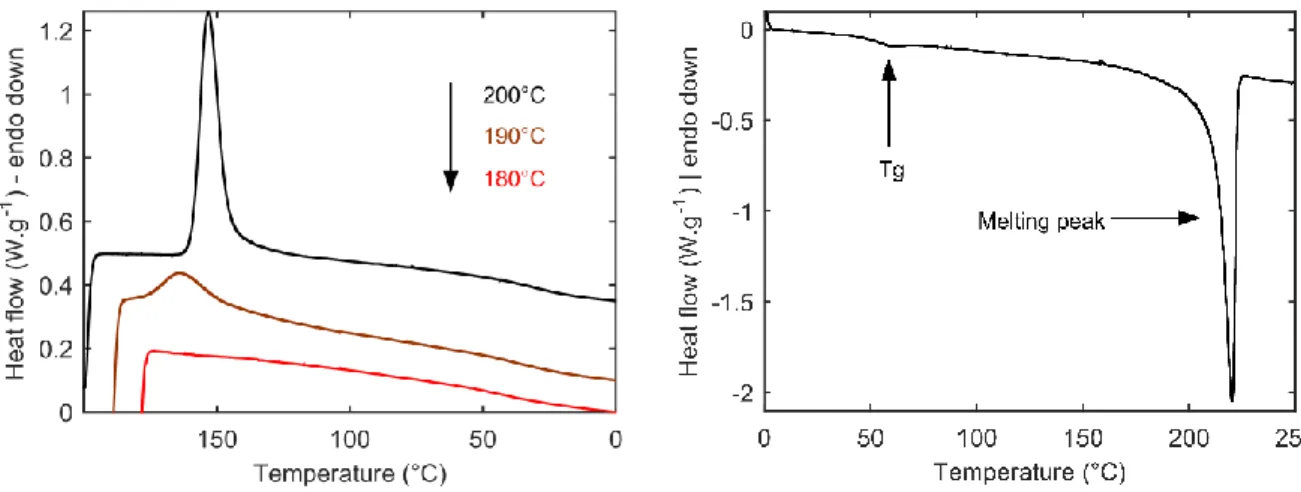
In order to understand the synthesis process, the samples were cooled from Tiso to 0°C at -10°C/min
at the end of isotherm and then heated at 10°C/min until 270°C. Representative DSC scans of the cooling phase are shown in Figure 2a for three different Tiso and Figure 2b shows a representative melting curve
of PA6 after polymerization at 150°C. This later exhibits a sharp melting peak at around 220°C and is typical of all synthesis temperatures.
Figure 2: DSC scans of the cooling step the cooling step (a), heating (b)
Even if all polymers melt during this last heating scan, the exothermic peaks on curves in Figure 2a indicate that the crystalline structure was not systematically formed during the isothermal stage. In particular for a Tiso of 200°C, the sharp crystallization peak and the distinct baseline above the peak
reveal that PA6 crystallization only occurs during the cooling step. The single exothermic peak observed during syntheses at 200°C then only corresponds to the polymerization (Figure 1a).
After the isotherm at 190°C, a smaller crystallization peak starts right at the beginning of the cooling phase (Figure 2a). Since two distinct peaks appear during the synthesis among which one is due to isothermal crystallization, the crystallization during cooling is thus partial and completes the crystalline structure previously formed.
For lower temperatures, i.e. between 130 and 180°C, no exothermic peak is observed during cooling, meaning that the crystallization is achieved during the isothermal stage. The single dissymmetric peak obtained between 130 and 170°C results of the simultaneous crystallization. Since the polymerization occurred at a low temperature, the high degree of undercooling involves a near-instantaneous crystallization of the growing chains. The polymerization kinetic slows down and determines the crystallization kinetic.
Total enthalpies ΔHtot of isothermal syntheses are summarized in Table 1. They include
polymerization and crystallization contributions even when two distinct peaks were observed. The lowest enthalpy is obtained during synthesis at Tiso 200°C since only the polymerization occurs. This
value is in good agreement with the enthalpy of polymerization reported in literature that is comprised between 130 and 147J/g depending on the reference used [4, 15, 16]
For the lowest temperatures, crystallization gives rise to a significant increase of ΔHtot, with a
maximum at 150°C. However, it must be noticed that some variability is obtained at low temperature. It is thus considered that the reaction globally leads to a high enthalpy at any condition below Tiso 150°C.
Tiso ΔHtot ΔHm Tm Xp∞ [°C] [J/g] [J/g] [°C] [wt.%] 130 196.3 ± 11.1 95.7 217.9 91.9 140 205.6 ± 14.5 100.0 218.9 93.3 150 219.8 ± 3.3 100.6 220.2 95.1 160 211.9 ± 1.8 93.0 218.5 94.5 170 198.4 ± 8.3 81.0 215.2 95.6 180 194.7 ± 6.3 72.8 215.6 96.8 190 142.3 ± 10.1 - 214.7 95.8 200 121.7 ± 4.5 - 202.2 95.1
Table 1: Reaction enthalpies and degree of conversion obtained on isothermal synthesis 2.3 Characterization of the synthesized PA6
In order to characterize the synthesized polymer, the final degree of conversion Xp∞ was measured
by TGA by evaporating the residual amount of ε-caprolactam contained in samples. Results in table 1 show a degree of conversion between 92 and 97 wt.%, which means that the polymerization is almost complete regardless of the condition applied.
Degree of crystallinity are characterized by the melting enthalpy ΔHmobtained in DSC during the
heating ramp at 10°C/min. For the sake of comparison, ΔHm in Table 1 are only given for samples which
crystallization was fully achieved during the polymerization stage, i.e. from 130 to 180°C. The values obtained show that a low synthesis temperature favors the crystallization while above 160°C, the low degree of undercooling limits progressively the ability of PA6 to crystallize.
Samples were also analyzed by X-Ray Diffraction (WAXS) in order to characterize the crystalline structure formed during the synthesis. Two main peaks are distinguished at 2θ = 20° and 2θ = 24° correspond respectively to the diffraction planes (200) and (002)-(202) of the thermodynamically stable α-type crystalline structure [17]. This phase is generally connected with the formation of high-order superstructures, like spherulites, and ensures high mechanical properties.
2.4 Study of the crystallization from the molten state of the synthesized PA6
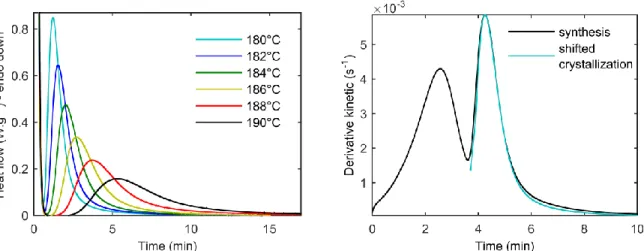
In order to compare the crystallization process during synthesis to the one from the molten state, the isothermal crystallization kinetic of a sample synthesized at Tiso 150°C was characterized by DSC from
the molten state. The sample was heated above the thermodynamic equilibrium temperature of the PA6 crystal, i.e. TmO = 260°C, and cooled at -150°C/min to different isothermal temperatures between 180
and 190°C (every 2°C). The isothermal step was maintained until the complete crystallization, then the sample was cooled rapidly to 0°C. A heating ramp to 270°C at 10°C/min was performed to characterize the melting of the crystals formed. Figure 3a shows the crystallization obtained for each temperature.
It appears that the crystallization slows down when the temperature increases, which is in agreement with the influence of the degree of undercooling. The dissymmetry of the peaks also reflects a kinetic slowdown at the end of crystallization which suggests the existence of a secondary crystallization.
Figure 3b shows the superposition of the crystallization curve at 180°C from the molten state with the second peak of the synthesis curve at the same temperature (corresponding to the crystallization). It is found that when the crystallization occurs separately from the polymerization, its kinetics corresponds to the one obtained from the molten state. The same observation was made for the synthesis at 190°C, which suggests that the crystallization process is similar during synthesis and from the molten state.
Figure 3: DSC scans of crystallization from molten state (a) isothermal steps, (b) synthesis superposition at 180°C
3 MODELING OF COUPLING POLYMERIZATION/CRISTALLIZATION 3.1 Definition of kinetics α, β, γ
Modeling the exothermic reaction of synthesis amounts to modeling the overall reaction kinetic γ, which includes polymerization α and crystallization β. This normalized global kinetic is determined experimentally from the heat flux determined by DSC according to equation 1.
𝛾(𝑡) =𝑞(𝑡) 𝑄𝑡𝑜𝑡 = ∫ 𝑑 𝑑𝑡𝐻(𝑡)𝑑𝑡 𝑡 0 ∫0∞𝑑𝑡𝑑 𝐻(𝑡)𝑑𝑡 (1)
3.2 Decoupled polymerization kinetics
Polymerization kinetic is modeling with the Malkin’s model, modified by Camargo et al.
[9]
(Equation 2). It has four parameters:
A0 [s-1], which is a constant representative of the number ofcollisions between molecules, B0 [-] an autocatalytic factor, np [-] the order of reaction and Ea [J.g-1] the
activation energy of the reaction 𝑑𝛼 𝑑𝑡 = 𝐴0(1 − 𝛼) 𝑛𝑝(1 + 𝐵 0𝛼)𝑒𝑥𝑝 (− 𝐸𝑎 𝑅𝑇) (2)
3.3 Decoupled crystallization kinetic
The experimental study of PA6 shows that crystallization processes during synthesis and occurring from the melting state are similar. Models specifically developed for PA6 synthesis by Malkin et al. [8, 18] have been abandoned in favor of conventional models describing the crystallization from the molten state of thermoplastic polymer. Among the different models of the literature, the Johnson-Mehl-Avrami model (JMA), based on the generalized form of Avrami, was chosen because it allows to simply model isothermal and non-isothermal kinetics thanks to single model (Eq. 3).
𝑑𝛽 𝑑𝑡(𝑡 − 𝑡𝑐,0) = 𝑛 𝐾(𝑇)(1 − 𝛽)𝑙𝑛 ( 1 1 − 𝛽) 𝑛−1 𝑛 (3) Where K [s-1] is a kinetic constant thermo-dependent which is described with a Hoffman-Lauritzen
relation type [19], n [-] the Avrami constant representing the type of nucleation/growth and tc,0 [s]
initiation time of crystallization. Crystallization kinetic calculated with the JMA model is compared with experimental results on figure 4. The JMA model fits correctly experimental curves, except at the end of crystallization where a secondary crystallization appears.
Figure 4: Crystallization modeling from molten state
3.4 Coupling model
In the literature, the only coupling used for the synthesis of reactive PA6 is the one proposed by Bolgov [4], which describes the overall heat flux q in two terms attributed to the two phenomena polymerization α and crystallization β (Eq. 4).
𝑑𝑞 𝑑𝑡 = 𝑄𝑝 𝑑𝛼 𝑑𝑡 + 𝑄𝑐 𝑑𝛽 𝑑𝑡𝛼(𝑡) (4)
Qp and Qc [J.g-1] correspond respectively to total polymerization enthalpy and crystallization
enthalpy, which are dependent of polymerization kinetic and crystallization kinetic. This coupling reflects the fact that at each new increment of polymerization, the formed phase is involved in the crystallization progress. However the use of the JMA crystallization model with the Bolgov coupling does not allow to correctly model the synthetic kinetics, in particular the shoulders observed during the syntheses at Tiso < 170°C.
In order to improve the coupling between the polymerization and crystallization, the equation 5 was used. It is based on the form proposed by Hillier for taking into account the secondary crystallization process during the crystallization of thermoplastic polymers [20]. This coupling assumes that the
polymerized phase at each increment follows its own crystallization kinetic with its initiation time and its growth kinetic.
𝑄𝑡𝑜𝑡 𝛾(𝑡) = 𝑄𝑝 𝛼(𝑡) − 𝑄𝑐∫ 𝛼(𝜃) 𝑑 𝑑𝜃𝛽(𝑡 − 𝜃 − 𝑡𝑐,0)𝑑𝜃, 𝑖𝑓 (𝑡 − 𝜃 − 𝑡𝑐,0) > 0 0, 𝑖𝑓 (𝑡 − 𝜃 − 𝑡𝑐,0) ≤ 0 𝑡 0 (5)
The results obtained for the syntheses at 150°C and 190°C (figure 5) show that this form of coupling correctly predicts the crystallization kinetic when it is separated from the polymerization, like at 180°C and 190°C. However this formulation does not allow the prediction of shoulders related to crystallization observed at 150°C and 170°C. Indeed the instantaneous crystallization starts at the same time then the polymerization, which totally attenuates the occurrence of shoulders.
Figure 5: Modeling with equation 5 syntheses at (a) 150°C, (b) 190°C
At the beginning of the polymerization, the growing chains are too short to be able to fold up on themselves. The crystallization takes place between chains, which must first diffuse in a medium composed mainly of monomer. To take this phenomenon into account, a diffusion factor was introduced into the coupling in a manner similar to the formulation used in the thermosetting crosslinking models [21], which transcribes the diffusion of the monomer within a densely reticulated network (Eq. 6):
𝑓𝑑(𝛼) = 1 −
1
1 + 𝑒𝑥𝑝 (𝐶(𝑇)(𝛼 − 1) + 𝐷(𝑇)) (6) Injected in equation 5, this coupling becomes equation 7:
𝑄𝑡𝑜𝑡 𝛾(𝑡) = 𝑄𝑝 𝛼(𝑡) − 𝑄𝑐𝑓𝑑(𝛼, 𝑇) ∫ 𝛼(𝜃) 𝑑 𝑑𝜃𝛽(𝑡 − 𝜃 − 𝑡𝑐,0)𝑑𝜃, 𝑖𝑓 (𝑡 − 𝜃 − 𝑡𝑐,0) > 0 0, 𝑖𝑓 (𝑡 − 𝜃 − 𝑡𝑐,0) ≤ 0 𝑡 0 (7)
The superposition of the kinetics predicted by the model at 150°C with the experimental results in figure 6 demonstrates the advantage of this diffusion factor: a crystallization peak is superimposed on the wider polymerization peak, thereby generating shoulder observed on the experimental curve.
Figure 6: Modeling with equation 7 at 150°C
3.5 TTT diagram
Thanks to the complete modeling of the isothermal synthesis of reactive PA6, the isothermal TTT diagram was edited (figure 7) in isoconversion of the degree of conversion Xp and of crystallization Xc
(with ΔHc100%=230 J/g). The very strong coupling existing for the lowest synthesis temperatures
(130-150°C) between the two phenomena appears distinctly, since the crystallization is limited by the progress of the polymerization. The higher the temperature, the more the two phenomena separate (acceleration of polymerization, slowing of crystallization), until a limit temperature of 190°C is reached in crystallization beyond which the newly formed chains do not crystallize.
Figure 7: TTT diagram (blue: degree of conversion Xp, green: degree of crystallization Xc)
4. CONCLUSION
PA6 synthesis in the context of a reactive liquid molding for thermoplastic composites manufacturing has been studied experimentally and a synthesis kinetic model is proposed. DSC allows to carry out isothermal syntheses and to obtain a fine characterization of the kinetics of polymerization and crystallization as well as their temperature dependencies. The degree of conversion and the crystallinity obtained were characterized by ATG, DSC and WAXS. These analyzes revealed a high transformation efficiency, a very high crystallinity rate between 130 and 160°C and the formation of a main α-type crystal phase. In addition, a study of the kinetics of crystallization from the molten state has shown that the crystallization kinetic during synthesis was similar to the one occurring from the molten state.
A kinetic synthesis model is proposed in which the crystallization is based on a JMA model and on the Malkin polymerization model. A coupling based on the Hillier formulation and incorporating a thermo-dependent diffusion factor is proposed. This formulation is effective for predicting the various phenomena observable on the kinetic curves. The isothermal TTT diagram was published for the purpose of using PA6 for the reactive thermoplastic composite manufacturing.
5. PERSPECTIVES
An experimental study of the polymerization and crystallization of PA6 in a fibrous medium must be carried out to determine the influence of this confinement on the reaction kinetics. This influence will then be taken into account in our models.
These models of reactions will then be implemented in a multi-physics model of simulation, at the scale of process, of resin injection in a fibrous reinforcement [22]. These models take into account resin flows and heat transfers. The influence of these reactions, which will modify the viscosity of the polymer and the temperature of the system during the injection, is studied in reference cases that we have developed.
ACKNOWLEDGEMENTS
Brüggemann Chemical, Germany are acknowledged for kindly supplying reactants. REFERENCES
[1] K. van Rijswijk, Thermoplastic composite wind turbine blades - Vacuum infusion technology for
anionic polyamide-6 composites, PhD thesis, Technische Universiteit Delft, Avril 2007.
[2] J. Teuwen, Thermoplastic composite wind turbine blades - Kinetics and processability, PhD thesis, Technische Universiteit Delft, 2011.
[3] R.S. Davé, K. Udipi, R.L. Kruse, and L.R. Stebbins, Polyamides from lactams via anionic ring-opening polymerization: 2, kinetics. Polymer, 38(4), 1997, pp. 939-947.
[4] S.A. Bolgov, V.P. Begishev, A.Ya. Malkin, and V.G. Frolov, Role of the functionality of activators during isothermal crystallization accompanying the activated anionic polymerization of e-caprolactam, Polymer Science U.S.S.R., 23(6), 1981, pp. 1485-1492.
[5] D.L. Wilfong, C.A. Pommerening, and Z.G. Gardlund, Separation of polymerization and crystallization processes for nylon-6, Polymer, 33(18), 1992, pp. 3884-3888.
[6] K. Khodabakhshi, Anionic Polymerisation of caprolactam: an approach to optimising the
polymerisation conditions to be used in a jetting process, PhD thesis, Loughborough University,
2011.
[7] H.K. Reimschuessel, Ring-Opening Polymerization, chapter 7, Kinetics of Hydrolytic Polymerization, pages 303–326, Marcel Dekker, 1969.
[8] A.Ya. Malkin, V.P. Beghishev, I.A. Keapin, and Z.S. Andrianova, General treatment of polymer crystallization kinetics - part 2, The kinetics of nonisothermal crystallization, Polymer
Engineering & Science, 24(18), 1984, pp. 1402–1408.
[9] R.E. Camargo, V.M. Gonzalez, C.W. Macosko, and M. Tirrell, Bulk polymerization kinetics by the adiabatic reactor method, Rubber Chemistry and Technology, 56(4), 1983, pp. 774-783. [10] K.J. Kim, Y.Y. Kim, B.S. Yoon, and K.J. Yoon, Mechanism and kinetics of adiabatic anionic
polymerization of e-caprolactam in the presence of various activators, Journal of Applied Polymer
Science, 57(11), 1995, pp. 1347-1358.
[11] D.J. Lin, J.M. Ottino, and E.L. Thomas, A kinetic study of the activated anionic polymerization of ε-caprolactam, Polymer Engineering & Science, 25(18), 1985, pp. 1155-1163.
[12] K.H. Lee and S.C. Kim, Reaction-induced crystallization kinetics during the anionic polymerization of ε-caprolactam, Polymer Engineering & Science, 28(1), 1988, pp. 13-19. [13] S. Russo, S. Maniscalco, P. Moretti, and L. Ricco, Fast-activated anionic polymerization of
ε-caprolactam in the bulk under quasi-adiabatic conditions: Comparison of different kinetic models,
[14] C.-L. Zhang, L.-F. Feng, and G.-H. Hu, Anionic polymerization of lactams: A comparative study on various methods of measuring the conversion of ε-caprolactam to polyamide 6, Journal of
Applied Polymer Science, 101(3), 2005, pp. 1972-1981.
[15] O. Wichterle, J. Tomka, and J. Sebenda, Alkalische polymerisation des 6-caprolactams xii. Ãœber die polymerisation von 6-caprolactam und die kristallisation des gebildeten polymeren unter adiabatischen bedingungen, Collect. Czech. Chem. Commun, 1964.
[16] Z. Bukac, P. Cefelin, D. Doskocilova¡, and J. Sebenda, Alkaline polymerization of 6-caprolactam, xviii, Equilibrium between monomer and polymer, 29, 1964, pp. 2615-2625. [17] K.-H. Illers, Polymorphie, kristallinitat und schmelzwarme von poly(ε-caprolactam), Makr, 179,
1978, pp. 497-507.
[18] A.Ya. Malkin, V.P. Beghishev, I.A. Keapin, and S.A. Bolgov, General treatment of polymer crystallization kinetics - part 1, A new macrokinetic equation and its experimental verification,
Polymer Engineering & Science, 24(18), 1984, pp. 1396-1401.
[19] J.D. Hoffman and J.I. Lauritzen, Crystallization of bulk polymers with chain folding: theory of growth of lamellar spherulites, Journal of Research of the National Bureau of Standards, 1961. [20] I. H. Hillier, Modified Avrami equation for the bulk crystallization kinetics of spherulitic
polymers, Journal of Polymer Science Part A: General Papers, 3(9), 1965, pp. 3067-3078. [21] J. Fournier, G. Williams, C. Duch, and G.A. Aldridge, Changes in molecular dynamics during
bulk polymerization of an epoxide-amine system as studied by dielectric relaxation spectroscopy,
Macromolecules, 29(22), 1996, pp. 7097-7107.
[22] R. Gantois, A. Cantarel, B. Cosson, G. Dusserre, J.-N. Félices, F. Schmidt, BEM-based models to simulate the resin flow at macroscale and microscale in LCM processes, Polymer Composites, 34 (8), 2013, pp. 1235-1244