HAL Id: hal-01643398
https://hal.archives-ouvertes.fr/hal-01643398
Submitted on 19 Dec 2017
HAL is a multi-disciplinary open access
archive for the deposit and dissemination of
sci-entific research documents, whether they are
pub-lished or not. The documents may come from
teaching and research institutions in France or
abroad, or from public or private research centers.
L’archive ouverte pluridisciplinaire HAL, est
destinée au dépôt et à la diffusion de documents
scientifiques de niveau recherche, publiés ou non,
émanant des établissements d’enseignement et de
recherche français ou étrangers, des laboratoires
publics ou privés.
Production of green juice with an intensive
thermo-mechanical fractionation process. Part II: Effect
of processing conditions on the liquid fraction properties
S. Kerfai, A. Fernandez, S. Mathe, S. Alfenore, Patricia Arlabosse
To cite this version:
S. Kerfai, A. Fernandez, S. Mathe, S. Alfenore, Patricia Arlabosse. Production of green juice with
an intensive thermo-mechanical fractionation process. Part II: Effect of processing conditions on
the liquid fraction properties. Chemical Engineering Journal, Elsevier, 2011, 167 (1), pp.132-139.
�10.1016/j.cej.2010.12.011�. �hal-01643398�
Production of green juice with an intensive thermo-mechanical fractionation
process. Part II: Effect of processing conditions on the liquid fraction properties
S. Kerfai
a,b,c,∗, A. Fernández
a,b,c, S. Mathé
a,b,c, S. Alfenore
a,b,c, P. Arlabosse
d,eaUniversité de Toulouse, INSA, UPS, INP, LISBP, 135 Avenue de Rangueil, F-31077 Toulouse, France
bINRA, UMR792 Ingénierie des Systèmes Biologiques et des Procédés, F-31400 Toulouse, France
cCNRS, UMR5504, F-31400 Toulouse, France
dUniversité de Toulouse, Mines Albi, CNRS, Campus Jarlard, F-81013 Albi, France
eEcole des Mines Albi, Centre RAPSODEE, Campus Jarlard, F-81013 Albi, France
Keywords: Green juice Valorisation TAMD process Physico-chemical characterisation Rubisco HPLC SEC analysis a b s t r a c t
The thermally assisted mechanical dewatering (TAMD) process proved to be efficient to dewater various biomasses. The main idea of this process is to supply heat by conduction through the press walls during the wet fractionation. Applied to spinach leaves, this process led to energy saving but also to a larger amount of green juice. In order to optimize the TAMD process and to evaluate the valorisation potential of the liquid fraction produced, the physico-chemical characteristics of the green juice were investigated. In addition to conventional characterisation methods, an analysis method specific to Rubisco pro-tein (ribulose-1,5-bisphosphate carboxylase/oxygenase) has been developed in the present work. The method enables detection and quantification of Rubisco in green juice samples by using size exclusion chromatographic principles (HPLC SEC).
Global methods showed that cut degree of the biomass leaves has an effect on the liquid fraction produced. Indeed, nitrogen content, green and white proteins contents are higher when leaves are finely cut.
The investigation of temperature processing effect on juice characteristics by applying the different characterisation methods leads to:
- At high temperature (90◦C), low nitrogen and fractionated proteins contents in juice, which means that an enriched press cake is produced.
- At medium temperature (50◦C), higher nitrogen content in juice, which means that a polypeptides-rich liquid I produced.
- At low temperature (30◦C), HPLC SEC method developed revealed that TAMD process produced a green juice containing biomolecules of high added value such as Rubisco protein.
1. Introduction
According to the principle of sustainability, a modern soci-ety should preserve non-renewable energy sources and replace them with renewable energy. Biorefinery is widely defined as “the sustainable processing of renewable biomass into a variety of value-added products (chemicals, materials, food and feed) and energy (biofuels, power and heat)”[1]. Biorefineries usually process
agri-∗ Corresponding author at: Université de Toulouse, INSA, UPS, INP, LISBP, 135 Avenue de Rangueil, F-31077 Toulouse, France. Tel.: +33 561 55 97 91;
fax: +33 561 55 97 60.
E-mail address:syrine.kerfai@insa-toulouse.fr(S. Kerfai).
culture or forest biomass such as sugar and starch crops, vegetable oils, grasses, whey, lignocellulosic materials and different organic wastes such as municipal solid wastes and residues from the food production chain, to produce energy and a wide variety of chemical precursors and bio-based materials.
Renewable resources derived from biomass plants, also referred to as biofuel, bioenergy, or bioresources are sufficiently similar to fossil fuel to provide substitution. Especially, renewable grass resources derived from extensive land cultivation or other natural resources such as alfalfa, are excellent biorefinery raw materials[2]. Green biorefineries are dedicated to the processing of these green grasses.
The first processing step of the green biorefinery is the wet frac-tionation. This process separates the plant material under pressure
effect into two broad components: (1) water-insoluble components (press cake usually used for animal feed) and (2) carbohydrate-and protein-rich water-soluble fraction[3]. The liquid fraction is a nutrient-rich green juice containing proteins, free amino acids, organic acids, dyes, enzymes, hormones, further organic sub-stances, and minerals. This is the reason why it constitutes a raw material for several high value products such as lactic acid and corresponding derivatives, amino acids, ethanol, and proteins[4].
The thermally assisted mechanical dewatering (TAMD) process, designed since several years now in the RAPSODEE Research Center, proved to be efficient to dewater various biomasses under a variety of processing conditions ranging from 21 to 90◦C and from 300 to 3000 kPa[5]. The main idea of this process is to supply heat by conduction through the press walls during the wet fractionation. It has been illustrated that, when applied to alfalfa, the TAMD process can remove up to 69% of the inherent liquid fraction with a one-stage thermally assisted compression[6]and up to 83% with a two-stage thermally assisted compression[7]. As the extraction yield of conventional process with prior pulping amounts to 55%, the TAMD process is able to produce a much larger amount of green juice. Besides, the use of the TAMD process before the drying of the dewatered alfalfa cake leads to an energy saving of at least 30% on the overall separation chain. Indeed, the energy consumption of the TAMD process is less than 150 kWh/m3[8].
In addition to the energy consumption reduction, recovering high value co-products from the liquid fraction is a real chal-lenge for biorefineries industries to increase the sustainability and the profitability[3]. The relative abundance of proteins in leaf material and the basic need for protein in the human diet are the main reasons for scientists concern to focus on proteins recovery from vegetable biomass. From 1970s on, several develop-ments have been directed toward production of human food grade Leaf Protein Concentrate (LPC) from green juice[9–12]. These last years, several vegetable biomasses revealed their intrinsic value and potentialities as biorefineries feedstocks. The wet fractiona-tion process of alfalfa biomass for example has been the subject of many researches[13–15]. A valorisation process by thermal coag-ulation and centrifugation was used to recover some compounds, especially proteins an peptides. The final product was a (92% (w/w) moisture) powder containing 82% (w/w) protein and was exclu-sively used as animal feed[16]. d’Alvise[17]and Kapel et al.[18] used enzymatic hydrolysis to produce proteins from an industrial alfalfa soluble protein concentrate.
The TAMD process is likely to extract green juice in larger quan-tities than conventional fractionation processes. Furthermore, the liquid fraction composition will probably vary depending on the operating conditions of the TAMD process. Indeed, some of the green juice components have a low resistance to thermal treat-ments. In addition, the mechanisms of water transportation in plant cells are related to temperature[6], so the green juice composition can be used for process control. Besides, the valorisation potential of the liquid fraction produced by biomass dehydration depends on its biomolecules content and their characterisation is necessary to define the most adapted valorisation process. Therefore, global and specific characterisation methods development allows not only a specific valorisation but also a control of the dewatering process.
To date, in the wet fractionation plant, the green juice has been only characterised by its protein content determined by its nitroge-nous matter according to Kjeldahl analysis (Procedure V18-100; AFNOR, 1985)[19]. Starke et al.[2]developed a qualitative and quantitative analysis of carbohydrates in green juices by gas chro-matography/mass spectrometry. More specific analysis of the green juice was performed by proteomics. Studies of genome products and establishment of proteome maps of alfalfa juice were inves-tigated by Incamps et al.[19]. However no specific quantitative method is available in the literature.
For green biomass, the chlorophyll, xantophyll, carotene and other fatty materials like hydrophobic proteins of leaves (com-monly called green), are contained in small bodies in cells of leaf, called chloroplasts. These chloroplasts are suspended in the liquid cell which contains a hydrophilic protein mixture. The hydrophilic proteins have been designed as white proteins although a part of it comes from broken chloroplasts[20]. Purification and technolog-ical evaluation of the main hydrophilic protein of leaves Rubisco (ribulose-1,5-bisphosphate carboxylase/oxygenase, EC 4.1.1.39) has been the subject of several studies. Rubisco is one of the largest proteins in nature. It is a globular protein and in higher plants having molecular weight (MW) close to 560 kDa. The gen-eral structure of Rubisco is L8S8-eight large subunits with MWs around 56 kDa and eight small subunits with MWs close to 14 kDa. Four dimers of the large subunit constitute a core of eight large subunits with a 4-fold axis of symmetry and a barrel-like gen-eral shape[21,22]. Owing to its natural abundance in chloroplasts and its physico-chemical properties, this protein could be obtained with a good yield and a high level of purity[22]. Separation of the white hydrophilic protein fraction from the cell wall components opens opportunities of products marketing for ruminant and non-ruminant organisms, furthermore, recovering of Rubisco fraction offers potentialities to enzymatic activity application such as its immobilisation for a carbon dioxide fixation bioprocess[23].
The aim of this work was to characterise the composition of the green juices produced by TAMD process in order to evaluate their potential of valorisation but also to evaluate their capacity for pro-cess control. Physico-chemical properties of green juices produced by the TAMD process applied to spinach leaves were investi-gated. The choice of Spinach leaves as green vegetable biomass, for this study, is due to the availability of partially purified Rubisco extracted from this plant. Partially purified Rubisco of Spinach, commercialised in powder form, was thus considered as a reference for the development of qualitative and quantitative characteri-sation methods. Global charactericharacteri-sation, such as fractionation of juice proteins according to their hydrophobicity and total nitrogen content were also carried out. A method of detection and quan-tification of Rubisco in the wet fraction by HPLC size exclusion chromatography was developed to highlight the effects of operat-ing conditions on this protein and to optimize the TAMD process for their production. Finally sodium dodecyl sulphate polyacrylamide gel electrophoresis (SDS-PAGE) was carried out to check the two Rubisco subunits presence.
2. Material and methods 2.1. Vegetable material
Green juice samples were produced with the TAMD process, according to the protocol described by Arlabosse et al.[6], from spinach leaves cut at different degrees and produced under con-stant temperature from 30 to 90◦C. Three cutting levels were considered: none (whole leaves), coarse (leaves chopped into pieces of 3 cm × 3 cm) and fine (leaves chopped into 0.5 cm broad bands). The samples were immediately frozen (−20◦C) after production and defrozen at 6◦C before characterisation.Fig. 1 sum-marises the steps of biomass fractionation and physico-chemical characterization that have been followed in this work.
2.2. Biomolecules
Molecular weight marker proteins used for HPLC size exclusion chromatography (HPLC SEC) were from Amersham-Pharmacia. These proteins and their molecular weights (MWs) are given in Table 1.
Fresh biomass Pre-treatment (Stems cutting) Solid fraction TAMD (P 3 bar, 30°C<T<90°C) Centrifugation Brown juice Physico-chemical characterisation : Fractionation Identification and quantification of Rubisco Dry matter, Suspended matter, pH Total nitrogen Conductivity Green juice
Fig. 1. Global layout of spinach fractionation and physico-chemical characterisation steps.
Molecular weight markers from Bio-Rad, mentioned inTable 2, were used for sodium dodecyl sulphate polyacrylamide gel elec-trophoresis analysis.
Commercial Rubisco from Spinach (Sigma Aldrich, France) were used in this work as a reference for detection and quantification of Rubisco in the juice samples. This protein is commercialised as a partially purified powder, soluble in 1 M Tris HCl, pH 7.8.
To estimate the purity of the commercial Rubisco, dialysis treat-ment was carried out to remove all compounds of molecular weight lower than 300 kDa. Rubisco solution was dialysed for 30 h at 4◦C with a dialysis membrane from Biovalley (France) of 300 kDa molecular weight cutt-off. The purity of Rubisco solution was esti-mated as being 70%.
2.3. Conventional methods
The pH and the electrical conductivity were measured prior any juice sample characterisation. Dry solids content and suspended matter were then determined for each sample according to the AFNOR standard protocols 90–105 [24]. The juice was dried at 105◦C for 24 h. Suspended matter was eliminated by centrifugation at 5000 × g for 10 min to remove cell debris.
2.3.1. Nitrogen content
Total nitrogen content was determined in crude juice samples by the Kjeldhal procedure[19]with Büchi K-425 and K-350 (Büchi Rungis, France) equipments. Raw juice samples were diluted in deionised water. As commonly seen for biomass proteins[18,25], a factor of 6.25 was used to convert nitrogen into proteins.
2.3.2. Proteins fractionation
Alfalfa proteins are divided into two main groups which are hydrophobic and hydrophilic proteins. The fraction of hydrophobic proteins is usually called “green” fraction because of the association of its proteins to coloured compounds such as chlorophyll and xan-tophyll, whereas hydrophilic proteins are called “white” proteins. At the laboratory scale, separation of hydrophobic from hydrophilic proteins often includes a precipitation step. Bahr et al.[26]proved that saturation close to 30% of ammonium sulphate allows green hydrophobic proteins precipitation while white hydrophilic pro-teins remain in solution. Precipitation of hydrophilic propro-teins fraction was demonstrated at 55% of ammonium sulphate by Hall et al.[27]. Rubisco generally precipitates at 50% saturation of (NH4)2SO4 though some small differences have been noticed between Rubiscos of different botanical origins[26]. For example, Rubisco from spinach, the only Rubisco commercialised as a par-tially purified powder by Sigma Aldrich, is prepared by ammonium sulphate fractionation followed by dialysis prior to lyophilisation.
Suspended matter free juice was fractionated by ammonium sulphate to separate “green” hydrophobic and “white” hydrophilic proteins. Ammonium sulphate was added to the juice sample to obtain a 27% saturated solution. The precipitated hydrophobic pro-teins were separated by centrifugation (15 min at 5000 × g). The pellet of hydrophobic proteins was washed with deionised water, dried at 105◦C and weighed. The supernatant was saturated to 55% with ammonium sulphate to precipitate hydrophilic proteins. The separation of white proteins was obtained by centrifugation for 15 min at 5000 × g and the pellet of hydrophilic proteins was washed, dried at 105◦C and weighed.
2.3.3. SDS-PAGE electrophoresis
As Rusbico is a multimeric protein, SDS-PAGE enables to visu-alise the large and small subunits. Comparison between bands of commercial Rubisco and bands of different juice samples produced with TAMD process will highlight differences in conformation, if any.
SDS-PAGE was carried out using a 15% resolving gel fol-lowing the procedure described by Laemmli [28]. Acrylamide, bisacrylamide, SDS, TEMED, ammonium persulfate and !-mercaptoethanol were purchased from Sigma Aldrich, France.
Electrophoresis procedure was performed for juice samples pro-duced from spinach leaves finely cut, at 30, 50, 70 and 90◦C, using the Mini Protean II Cell system (Bio-Rad, France). Gels were stained using Coomassie brilliant blue R-250.
Table 1
Molecular weight proteins marker used for HPLC SEC column calibration.
Protein Aprotinin Ribonuclease A Ovalbumin Conalbumin Aldolase Catalase Ferritin Thyroglobulin
MW (kDa) 6.5 13.7 43 72 128 232 440 669
Table 2
Molecular weight markers used for SDS-PAGE analysis.
Protein Phosphorylase b Bovine serum albumin Ovalbumin Carbonic anhydrase Soybean trypsin inhibitor Lysozyme
10 100 1000 10000 100000 1000000 10000000 14 13 12 11 10 9 8 7 6 Elution volume (ml) MW Proteins markers Rubisco
Fig. 2. Calibration curve of HPLC SEC column (Protein KW804 column, Shodex) car-ried out with proteins markers: Aprotinin, Ribonuclease A, Ovalbumin, Conalbumin, Aldolase, Catalase, Ferritin, Thyroglobulin. Rubisco molecular weight as a function of its elution volume is shown.
2.4. Rubisco analysis method
Specific method for Rubisco detection and quantification was developed. Among white hydrophilic proteins, Rubisco is the most abundant. Knowledge of Rubisco structure and its physico-chemical properties especially its molecular weight (MW) leads to conclude that Rubisco represents most probably the highest molecular weight protein among leaves white proteins. Therefore, size exclusion chromatography constitutes an adequate method to identify and quantify Rubisco in juice samples.
A silica-based (8 × 300) Protein KW804 column (Shodex, Tokyo, Japan) was selected. The column was firstly calibrated by analysing proteins of different molecular weight (seeTable 1), to establish the correlation between the elution volume and the molecular weight. Äkta purifier system (Amersham Biosciences, Uppsala, Sweden) was used. Analyses were carried out with an injection loop of 0.1 ml, with phosphate buffer solution 4 mM pH 6.8 and 25 mM Na2SO4 eluent at a flow rate of 1 ml/min. The analysis was coupled with a measurement of the absorbance at 280 nm by means of a UV detec-tor. Absorbance 254 and 210 nm were also carried out but were less specific to protein detection, especially Rubisco.
A column calibration curve consists on the relationship between the protein MW and the liquid volume used for the protein mov-ing in the column until its exclusion. This volume is called elution volume and is as high as the MW of the protein is low.Fig. 2shows the calibration curve of the HPLC SEC column carried out with the pure proteins mentioned before. It can be seen that the separation range of the HPLC SEC column is included between 8.3 and 11.7 ml. According to this calibrating curve, a molecular weight protein of 560 kDa is expected to be eluted from the column at 8.8 ml.
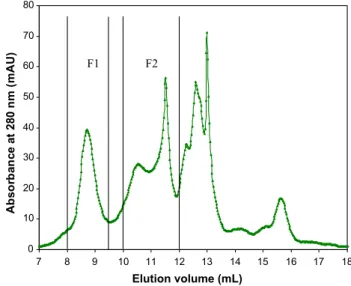
Commercial Rubisco from spinach was then analysed with this HPLC SEC protocol. Absorbance at 280 nm as a function of the elu-tion volume, called chromatogram, is plotted inFig. 3for Rubisco solution at 1 g L−1.
As expected, Rubisco solution was not pure since the chro-matogram revealed many absorbance peaks. The first absorbance peak F1, observed at an elution volume of 8.74 ml, corresponds to a molecular weight close to 570 kDa. Compounds eluted at higher volumes from 10 to 12 ml correspond to molecular weights ranging from 60 to 6 kDa. They constitute the fraction F2.
0 10 20 30 40 50 60 70 80 18 17 16 15 14 13 12 11 10 9 8 7 Elution volume (mL) Ab so rb an ce a t 28 0 n m ( m A U) F1 F2
Fig. 3. HPLC SEC chromatogram obtained for spinach Rubisco solution at 1 g L−1.
Sample volume is 0.1 ml, PBS eluent with a flow rate of 1 ml/min. F1 is the fraction having a MW close to 570 kDa and F2 is the fraction of MW between 60 and 6 kDa.
Compounds eluted at volumes higher than 12 ml correspond to molecular weights compounds lower than 6 kDa. Their MWs cannot be determined exactly since they are out of the separation range of the column. However, the scale of the chromatogram was extended until the baseline returns to zero.
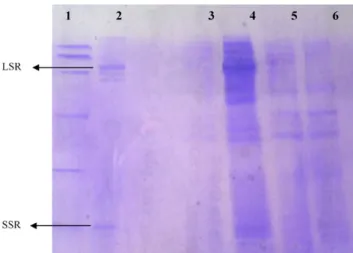
F1 and F2 fractions were collected separately from HPLC SEC column and analysed by SDS-PAGE. Fig. 4 shows the gel revealed with Coomassie blue after migration of Rubisco solution (in lane 3), F1 (in lane 4), F2 (in lane 5), lysozyme (in lane 2) and BSA (in lane 1).
When compared to protein markers, Rubisco solution presented one first band corresponding to a molecular weight of 58 kDa and a second band that appeared at the same level of lysozyme band (14 kDa). Intermediate MW bands were also detected in Rubisco lane migration. Migration of F1 on the SDS-PAGE showed only two bands at the same level of the two bands detected with Rubisco solution (of 58 and 14 kDa), while F2 showed the intermediate MW bands.
Fig. 4. Rubisco fractions analysis on SDS-PAGE 15%. From left to right: lane 1 BSA, lane 2 lysozyme migration, lane 3 commercialised spinach Rubisco, lane 4 F1, lane 5 F2. LSR: large subunit of Rubisco; SSR: small subunit of Rubisco.
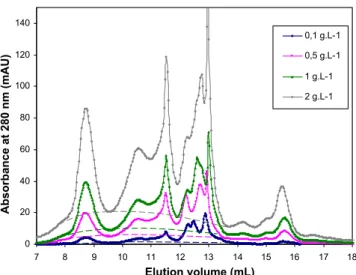
0 20 40 60 80 100 120 140 7 8 9 10 11 12 13 14 15 16 17 18 Elution volume (mL) Absorbance at 280 nm (mAU) 0,1 g.L-1 0,5 g.L-1 1 g.L-1 2 g.L-1
Fig. 5. HPLC SEC chromatograms obtained for spinach Rubisco solutions. Sample
volume is 0.1 ml, concentrations in Rubisco vary from 0.1 to 2 g L−1, PBS eluent with
a flow rate of 1 ml/min.
This seems coherent with HPLC SEC results. The first peak F1 detected in HPLC SEC analysis (eluted at 8.74 ml) corresponds probably to the purified Rubisco whereas F2 is concerned with compounds of lower MWs, between 58 and 14 kDa.
The HPLC SEC method developed seems able to detect Rubico protein in aqueous solution. The peak at an elution volume of 8.74 (±5%) was then considered as an indicator of the presence of Rubisco in green juice samples (Fig. 2).
In order to quantify Rubisco content in juice samples, a calibra-tion curve has been established by injeccalibra-tion of Rubisco solucalibra-tions, prepared by dissolution of the partially purified powder in 1 M Tris HCl pH 7.8 buffer, at different concentrations. The chromatograms obtained are shown inFig. 5.
Rubisco peak areas were calculated for each concentration with a baseline adjustment as shown in Fig. 5, since the amount of impurities increases when the concentration of the Rubisco solu-tion increases.Fig. 6presents the calibration curves performed for Rubisco solutions with different concentrations ranging from 0.1 to 2 g L−1. y = 0,0533x R2 = 0,998 0 0,5 1 1,5 2 2,5 0 10 20 30 40 Peak area
Theoretical Rubisco content (g.L
-1)
Fig. 6. Calibration curve: Rubisco peak area versus theoretical Rubisco content (from
0.1 to 2 g.L−1).
Table 3
Studied operating conditions of the TAMD process for green juice production.
Wall temperature of the press
50◦C 30◦C 50◦C 70◦C 90◦C Cutting level None Coarse Fine Fine Fine Fine Fine
Table 4
Characteristics of spinach juices produced from different degrees of leaf cutting with the TAMD process at 50◦C.
Temperature 50◦C
Cutting level None Coarse Fine
pH 6.7 6.5 6.6
Conductivity (mS cm−1) 18.9 19.0 20.7 Dry solid (g L−1) 37.2 38.6 32.1 Suspended matter (g L−1) 2.33 1.45 1.3 Total nitrogen (mg L−1) 1960 2450 2730 Total nitrogen (g proteins L−1) 12.25 13.56 15.31 Green proteins (g L−1) 4.01 3.68 3.11 White proteins (g L−1) 5.41 7.28 9.6 Total fractionated proteins (g L−1) 9.44 10.96 12.71
Rubisco concentration can be determined by the following equa-tion:
C = 53 × 10−3× A (1)
where A is the peak area, C is the Rubisco concentration in g L−1. To estimate the accuracy of the measures, Rubisco solutions of well-known concentration were injected and their concentrations were calculated by means of Eq.(1). The error was evaluated to 10%. This relationship was used for green juice to quantify Rubisco. Centrifuged juice samples, produced by the TAMD process, were then injected in the HPLC SEC column and their Rubisco content was determined.
3. Results and discussion
These characterisation methods were applied for the spinach juices produced by TAMD process at the different operating condi-tions summarised inTable 3.
In order to study the influence of the cutting and heat supply on the juice composition, the physico-chemical properties (pH, con-ductivity, dry solid, suspended matter and total nitrogen content) of the raw juice were firstly measured. Protein fractionation and HPLC SEC analysis were then carried out for juice samples free of suspended matter.
3.1. Biomass pre-treatment effect
As mentioned previously, the effect of physical structures of the biomass on the juice composition was investigated. Wall temper-ature was fixed at 50◦C to produce green juice by TAMD process. Three cuttings were considered for spinach leaves: none, coarse and fine.Table 4summarises the physico-chemical properties of the juices extracted from spinach leaves under these conditions.
For the three cutting levels of the spinach leaves, global physico-chemical parameters, such as pH, conductivity, dry matter and suspended matter, were similar for all samples. Cutting level has an influence on both the total nitrogen content, assumed as crude proteins content, and the white proteins content: crude and white proteins contents increased when spinach leaves are more finely cut. On the contrary, the cutting level does not change the green protein content.
This result can probably be explained by the localisation of the two kinds of proteins: white hydrophilic proteins are located in cells organist called stroma which are inside chloroplasts[29]. Thus,
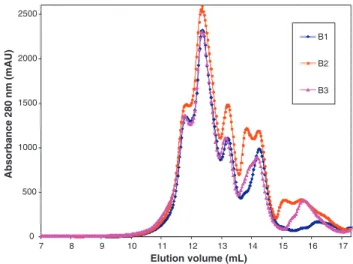
0 500 1000 1500 2000 2500 17 16 15 14 13 12 11 10 9 8 7 Elution volume (mL) Absorbance 280 nm (mAU) B1 B2 B3
Fig. 7. HPLC SEC chromatograms of juice samples produced at 50◦C from spinach
leaves with three cutting levels: B1: none, B2: coarse and B3: fine.
to extract this kind of proteins, cells must be disrupted as much as possible. Otherwise, green proteins constitute membrane proteins and do not need a mechanical extraction to be expressed from the leaf cells.
3.1.1. HPLC SEC characterisation
According to the protocol described in Section2, suspended matter free juices produced by dehydration of spinach stems cut at different levels, were analysed by HPLC SEC. The chromatograms obtained are plotted inFig. 7for samples at the three cutting levels. No peak appeared for an elution volume around 8.75 ml indi-cating the absence of Rubisco in the juices produced under these operating conditions: whatever the cutting level, green juice pro-duced at 50◦C did not contain Rubisco in native form.
3.2. Temperature effect
Juice samples produced at different temperatures with spinach leaves finely cut were then characterised. Table 5 summarises global physico-chemical properties of green juice extracted with a wall temperature set to 30, 50, 70 and 90◦C as is described by Arlabosse et al.[6].
For all juice samples, global physico-chemical properties such as pH, suspended matter and conductivity were similar. Process parameters studied are of low influence on these global properties which does not seem appropriate to control the process.
Green hydrophobic proteins content was lower than white hydrophilic proteins content whatever the temperature wall. Green and white proteins in spinach leaves are usually reported to be present on equal proportions[29]. Costes[29]reported that for 1 g of fresh spinach leaves, there are 18.2 mg proteins: 9 mg are
Table 5
Characteristics of spinach juice samples produced at different wall temperatures.
Cutting level Fine
Temperature 30◦C 50◦C 70◦C 90◦C pH 6.6 6.6 6.9 6.6 Conductivity (mS cm−1) 19.6 20.7 20.2 18.7 Dry solid (g L−1) 20.5 32.1 31.0 33.4 Suspended matter (g L−1) 2.2 1.3 1 2.4 Total nitrogen (mg L−1) 1890 2730 2380 1750 Total nitrogen (g proteins L−1) 11.81 15.31 12.87 10.93 Green proteins (g L−1) 1.96 3.11 3.52 2.02 White proteins (g L−1) 7.56 9.6 7.36 6.24 Total fractionated proteins (g L−1) 9.52 12.71 11.88 8.26
0 200 400 600 800 1000 1200 17 16 15 14 13 12 11 10 9 8 7 Elution volume (mL) Absorbance 280 nm (mAU) 30°C 50°C 70°C 90°C
Fig. 8. HPLC SEC chromatograms obtained for spinach juice samples produced by the TAMD at different wall temperatures (30, 50, 70 and 90◦C).
hydrophilic proteins which result from break-up of chloroplasts and from cytoplasm. The other 9.2 mg are hydrophobic proteins, mainly membranes proteins, which are generally separated from hydrophilic ones by sedimentation.
In this work, fractionation of proteins was carried out on juices free of solids. Therefore, the removal of the suspended matter, which contains a large proportion of hydrophobic proteins, could explain the present results. This could also explain the difference on the mass balance between fractionated proteins and crude proteins, since several membranes proteins are removed with suspended matter (cells debris).
As expected, the operating temperature of the TAMD process has an influence on the crude protein content. Spinach juice produced at 50◦C presents the maximal nitrogen, green protein and white protein contents. Gastineau and Mathan[30]reported that green proteins, usually considered as chloroplastic proteins, precipitate between 55 and 65◦C and that white proteins, considered as cyto-plasmic proteins, precipitate at 85◦C. Arlabosse et al.[6]noticed that, when juice is produced at 50◦C, the temperature of the bot-tom of the press cake reaches 50◦C after 2 h and half processing, while it reaches 66◦C after 20 min when processing at 70◦C. This could explain why protein content is higher in juices produced at 50 than those produced at 70 and 90◦C. In addition, heat could modify structure and conformation of proteins, which modifies their solu-bility properties and their behaviour[31], or have an influence on the physical mechanisms involved on the juice production having an effect on the bio-molecule content.
3.2.1. HPLC SEC characterisation
Chromatograms obtained by HPLC SEC analysis of spinach juice obtained with different wall temperatures are presented inFig. 8.
The chromatogram of the juice sample produced at 30◦C showed two absorbance peaks, the first one at 8.75 ml, and the second at 11.65 ml. The corresponding MWs of these peaks, deter-mined thanks to the calibration curve of the HPLC SEC column (Fig. 2), were respectively, 560 and 6 kDa. This juice sample seems to contain Rubisco. Its concentration was estimated from Eq.(1), between 2.5 and 3 g/L, which represents more than 40% of white protein content. However, chromatograms of juice samples pro-duced at higher temperatures (50, 70 and 90◦C) showed only the second peak with higher intensity and did not reveal the presence of Rubisco in the samples.
Finally, results obtained from nitrogen characterisation meth-ods showed that physical structure of the biomass has an effect on
Fig. 9. Spinach juice proteins analysis on SDS-PAGE 15%. From right to left: lane 1 molecular weight marker, lane 2 spinach Rubisco migration, lane 3 spinach juice
produced at 90◦C, lane 4 spinach juice produced at 30◦C, lane 5 spinach juice
pro-duced at 50◦C, lane 6 spinach juice produced at 70◦C. LSR: large subunit of Rubisco;
SSR: small subunit of Rubisco.
the liquid fraction produced. Indeed, nitrogen content, green and white proteins contents are higher when leaves are finely cut. Nev-ertheless, at 50◦C, the juice produced by the TAMD process does not contain Rubisco but an important amount of polypeptides and pro-teins. The developed HPLC SEC method seems to show that TAMD applied at 30◦C allows Rubisco extraction.
3.2.2. SDS-PAGE
To reinforce HPLC SEC results, TAMD juices produced at temper-atures from 30 to 90◦C were loaded on SDS-PAGE.Fig. 9represents the gel stained by Coomassie Brilliant Blue.
As seen previously, migration of commercial spinach Rubisco on lane 2, revealed two bands making 58 and 14 kDa, corresponding respectively to MWs of the large and the small subunits of Rubisco. Lanes 3, 5 and 6 corresponding to TAMD juices produced with a wall temperature of 90, 50 and 70◦C do not reveal the bands at the same level of the Rubisco subunits. On the contrary, on lane 4 of the TAMD juice produced at 30◦C, two bands corresponding to Rubico subunits were detected in addition to other proteins, peptides and amino acids having low molecular weights. This result is coherent with HPLC SEC results.
4. Conclusion
A thermally assisted mechanical dewatering (TAMD) process was applied to spinach leaves. The process involves two simulta-neous steps: (1) mechanical dewatering at low pressure and (2) heating. Thus, green crops are separated into a press cake and a green juice.
To control the TAMD process, by understanding physical mecha-nisms of the biomass dewatering, and to consider the most adapted valorisation way of the liquid fraction, a deep physico-chemical characterisation is necessary. Therefore, in addition to conventional global methods, specific characterisation methods must be devel-oped.
Conventional global methods such as total nitrogen con-tent determination and proteins fractionation were carried out. Results showed that the amount of total nitrogen and fractionated (hydrophobic and hydrophilic) proteins contents increase when crops are finely cut. In addition, they are maximal when the juice is produced at 50◦C and decrease with increasing temperature. Otherwise, global characterization showed that pH, conductivity, suspended matter and dry matter do not depend on the operating
conditions of the dewatering process. Juices produced at temper-ature higher than 70◦C showed lower nitrogen content which is normally retained into the medium and allows the production of an enriched cake.
Since proteins are thermally sensitive material (and probably the most interesting valorisable biomolecules), their quality can be modified during juice production. To evaluate the effect of the process on proteins quality and quantity, an analytical method has been developed based on the principles of size exclusion chromatography. The method enables detection and quantifica-tion of a specific protein of interest, Rubisco. Results showed that Rubisco was only present in the juice produced at 30◦C, even if total nitrogen content and fractionated proteins are maximal at 50◦C. Therefore, it can be concluded that juice production with an important amount of polypeptides and proteins is possible when dewatering is operated at 50◦C, whereas Rubisco is extracted when operating at 30◦C. The HPLC SEC method developed in this study allowed the control of the dewatering process according to the valorisation path that would be considered.
Acknowledgements
This research was supported in part French National Research Agency (ANR), in the frame of CP2D program (PRODULUZ project n◦ANR-07-CP2D-16-02).
References
[1] P. Di Donato, G. Anzelmo, G. Tommonaro, B. Nicolaus, A. Poli, Vegetable wastes as suitable biomass feedstock for biorefineries, New Biotechnol. (2009), doi:10.1016/j.nbt.2009.06.575.
[2] I. Starke, A. Holzberger, B. Kamm, E. Kleinpeter, Qualitative and quantitative analysis of carbohydrates in green juices (wild mix grass and alfalfa) from a green biorefinery by gas chromatography/mass spectrometry, Fresenius J. Anal. Chem. 367 (2000) 65–72.
[3] B. Kamm, P. Schonicke, M. Kamm, Biorefining of green biomass – technical and energetic considerations, Clean 37 (2009) 27–30.
[4] S. Kromus, B. Kamm, M. Kamm, P. Fowler, M. Narodoslawsky, in: B. Kamm, M. Kamm, P. Gruber (Eds.), Biorefineries – Biobased Industrial Processes and Products. Status Quo and Future Directions, 1, Wiley-VCH, Weinheim, 2006, pp. 253–294.
[5] A. Mahmoud, A. Fernandez, T. Chitu, P. Arlabosse, Thermally-assisted mechani-cal dewatering (TAMD) of suspensions of fine particles: analysis of the influence of the operating conditions using the response surface methodology, Chemo-sphere 72 (2008) 1765–1773.
[6] P. Arlabosse, M. Blanc, S. Kerfai, A. Fernandez, Production of green juice with an intensive thermo-mechanical fractionation process. Part I: effect of processing conditions on the dewatering kinetics, Chem. Eng. J., submitted for publication, doi:10.1016/j.cej.2011.01.027.
[7] A. Mahmoud, P. Arlabosse, A. Fernandez, Application of a thermally assisted dewatering process to biomass, Biomass Bioenerg. (2010), doi:10.1016/j.biombioe.2010.08.037.
[8] N.C. Grau, Energy balances in biomass dewatering processes, Master’s Thesis report, Ecole Des Mines d’Albi-Carmaux, France, 2009, p. 165.
[9] R. Douillard, Propriétés biochimiques et physicochimiques des protéines des feuilles (Biochemical and physico chemical properties of leaves proteins), in: Protéines Végétales, B. Godon (Eds.), Technique et Documentation (Lavoisier), 1985, pp. 44–211 (in French).
[10] G.O. Kohler, B.E. Knuckles, Edible protein from leaves, Food Technol. 31 (1977) 191.
[11] N.W. Pirie, The present position of research on the use of leaf protein as a human food, Plant Food Hum. Nutr. 1 (1969) 237–246.
[12] L. Telek, H.D. Graham, Leaf Protein Concentrates, AVI Publishing Company, Westport, Connecticut, 1983.
[13] N. Godessart, R. Pares, A. Juarez, Microbial Coagulation of Alfalfa Green Juice, Appl. Environ. Microbiol. 53 (1987) 2206–2211.
[14] W. Koschuh, G. Povoden, V.H. Thang, S. Kromus, K.D. Kulbe, S. Novalin, C. Krotscheck, Production of leaf protein concentrate from ryegrass (Lolium perenne × multiflorum) and alfalfa (Medicago sativa subsp, sativa). Compari-son between heat coagulation/centrifugation and ultrafiltration, Desalination 163 (2004) 253–259.
[15] D. Levesque, J.C. Rambourg, Method for processing the raw juice produced from pressing a protein-leaf rich material such as alfalfa, patent WO 02/058482 (2002).
[16] D. De Fremery, R.E. Miller, R.H. Edwards, B.E. Knuckles, E.M. Bickoff, G. Kohler, Centrifugal separation of white and green protein fractions from alfalfa juice following controlled heating, J. Agric. Food Chem. 28 (1973) 886–889.
[17] N.P. d’Alvise, C. Lesueur-Lambert, A. Fertin-Bazus, B. Fertin, P. Dhulster, D. Guillochon, Continuous enzymatic solubilisation of alfalfa proteins in an ultra-filtration reactor, Enzyme Microb. Technol. 34 (2004) 380–391.
[18] R. Kapel, A. Chabeau, J. Lesage, G. Riviere, R. Ravallec-Ple, D. Lecouturier, M. Wartelle, D. Guillochon, P. Dhulster, Production, in continuous enzymatic membrane reactor, of an anti-hypertensive hydrolysate from an industrial alfalfa white protein concentrate exhibiting ACE inhibitory and opioid activ-ities, Food Chem. 98 (2006) 120–126.
[19] A. Incamps, F. Hély-Joly, P. Chagvardieff, J.-C. Rambourg, A. Dedieu, E. Linares, E. Quéméneur, Industrial process proteomics: alfalfa protein patterns during wet fractionation processing, Biotechnol. Bioeng. 91 (2005)447–459. [20] G.O. Kohler, Review of leaf protein concentrate. Production and projected uses,
11th Tech. Alfalfa, ARS 74.60, 1972.
[21] W.E. Barbeau, J.E. Kinsella, Ribulose bisphosphate carboxylase/oxygenase (rubisco) from green leaves—potentials as a food protein, Food Rev. Int. 4 (1988) 93–127.
[22] R. Douillard, O.d. Mathan, Leaf proteins for food use: Potential of RUBISCO, in: B.J. Hudson (Ed.), New and Developing Sources of Food Proteins, Chapman & Hall, London, 1994, pp. 307–342.
[23] S. Chakrabarti, S. Bhattacharya, S.K. Bhattacharya, Immobilization of d-ribulose-1,5-bisphosphate carboxylase/oxygenase a step toward carbon dioxide fixation bioprocess, Wiley Periodicals, Inc., 2002,705–711.
[24] Association Franc¸aise de Normalisation (AFNOR), Qualité de l’eau, in: Recueil de normes franc¸aises (Collection of French Standard Methods: Water Quality), AFNOR, Paris, France, 1994 (in French).
[25] C. Lusueur-Lambert, N. Prévot-D’Alvise, A.F. Bazus, B. Fertin, P. Dhulster, Devel-opment of a pilot process for the production of alfalfa peptide isolate, J. Chem. Technol. Biotechnol. 78 (2003) 518–528.
[26] J.T. Bahr, D.P. Bourque, H.J. Smith, Solubility properties of fraction I proteins of maize, cotton, spinach, and tobacco, J. Agric. Food Chem. 25 (1977) 783–789. [27] N.P. Hall, D. McCurry, N.E. Tolbert, Storage and maintaining activity of ribulose
biphosphate carboxylate/oxygenase, Plant Physiol. 67 (1981) 1220–1223. [28] U. Laemmli, Cleavage of structural proteins during the assembly of the head of
bacteriophage T4, Nature 227 (1970) 680–685.
[29] C. Costes, Biochimie des protéines foliaires (Biochemical of leaves proteins), in: Gauthier-Villars Costes (Ed.), Protéines Foliaires et Alimentation, Bordas, Paris, 1981, pp. 1–37 (in French).
[30] I. Gastineau, O.d. Mathan, La préparation industrielle de la protéine verte de luzerne (Industrial processing of green alfalfa protein), in: Gauthier-Villars Costes (Ed.), Protéines Foliaires et Alimentation, Bordas, Paris, 1981, pp. 159–182 (in French).
[31] D.G. Libouga, V. Aguié-Béghin, R. Douillard, Thermal denaturation and gelation of rubisco: effects of pH and ions international, J. Biol. Macromol. 19 (1996) 271–277.