HAL Id: hal-01015135
https://hal.archives-ouvertes.fr/hal-01015135
Submitted on 8 Jul 2018
HAL is a multi-disciplinary open access
archive for the deposit and dissemination of
sci-entific research documents, whether they are
pub-lished or not. The documents may come from
teaching and research institutions in France or
abroad, or from public or private research centers.
L’archive ouverte pluridisciplinaire HAL, est
destinée au dépôt et à la diffusion de documents
scientifiques de niveau recherche, publiés ou non,
émanant des établissements d’enseignement et de
recherche français ou étrangers, des laboratoires
publics ou privés.
Capacity Gain of MIMO Systems with Micro-structured
Antenna Arrays
Nadine Malhouroux-Gaffet, Patrice Pajusco, Roxana Burghelea, Christian
Leray
To cite this version:
Nadine Malhouroux-Gaffet, Patrice Pajusco, Roxana Burghelea, Christian Leray. Capacity Gain of
MIMO Systems with Micro-structured Antenna Arrays. EuCAP 2014 : the 8th European Conference
on Antennas and Propagation, Apr 2014, La Haye, Netherlands. �hal-01015135�
Capacity Gain of MIMO Systems with
Micro-structured Antenna Arrays
Nadine Malhouroux Gaffet
1, Patrice Pajusco
2, Roxana Burghelea
2, Christian Leray
31
Orange Lab: Wireless Engineering Propagation, BELFORT, France, [email protected]
2 Télécom Bretagne: Lab-Stic, BREST Cedex, Patrice.pajusco@ telecom-bretagne.eu
3Time Reversal Communications, CERGY PONTOISE,[email protected]r
Abstract—This paper aims to evaluate the contribution of
micro-structured antennas in MIMO communication systems. This antenna technology is based on hybridization band gaps and presents at the same time a very small form factor and very low correlation coefficients. In order to evaluate this new type of antenna, a comparison of performance with patch antenna type was performed. Both prototypes were used in an indoor measurement campaign in a residential environment. An analysis of the MIMO matrix measurement has been carried out focusing on the MIMO gain capacity of the two types of antennas.
Index Terms—antenna, propagation, measurement, MIMO.
I. INTRODUCTION
MIMO communication systems (multiple input multiple output) have created a technological breakthrough allowing a significant capacity increase of the transmission channels. In this context, the antennas that provide the interface between the circuit and the propagation medium are essential but complex due to physical constraints (size, electronic circuitry integration), technologic limitations (radiation, efficiency and bandwidth) or economic restraints (cost). New antenna design, using the hybridization band gap concept offers interesting prospects for miniaturization or large bandwidth sensors.
Such antennas are very compact and allow integrating a large number of highly uncorrelated sensors in a volume corresponding to WLAN equipment or to FEMTO equipment. The objective of this work is to evaluate the capacity gain of this type of antenna for MIMO systems.
II. DESCRIPTION OF THE ANTENNAS ARRAYS.
A. Hybridization Band Gap Based Antenna array
The antenna array [1] developed by the company Time Reversal Communications is shown in Fig. 1 and Fig. 2 (four port array). The antenna arrays consist of a set of close and small monopoles, which are embedded in a dense arrangement of parasitic radiators. These last have two functions: efficiently radiate the field produced by the small monopoles and ensure a good isolation between them. In such a case, the field radiated by each port of the antenna is de-correlated. In other words, the radiation patterns of each port are orthogonal. To obtain this result, this antenna design uses the property of the resonant
behavior of the parasitic radiators that leads to efficiently convert evanescent waves (sub-wavelength field fluctuations) into propagative ones. This result is in accordance with the Chu’s theorem which implies that an efficient small antenna should be resonant [2].
Two micro-structured antenna arrays have been
investigated in this study: At first time a four element array and in a second time an eight element array. The four port antenna structure are spaced of about λ/10 on a FR4 substrate [3]. Fig. 3 shows the variation of the reflection coefficient S11
as a function of frequency. Each port of the antenna has been measured and shows that it is very well adapted in the 2.4-2.5 GHz band.
To characterize and evaluate the 3D radiation pattern of these antennas, a measurement campaign has been carried out in near field condition which is presented on Fig. 4b. The antenna pattern is measured at 2.45 GHz for four ports.
Fig. 1.Microstructured Antenna array.
Fig. 2.Four ports and eight ports micro-structured antenna .
9,6cm
9,6cm P1
P2 P3 P4
2 2.1 2.2 2.3 2.4 2.5 2.6 2.7 2.8 2.9 3 -30 -25 -20 -15 -10 -5 0 Frequency [GHz] S 1 1 [ d B ] P1 P2 P3 P4
Fig. 3.Reflection coefficient of the micro-structured antenna array.
Radiation patterns of the antenna array have been measured in the xOz plane of the Satimo SG32 base as shown in Fig. 4b.
Fig. 4.Antenna array measurement and associated coordinated system.
P1 P2
P3 P4
(dB)
Fig. 5.Radiation pattern of the micro-structured antenna array at the central resonnance frequency f=2.45 GHz.
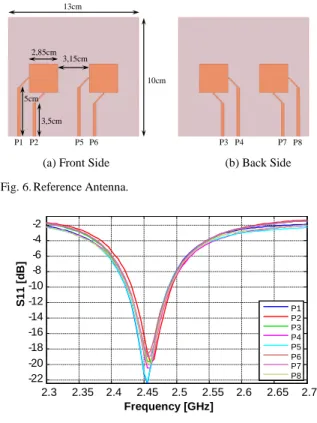
B. Reference Antennas array
The reference antenna array (Fig. 6) consists in two dual polarization square patches printed on a FR4 substrate. Each patch is fed by two microstrip lines supplying the two orthogonal polarizations (V/H). A line of quarter-wave length provides impedance matching. This structure is duplicated on
the other sides. This solution enables a quite compact eight element array.
The antennas are adapted on the 2.4-2.5 GHz frequency band as shown by the S11 coefficient measured in Fig. 7.
Radiation patterns of the reference antenna array have been measured in the xOz plane of the Satimo SG32 (Fig4-a). Taking into account the symmetries to the ground plane, Fig. 7 shows the 3D radiation diagrams obtained from the measurements at the central frequency of 2.45 GHz for the four ports on the front face of the antenna array. Pattern and gains are almost similar; the only difference comes from the direction of polarization.
Fig. 6.Reference Antenna.
2.3 2.35 2.4 2.45 2.5 2.55 2.6 2.65 2.7 -22 -20 -18 -16 -14 -12 -10 -8 -6 -4 -2 Frequency [GHz] S 1 1 [ d B ] P1 P2 P3 P4 P5 P6 P7 P8
Fig. 7.Reflection Coefficient of the reference antenna array.
P1 P
2
P5 P6
(dB)
Fig. 8.Radiation pattern of the reference antenna array at the central resonnance frequency f=2.45 GHz.
Z
Y
X
Z
Y
X
(a) Reference antenna (b) Micro-structured antenna
P1 P2 P5 P6 P3 P4 P7 P8 2,85cm 13cm 10cm 5cm 3,5cm 3,15cm
C. Comparison of the two types of antenna array
Table I summarizes the performances of these two antenna prototypes measured at 2.45 GHz.The performances of the two antenna arrays are similar in terms of bandwidth, isolation and correlation of ports. Only the gain of the reference patch array is slightly smaller than the band gap antenna. This can be explained by the difference of loss in the substrate and by the lines supplying the ports which are printed for the reference array and composed of little cables for the micro-structured antennas.
TABLE I. ANTENNA MEASURED PERFORMANCES Measurement types Antenna characteristics Reference patch antenna Hybridization band gap antenna Gain max 1.2-2.2 dB 1.3-2.7 dB Efficiency 29-33% 45-60% Correlation <0.15 <0.15 S11 (100 MHz) -6 to -20 dB -8 to -25 dB Isolation min -13 dB -12 dB
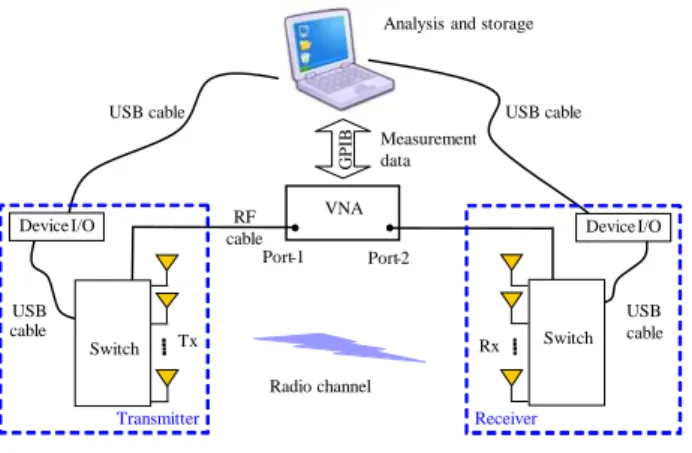
III. MIMOCHANNEL SOUNDER
A MIMO channel sounder has been developed for this experimentation in order to measure the MIMO matrix of this 4×4 or 4×8 antennas system. Device I/O Rx Switch Tx Device I/O Switch Transmitter Receiver VNA G P IB USB cable
Analysis and storage
Radio channel Port-1 Port-2 Measurement data USB cable RF cable cable USB cable USB
Fig. 9. Set-up of the MIMO channel sounder.
Figure 9 shows the equipment carried out for this study. A vector network analyzer (VNA - ZVB20) is used allowing the measurement of the propagation channel over a wideband. The ports 1 and 2 are connected to the transmitter and to the receiver respectively. The impulse responses are obtained measuring the S21 parameter channel (including antenna
arrays). For this study, the channel measurements are performed in an indoor environment. Two SP8T RF switches (Radio Frequency) are used both for the transmitter and the receiver allowing the selection of Tx and /or Rx antenna ports. Thus, all possible combinations between the transmitting and
receiving antennas can be measured. All elements of the acquisition chain are controlled by a computer and the measurement process is set through a graphic user interface developed in Matlab™. This interface provides calibration process, the switching of the antennas, the channel measurement, and the post processing of data.
This experimental set-up is designed for the measurement of 8×8 MIMO channels. The channel can be measured with different antenna arrays and thus their influence on the channel capacity can be estimated. A validation of the equipment was performed in an anechoic chamber.
IV. DESCRIPTION OF THE INDOOR ENVIRONMENT
MIMO channel measurements have been achieved in a typical indoor environment at Orange Labs premise (Belfort) that is statistically representative of an apartment. The layout and the measurement locations are shown in Fig. 10. The transmitter was located in 5 different locations, while the receiver was placed at a single location (Table II). The reception and transmission antenna arrays have been positioned at the same height (1 meter). Four different orientations of the arrays were considered: 0 °, 45 °, 90 ° and 135 ° for the receiver and the transmitter. Finally 10,000 impulse responses in LOS (Line Of Sight) and NLOS (No Line Of Sight) configurations have been recorded.
Fig. 10. Indoor environment with transmitter and receiver locations
TABLE II. TRANSMITTER AND RECEIVER LOCATIONS COORDINATES
Locations X(m) Y(m) Z(m) R0 6.46 5.88 1 T1 1.40 3.86 1 T2 5.28 1.08 1 T3 5.35 2.74 1 T4 10.53 1.48 1 T5 10.70 3.98 1
The transmission channel has been characterized on 401 frequencies between 2.2 and 2.7 GHz. This configuration
Rx Tx 0° 45° 90° 135° 12,45m 7 ,2 7 m R0 T1 T2 T3 T4 T5
corresponds to a delay max of 400 ns and a resolution of 0.1 ns.
V. ANALYSIS OF THE RESULTS
The MIMO analysis has been performed on the 4×4 and 8×4 configurations. Sub-antenna arrays have been created in order to maximize the number of channels:
• Micro-structured (TRCMA ) antennas at the transmitter
and at the receiver.
• Reference patch array at the transmitter and the receiver both located on the front side (P1, P2, P3, P4 ports).
• Reference patch array at the transmitter and the receiver. Two patches on the front side and two patches on the back side (P1, P2, P5, P6 ports).
• Reference patch array at the transmitter (P1, P2, P3, P4 ports) and micro-structured array at the receiver (TRCMA)
• Reference patch array at the transmitter (P1, P2, P5, P6 ports) and micro-structured array at the receiver (TRCMA)
• Reference patch array at the transmitter (P1, P2, P3, P4, P5, P6, P7, P8 ports) and micro-structured array at the receiver (MA8)
• Reference patch array at the transmitter and at the receiver (P1, P2, P3, P4, P5, P6, P7, P8 ports).
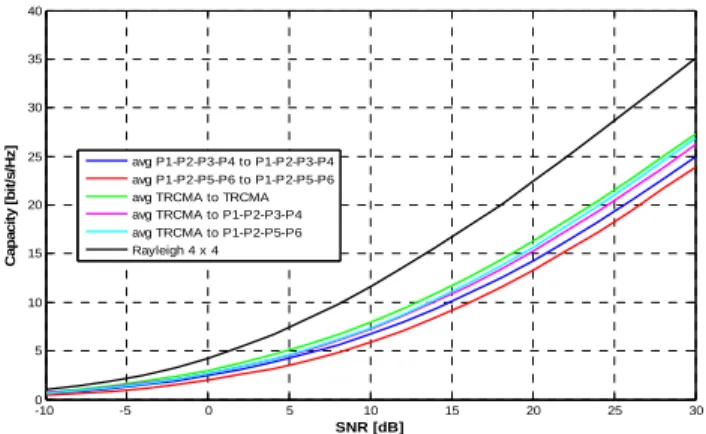
A. MIMO 4×4
Water Filling capacities were calculated for each measurement configuration to quantify the contribution of micro-structured antenna for MIMO communication systems. The capacity is plotted at the center frequency of 2.4 GHz in function of the SNR (signal to noise ratio).
The comparison of the average water-filling capacity of the different configurations 4×4 is presented in the Fig.11. An average of the different orientations of the antenna array is realized for each configuration and the measurements were normalized by the values of path loss. To improve the comparison, a reference plot has been added: the capacity of a Rayleigh channel 4×4. The curves are similar, including slopes that are substantially identical. The two types of antennas therefore are able to measure four degrees of freedom of the channel. However, these results highlight the increased channel capacity with micro-structured antennas that can be estimated of 3bits/s/Hz compared to the capacity obtained with the reference antennas. This gain corresponds to a value of 3 dB for the link budget of such configuration. It substantially corresponds to the efficiency ratio between the micro-structured antenna array and the antenna reference array.
The variation of the channel capacity of all the measurements (minimum, maximum and average) is given in Fig. 12 for each 4×4 configuration. The dispersion of the curves is higher for the reference antenna array than for the micro-structured antenna.
Fig. 11. MIMO Waterfilling Capacity for 4×4 Systems- average for all transmitter positions and orientation and all receiver orientations
Fig. 12. MIMO Waterfilling Capacity for 4×4 Systems- average, max, min for all transmitter positions and orientation and all receiver orientations
B. MIMO 8×8
The capacity of 8×8 MIMO matrix measurement are shown
in Fig. 13. The dispersion of the curves is consistent with the 4×4 systems results. -10 -5 0 5 10 15 20 25 30 0 10 20 30 40 50 60 70 SNR [dB] C a p a c it y [ b it /s /H z ]
All locations norm=56dBm
AVG antennes patch8 X patch8 MIN antennes patch8 X patch8 MAX antennes patch8 X patch8 AVG antennes TRCMA8 X patch8 MIN antennes TRCMA8 X patch8 MAX antennes TRCM8 X patch8 Rayleigh 8 x 8
Rx Tx
Fig. 13. MIMO Waterfilling Capacity for 8×8 Systems- average, max,min for all transmitter positions and orientation and all receiver orientations
-10 -5 0 5 10 15 20 25 30 0 5 10 15 20 25 30 35 40 SNR [dB] C a p a c it y [ b it /s /H z ] avg P1-P2-P3-P4 to P1-P2-P3-P4 avg P1-P2-P5-P6 to P1-P2-P5-P6 avg TRCMA to TRCMA avg TRCMA to P1-P2-P3-P4 avg TRCMA to P1-P2-P5-P6 Rayleigh 4 x 4 -10 -5 0 5 10 15 20 25 30 0 5 10 15 20 25 30 35 40 45 SNR [dB] C a p a c it y [ b it /s /H z ] avg P1-P2-P3-P4 to P1-P2-P3-P4 min P1-P2-P3-P4 to P1-P2-P3-P4 max P1-P2-P3-P4 to P1-P2-P3-P4 avg P1-P2-P5-P6 to P1-P2-P5-P6 min P1-P2-P5-P6 to P1-P2-P5-P6 max P1-P2-P5-P6 to P1-P2-P5-P6 avg TRCMA to TRCMA min TRCMA to TRCMA max TRCMA to TRCMA avg TRCMA to P1-P2-P3-P4 min TRCMA to P1-P2-P3-P4 max TRCMA to P1-P2-P3-P4 avg TRCMA to P1-P2-P5-P6 min TRCMA to P1-P2-P5-P6 max TRCMA to P1-P2-P5-P6 Rayleigh 4 x 4
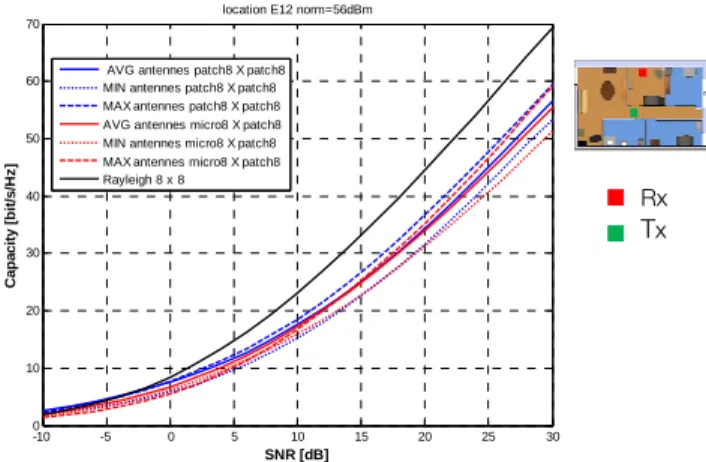
C. Analysis of the MIMO capacity for different locations.
An analysis of the results has been realized for different locations of the transmitter. Two typical results are presented in Fig. 14 and Fig. 15. In the first case, the transmitter is located in a room with two walls and furniture through the radio link. In this case, the gain of the micro-structured antennas is obvious. In a different configuration, when the configuration is Obstructed Line of Sight (OLOS), the gain of the micro-structured antenna is not observable (Fig.15). These results are consistent with the number of multipath of the two radio link configurations. Indeed, some previous works [4] have shown that the number of “pertinent” multipath is higher for the T2 transmitter than for the T3 transmitter. So the micro-structured antennas are well adapted for multipath channel.
VI. CONCLUSION
The purpose of this study was to evaluate experimentally the micro-structured antennas developed under the project TRIMARAN by Time Reversal Communications Company. A MIMO channel sounder has been developed and used to record MIMO measurements in indoor environment. Initial results confirm that the micro-structured antennas provide a diversity similar to a reference antenna array but in a smaller volume. The MIMO capacity is less dispersive with micro-structured antenna array and better in configuration with many multipath.
ACKNOWLEDGMENT
The authors thank the National Research Agency and the Pole Images and Networks for funding of TRIMARAN [5] project in which this work was conducted.
REFERENCES
[1]L. J. Chu, “Physical Limitations of Omnidirectional Antennas,” J. Appl. Phys/. Vol. 19, 1948.
[2]G. Lerosey, C. Leray, F. Lemoult, J. de Rosny, A. Tourin, M. Fink, “Hybridization band gap based smart antennas: Deep subwavelength yet directional and strongly decoupled MIMO antennas”, EUCAP 2012, Prague
[3]C.A Balanis, “Antenna Theory: Analysis and Design”,
3-ème Edition, Wiley, 2005.
[4]Malhouroux-Gaffet, N., P. Pajusco, et al. (2010). “Effect of propagation phenomena on MIMO capacity of wireless systems between 3 and 10 GHz”. Antennas and
Propagation (EuCAP), 2010 Proceedings of the Fourth European Conference [5]https://rd-project-trimaran.rd.francetelecom.com Rx Tx -10 -5 0 5 10 15 20 25 30 0 10 20 30 40 50 60 70 SNR [dB] C a p a c it y [ b it /s /H z ] location R2 norm=56dBm
AVG antennes patch8 X patch8 MIN antennes patch8 X patch8 MAX antennes patch8 X patch8 AVG antennes TRCMA8 X patch8 MIN antennes TRCMA8 X patch8 MAX antennes TRCMA8 X patch8 Rayleigh 8 x 8
Fig. 14. MIMO Waterfilling Capacity for 8×8 Systems- average, max,min for T2 transmitter positions and orientation and all receiver orientations .
Rx Tx -10 -5 0 5 10 15 20 25 30 0 10 20 30 40 50 60 70 SNR [dB] C a p a c it y [ b it /s /H z ]
location E12 norm=56dBm
AVG antennes patch8 X patch8 MIN antennes patch8 X patch8 MAX antennes patch8 X patch8 AVG antennes micro8 X patch8 MIN antennes micro8 X patch8 MAX antennes micro8 X patch8 Rayleigh 8 x 8
Fig. 15. MIMO Waterfilling Capacity for 8×8 Systems- average, max,min for T3 transmitter positions and orientation and all receiver orientations .