Journal of Adhesion Science and Technology Volume 26, Issue 22, 2012
Polymer Masks Fabrication by Micropatterning Surfaces of Composite Polymer Coatings DOI:10.1163/156856111X623113
N. Saleemaa*, D. K. Sarkarb*, M. Farzaneha & R. W. Paynterc pages 2531-2541
Publishing models and article dates explained Published online: 16 May 2012
Abstract
Micropatterning of surfaces has been demonstrated using composite polymer coatings of PS and PMMA of equal molecular weights in different volume proportions with varying surface topographies on silicon surfaces. The creation of PMMA masks with various surface morphological features has also been demonstrated by removal of PS from the composite coatings using cyclohexane. Atomic force microscopy (AFM) investigations revealed that the surface pattern and the dimensions of these masks significantly changed with the change in the volume proportions of each homopolymer. The composite coatings of 20/80 vol% PS/PMMA, 50/50 vol% PS/PMMA, and 80/20 vol% PS/PMMA resulted in PMMA masks with holes (depth ∼300 nm), wrinkles (height ∼350 nm) and pillars (height ∼600 nm), respectively. Surface compositional analysis carried out using FTIR and XPS investigations confirmed the presence of polymer coatings of PS, PMMA and PS/PMMA. XPS investigations also confirmed the successful removal of PS from the PMMA mask by showing the presence of the silicon substrate on those masks where PS was previously present. The water contact angle of the composite polymer masks ranged from 70 to 90° which increased with the increase of PS vol% in the composite. The wetting behavior of certain PMMA masks showed hydrophobicity with water contact angle values above 90°.
Keywords : Polymer nanopattering, composite polymer coatings, polymer masks, atomic force microscopy (AFM), XPS, FTIR, hydrophobicity
Surface patterning is a means by which surface features can be tuned down to the nanometer scale. Surfaces patterned at the micro/nanoscopic level find applications in a wide range of technological fields such as water repellency, solar cells, electronic
devices, biocompatible surfaces, photonics, information storage devices, microfluidic devices, catalysis, bio-medicine and so on [1–5]. The continued development of
lithographic techniques allows patterns to be produced with feature sizes well below 100 nm [6]. However, micro- or nanopatterning via lithography techniques is expensive and complex. Nanopatterning using block copolymers has attracted much attention [7–9] Polymer masking has recently been used to fabricate vertically aligned carbon nanotubes that provide novel concepts and new properties for multifunctional applications, ranging from advanced chemical and biological sensors to smart membranes to flexible electronics
membranes to flexible electronics [10]. The design of block copolymers with controlled properties also allows their application as surfaces with tunable wettabilities, increased cell adhesion, large surface-to-volume ratios for chemo- and biosensing and etch-resistant patterns for further processing [6].
Several miscible and immiscible polymer blends such as polycarbonate/ poly(methyl methacrylate) (PC/PMMA) [11,12], poly(vinyl chloride)/poly(methyl methacrylate) (PVC/PMMA) [13] and polystyrene/poly(methyl methacrylate) (PS/PMMA) [13,14] have been previously studied. Immiscible polymers have segregated structures with domains predominantly formed from the individual ho-mopolymers. The surface morphological features vary with the relative proportions of individual homopolymers in the polymer blends [15]. Immiscible blends also have the tendency for one of the homopolymers to be segregated at the surface in preference to the other. In case of solvent cast polymer composite coatings, the enrichment of the surface by one of the polymers could be influenced by the choice of solvent. For example, the surface of PVC/PMMA blends was enriched with PMMA when cast from tetrahydrofuran [16]. PS/PMMA blends have been cast on mica from chloroform by Ton-That et al. [15]. Other workers have also used solvents such as chlorobenzene and toluene [17] and methyl ethyl ketone [18]. Although, the aforementioned studies on composite polymers mostly focus on the surface patterning and surface morphological and compositional studies, a study on the wetting behavior of these surface patterns, which may be foreseen as an important parameter for use in biomedical applications, is considered important. In this work, we present a simple and low cost method of making composite polymer coatings and
polymer masks on silicon (Si (100)) substrates by solvent casting PS and PMMA polymer blend solutions with varying relative volume proportions of each polymer separately dissolved in toluene. The wetting behavior of these surfaces has also been characterized in addition to surface morphological and chemical compositional analyses. As an example of use of the PMMA masks in nanos-tructured surface coatings, we have demonstrated the formation ZnO µ-doughnut patterns using our PMMA masks in
combination with a sol–gel spin-coating technique. ZnO was chosen simply due to its wide use in several fields of applications including biomedicine.
2. Experimental
Polystyrene (PS) and poly(methyl methacrylate) (PMMA) of equal molecular weights (M w = 350000) from Sigma Aldrich were used for casting on silicon substrates. Silicon wafers were cleaned ultrasonically using a 1% LIQUINOX solution (Sigma Aldrich) followed by ultrasonic rinsing with de-ionized water for 20 min each. Individual polymer solutions were prepared by dissolving 30 g of PS and 30 g of PMMA individually in 1000 ml toluene. Polymer blend solutions were prepared by mixing the two homopolymer solutions ultrasonically in proportions of x vol% PS solution in (100-x) vol% PMMA solution, where x ranges from 0 to 100 in steps of 10. Composite polymer coatings were prepared by spin coating the polymer blend solutions on ultrasonically clean and dry Si (100) wafers at 6000 rpm for a duration of 60 s followed by drying at room temperature. The composite polymer coatings of different polymer blends were immersed in
cyclohexane and treated ul-trasonically for 20 min to remove PS from the composite in order to create masks of PMMA on silicon surfaces.
The surface morphologies of the composite polymer coatings as well as the PMMA masks were characterized using an atomic force microscope (AFM) (Digital Nanoscope IIIa by Digital Instruments). The chemical compositional analyses were conducted using X-ray photoelectron spectroscopy (XPS) and transmission mode Fourier transform infrared spectroscopy (FTIR) (PerkinElmer Spectrum One). The XPS spectra were collected using an ESCALAB 220iXL spectrometer, with a Mg Kα (1253.6 eV) X-ray
source. FTIR measurements were performed by using an ultrasonically cleaned piece of silicon as reference for background subtraction prior to measurement of the samples. The number of scans used was 20. The wetting behavior of the composite polymer coatings and the PMMA masks was studied by measuring static water contact angle on
these surfaces using a contact angle goniometer (Kriiss GmbH, Germany). Water drops of volume ∼5µlwere used to acquire the static contact angle data by fitting the symmetric water drops using the Laplace–Young equation. An average of 8 water drops was used to obtain the standard deviation of the acquired data.
3. Results and Discussion
The surface morphological studies of the different composite polymer coatings by AFM demonstrate that the morphological features are different in each case depending on the different volume proportions of the individual homopolymers in the polymer blend
solution used for casting. Figure 1 shows the AFM image of the 50/50 vol% PS/PMMA coating which exhibited a wrinkled segregation of PS and PMMA. In case of 100% PS and 100% PMMA, the surface displayed a smooth topography (not shown). In other cases, for example, 20/80 or 80/20 vol% PS/PMMA, the segregated morphological patterns showed a textured topography with a segregation pattern difficult to interpret in terms of contributions from PS and from PMMA (not shown). The pattern formation was clear on these surfaces only after PS was removed to create the masks of PMMA. A variation in morphological patterns has been previously reported on cast films of polymer blends [15] For example, Ton-That et al. reported a varying morphological behavior, although different than in our case, in their PS–PMMA films cast on mica substrates using chloroform as solvent [15]. The difference in the morphological behavior in their films could be attributed to the use of PS and PMMA of different molecular weights, whereas in our case the molecular weights are equal and the volume proportion of each polymer is varied.
Figure 1 2D AFM height (2 nm) image of 50/50 vol% PS/PMMA on Si (50 µm × 50 µm scan size).
Different PMMA masks were created by etching out the PS from the composite polymer coatings using cyclohexane. The AFM images of the different PMMA masks revealed the formation of a specific pattern depending on the relative volume proportion of each polymer used. These analyses were also useful in understanding the way each polymer segregated in the composite coating which was not visible in the AFM analyses of the composite polymer coatings. AFM images of the PMMA masks created using the composite polymer coating of 20/80, 50/50 and 80/20 vol% PS/PMMA are shown in Figure 2. It can be seen from the images that the 50/50 vol% PS/PMMA gave a wrinkled mask. The height of the wrinkles was determined from the AFM image analyses to be ∼350 nm (Figure 2(b)). This shows that the PMMA segregated as wrinkles. In the PMMA mask created using 20/80 vol% PS/PMMA (Figure 2(a)) there is a creation of holes with depths of ∼300 nm. It is clear from this observation that the PS which has been removed following etching with cyclohexane segregated as pillars with PMMA distributed as a
smooth film around these pillars. On the other hand, PMMA masks created using 80/20 vol% PS/PMMA showed formation of pillars of PMMA with heights of ∼600 nm (Figure 2(c)). In this case the PMMA segregated as pillars in the composite polymer coating and the PS formed a smooth film around these PMMA pillars before being etched away by cyclohexane. However, Zuyderhoff et al. reported a pillar height of ∼38 nm in case of a mixture of 80% PS and 20% random copoly-mer mix of PMMA-r-PMAA (poly(methyl methacrylate)-r-poly(methacrylic acid)) [14]. These analyses confirm that the individual polymers in the composite polymer coating segregate in different ways depending on their relative vol%. Figure 3 shows the plot of fraction of surface coverage of PMMA as determined from AFM with respect to the volume% of PMMA in the solution. A linear relation has been observed between the vol% of PMMA in the solution and its surface coverage. On the other hand, Zuyderhoff et al. reported higher surface coverage as compared to the PMMA in the solution [14].
Figure 2 2D AFM height (2µm) images of scan size 20µm × 20 µm of masks created by etching PS from (a) 20/80, (b) 50/50 and (c) 80/20 vol% PS/PMMA polymer blends spin coated on Si.
Figure 3 Fraction of surface coverage of PMMA as determined from AFM with respect to the volume% of PMMA in the solution.
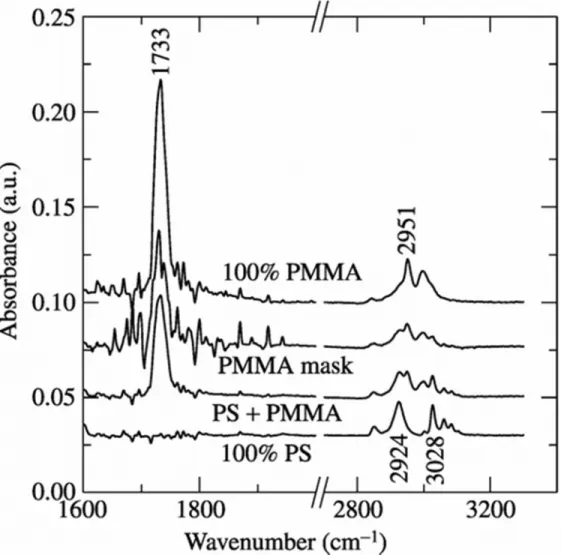
Chemical analyses were carried out using FTIR and XPS investigations. Both FTIR and XPS spectra were collected on silicon surfaces coated with 100 vol% PS, 50/50 vol% PS/PMMA, 100% PMMA and the PMMA mask formed following the removal of PS. Although all the significant FTIR peaks of both PS and PMMA were observed (in the range of 500-3500 cm–1), only selected peaks have been displayed in Figure 4 for the purpose of distinguishing them. In the FTIR spectrum of 100% polystyrene, the aromatic ring, (C6H5), gives rise to the group of bands above 3010 cm-1. The bands below 3010 cm-1 are from the saturated main chain CH groups [16]. In the FTIR spectrum of 100% PMMA, the absorption band at 1733 cm-1 is associated with C=O stretching and the peak at 2951 is associated with –CH3 bonds [17]. Therefore, the characteristic peaks of PS are at 2924 and 3028 cm-1 and those of PMMA are at 1733 and 2951 cm-1. All the characteristic FTIR peaks of PS and PMMA are observed on the 50/50 vol% PS/PMMA composite coating. However, in the FTIR spectrum of the PMMA mask, only those peaks at 1733 and 2951 cm-1 attributed to PMMA were observed, whereas the peaks attributed
to polystyrene at 2924 and 3028 cm-1 were negligible confirming the absence of PS following its removal.
Figure 4 FTIR spectra of PS, PS/PMMA, PMMA mask and PMMA.
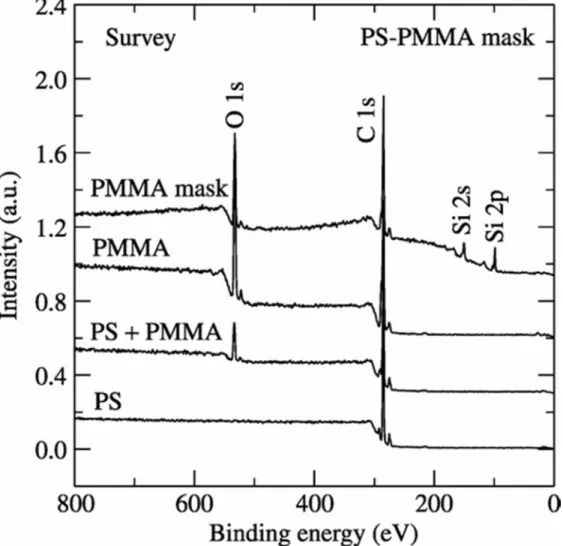
XPS investigations were further carried out to confirm the elemental verification as well as to confirm the removal of PS in the process of creating PMMA masks. The XPS survey spectra of 100% PS, 50/50 vol% PS/PMMA and 100% PMMA demonstrate the presence of only two elements, carbon and oxygen (Figure 5) as they are the elements of PS and PMMA. There are no signals indicative of the silicon substrate being visible. However, the PMMA mask shows the presence of the silicon substrate, which is an
indication that the PS has been removed in the etching process exposing the substrate in those areas where the PS was etched away. Figure 6 shows the high-resolution C 1s and O 1s spectra of all these combinations.
Figure 5 XPS survey spectra of PS, PS/PMMA, PMMA and PMMA mask.
Figure 6 High resolution C 1s (a) and O 1s (b) spectra of the different polymer blends as well as the PMMA mask.
From Figure 6(a), it is clear that the C 1s spectrum of the PS film includes a hydrocarbon peak at 285 eV and π – π∗ shake-up satellites peaks between binding energies of 290 and 292.5 eV. The C 1s of PMMA exhibits a broadening which is due to a hydrocarbon peak, a β-shifted carbon, C–O carbon and O–C=O carbon at positions ranging from 285 to 289 eV. The C 1s spectrum of the composite polymer of PS and PMMA shows all the carbon components of PMMA as well as PS including the π – π∗ shake-up satellites. The C 1s spectrum of the PMMA mask (PS removed from PS/PMMA composite coating) includes all the carbon components of 100% PMMA showing no sign of the PS that has been etched away.
Figure 6(b) shows the high-resolution O 1s spectra of the PS/PMMA, polymer blend, PMMA as well as the PMMA mask. The PS is not shown as no oxygen is expected and is not observed in the XPS spectrum of PS. The O 1s peaks of PMMA and the
PS/PMMA composite are very similar as the oxygen signal comes only from PMMA. The relative concentrations of O 1s peak of PMMA resolved into two peaks at binding
energies 532.3 and 533.9 eV were 49 and 51%, respectively. However, the relative concentration of the O 1s peak of the PMMA mask after PS removal from the composite also resolved into two peaks with concentrations 64 and 36%, respectively. The intensity of the peak at 532.4 eV increased due to the oxygen from the native oxide on the silicon surface exposed in the areas where PS has been removed. These analyses show that the PS has been removed successfully from the PS/PMMA composite. The high-resolution carbon C 1s and O 1s spectra of the 100% PS and 100% PMMA shown in Figure 6(a), (b), respectively, are in excellent agreement with previously published work [18]. In addition, Figure 7 shows the high resolution Si 2p spectrum of the PMMA mask
on the silicon substrate. The presence of a strong peak of Si 2p at 99 eV corresponding to the metallic silicon and the peak at 103 eV corresponding to the silicon bonded to oxygen confirm the successful removal of PS from the composite of PS/PMMA resulting in the production of a PMMA mask on the silicon substrate.
Figure 7 High-resolution Si 2p spectrum of PMMA mask.
The wetting behavior of the different composite polymer coatings as well as the PMMA masks was investigated (Figure 8). The water contact angles on the composite polymer coatings as shown in Figure 8(a) were found to be in the range of 70–100° and water contact angles of 95.9 ± 1.3 and 74.2 ± 0.3° were observed on smooth PS and PMMA surfaces, respectively. Similar contact angles on PS [19, 20] and PMMA [21, 22] have been previously reported in literature. The water contact angles were similar on the
composite polymer coatings with the PS/PMMA content ranging from 20/80 to 80/20 vol%. In the case of the different PMMA masks (Figure 8(b)), similar water contact angles were obtained. However, the water contact angle on the masks which had more PS in the composite polymer coating prior to removal with cyclohexane, such as those with PS/PMMA contents ranging from 50/50 to 80/20 vol%, showed a slight increase, with values above 90°. This enhancement could be attributed to the creation of a certain roughness following the removal of PS on these surfaces. In case of 50/50 vol%, the surface fraction of PMMA is found to be 0.25 (Figure 3). This fraction has been used in the Cassie–Baxter formula (cos θ’ = f1(cos θ1 + 1) - 1) to calculate the contact angle on the mask which has been found to be 92° [23]. This value is in agreement with the measured contact angle value. Although water contact angle values slightly greater than 90° are encountered on certain masks mentioned above, indicating that these surfaces are hydrophobic, more work is needed to improve the roughness of these surfaces to obtain improved hydrophobic properties with even higher water contact values. Such PMMA masks with water contact angles in the superhydrophobicity zone (>150°) may be used to fabricate inorganic superhydrophobic coatings via a sol–gel technique or a dip-coating technique. Such superhydrophobic inorganic surfaces could find their potential use in many important fields such as biomedical applications [24], microfluidics [25], corrosion resistance [26], self-cleaning windshields for automobiles [27], stain-resistant textiles [28], solar cell applications [1], etc.
Figure 8 Water contact angle of (a) the composite polymer coatings with varying vol% of individual polymers; (b) the PMMA masks created using the different composite polymer coatings in (a).
As an example of the application of the polymer masks in making nanostructured materials, we attempted to prepare ZnO nanostructures using the PMMA masks with pillar formation (Figure 2(c)). A sol of ZnO was spin-coated onto the PMMA pillars followed by annealing at 450°C wherein the PMMA burns off leaving the surface with nanostrutcured ZnO. The AFM image (Figure 9(a)) of these nanostruc-tures revealed a microdoughnut structure of ZnO. An XPS survey spectrum of these nanostructures as shown in Figure 9(b) confirmed the presence of Zn, O, C and Si with the peaks at 1022, 532, 285 and 99 eV corresponding to the Zn 2p, O 1s, C 1s and Si 2p, respectively. The Si 2p arises in the spectrum due to the exposure of the silicon substrate from those places where PMMA previously present as masks has disappeared during the high temperature sol–gel annealing process.
Figure 9 (a) 20 µm × 20 µm AFM image of ZnO microdoughnuts fabricated using PMMA masks and (b) XPS survey spectrum confirming the presence of ZnO coating.
4. Conclusion
Composite polymer coatings of PS and PMMA of equal molecular weights, spin coated on silicon surfaces showed a varying topography which depends on the relative volume proportions of the individual polymers used in the polymer blend solution. The PMMA masks created by removing PS from these composite surfaces showed formation of varying morphological features and also clarified the segregation pattern of the different polymers used in the composite polymer coating. FTIR and XPS studies confirmed the presence of polymer coatings of PS, PMMA as well as of the PS/PMMA composites. The presence of silicon in the XPS survey spectrum of the PMMA mask was an indication of the successful removal of the PS from the PS/PMMA composite following etching with cyclohexane. The wetting behavior of the composite polymer coatings as well as that of certain PMMA masks showed hydrophobicity with water contact angle values above 90°. More work on improving the hydrophobic properties of the polymer surfaces is needed as enhancing the wetting resistance of the polymer surfaces may lead to important applications in the field of biomedicine. As an application, formation of ZnO microdoughnuts has been demonstrated using micropillared PMMA masks.
References
• 1. Saleema, N., Farzaneh, M. and Paynter, R.W. 2009. Mater. Lett., 63: 233
• 2. Saleema, N. and Farzaneh, M. 2008. Appl. Surf. Sci., 254: 2690
• 4. Folch, A. and Toner, M. 1998. Biotechnol. Prog., 14: 388
• 5. Chen, X., Hirtz, M., Fuchs, H. and Chi, L. 2005. Adv. Mater., 17: 2881
• 6. Krishnamoorthy, S., Hinderling, C. and Heinzelmann, H. 2006. Mater. Today, 9: 40
• 7. Bates, F.S. and Fredrickson, G.H. 1999. Phys. Today, 52: 32
• 8. Hamley, I.W. 2003. Nanotechnology, 14: R39
• 9. Ikkala, O. and ten Brinke, G. 2004. Chem. Commun., 2131
• 10. Qua, L. and Dai, L. 2007. Chem. Commun., 3859
• 11. Chiou, J.S., Barlow, J.W. and Paul, D.R. 1987. J. Polym. Sci. Part B: Polym. Phys., 25: 1459
• 12. Lhoest, J.B., Bertrand, P., Weng, L.T. and Dewez, J.L. 1995. Macromolecules, 28: 4631
• 13. Jackson, S.T. and Short, R.D. 1992. J. Mater. Chem., 2: 259
• 14. Zuyderhoff, E.M., Dekeyser, C.M., Rouxhet, P.G., Dupont-Gillain, C.C. and Colloid Interface, J. 2008. Sci., 319: 63
• 15. Ton-That, C., Shard, A.G., Teare, D.O.H. and Bradley, R.H. 2001. Polymer, 42: 1121
• 16. Janarthanan, P., Yunus, W.M.Z.W. and Ahmad, M.B. 2003. J. Appl. Polym. Sci., 90: 2053
• 17. Yang, Y. and Dan, Y. 2003. Colloid Polym. Sci., 281: 794
• 18. Beamson, G. and Briggs, D. 1992. High Resolution XPS of Organic Polymers, Chichester, UK: Wiley.
• 19. Yuan, Z., Chen, H., Tang, J., Gong, H., Liu, Y., Wang, Z., Shi, P., Zhang, J. and Chen, X. 2007. J. Phys. D: Appl. Phys., 40: 3485
• 20. Occhiello, E., Morra, M., Garbassi, F., Johnson, D. and Humphrey, P. 1991. Appl. Surf. Sci., 47: 235
• 21. Jung, Y.C. and Bhushan, B. 2006. Nanotechnology, 17: 4970
• 22. Valentini, L., Bittolo Bon, S. and Kenny, J.M. 2008. Nanotechnology, 19: 295301
• 23. Cassie, A.B.D. and Baxter, S. 1944. Trans. Faraday Soc., 40: 546
• 24. A. Singh, L. Steely and H. R. Allcock, Polym. Prepr. (ACS, Div. Polym. Chem.) 46, 599 (2005).
• 26. Liu, T., Yin, Y., Chen, S., Chang, X. and Cheng, S. 2007. Electrochim. Acta, 52: 3709
• 27. Quere, D. 2005. Rep. Prog. Phys., 68: 2495