HAL Id: hal-00666134
https://hal.archives-ouvertes.fr/hal-00666134
Submitted on 3 Feb 2012
HAL is a multi-disciplinary open access
archive for the deposit and dissemination of
sci-entific research documents, whether they are
pub-lished or not. The documents may come from
teaching and research institutions in France or
abroad, or from public or private research centers.
L’archive ouverte pluridisciplinaire HAL, est
destinée au dépôt et à la diffusion de documents
scientifiques de niveau recherche, publiés ou non,
émanant des établissements d’enseignement et de
recherche français ou étrangers, des laboratoires
publics ou privés.
Clustering
Tarik Filali Ansary, Mohamed Daoudi, Jean-Philippe Vandeborre
To cite this version:
Tarik Filali Ansary, Mohamed Daoudi, Jean-Philippe Vandeborre. A Bayesian 3-D Search Engine
Using Adaptive Views Clustering. IEEE Transactions on Multimedia, Institute of Electrical and
Electronics Engineers, 2007, 9 (1), pp.78-88. �10.1109/TMM.2006.886359�. �hal-00666134�
A Bayesian 3-D Search Engine Using
Adaptive Views Clustering
Tarik Filali Ansary, Mohamed Daoudi, Member, IEEE, and Jean-Philipe Vandeborre
Abstract—In this paper, we propose a method for three-dimen-sional (3-D)-model indexing based on two-dimenthree-dimen-sional (2-D) views, which we call adaptive views clustering (AVC). The goal of this method is to provide an ”optimal” selection of 2-D views from a 3-D model, and a probabilistic Bayesian method for 3-D-model re-trieval from these views. The characteristic view selection algo-rithm is based on an adaptive clustering algoalgo-rithm and uses sta-tistical model distribution scores to select the optimal number of views. Starting from the fact that all views do not have equal impor-tance, we also introduce a novel Bayesian approach to improve the retrieval. Finally, we present our results and compare our method to some state-of-the-art 3-D retrieval descriptors on the Princeton
3-D Shape Benchmark database and a 3-D-CAD-models database
supplied by the car manufacturer Renault.
Index Terms—Bayesian approach, clustering, 3–D indexing, 3–D retrieval, views.
I. INTRODUCTION
T
HE use of three-dimensional (3-D) image and model databases throughout the Internet is growing both in number and size. The development of modeling tools, 3-D scanners, 3-D graphic accelerated hardware, Web3D, and so on, is enabling access to 3-D materials of high quality. In recent years, many systems have been proposed for efficient infor-mation retrieval from digital collections of images and videos. However, the solutions proposed so far are not always effective in application contexts where the information is intrinsically 3-D. A similarity metric has to be defined to compute a visual similarity between two 3-D models, given their descriptions.For example, Kazhdan et al. [1] describe a general approach based on spherical harmonics. From the collection of spher-ical functions calculated on the voxel grid of the 3-D object, they compute a rotation invariant descriptor by decomposing the function into its spherical harmonics and summing the har-monics within each frequency. Then, they compute the -norm for each component. The result is a two-dimensional (2-D) his-togram indexed by radius and frequency.
Manuscript received October 19, 2005; revised March 5, 2006. This work was supported by the French Research Ministry and the RNRT (Réseau Na-tional de Recherche en Télécommunications) within the framework of the SE-MANTIC-3D National Project (http://liris.cnrs.fr/semantic-3d.net) and in part by the NoE DELOS No. 507618 (http://www.delos.info). The associate editor coordinating the review of this manuscript and approving it for publication was Dr. Anna Hac.
The authors are with the FOX-MIIRE Research Group (LIFL UMR CNRS/USTL 8022) GET/INT/Télécom, Lille 1, France (e-mail: [email protected]; [email protected]; [email protected]).
Color versions of Figs. 1–3, 6– 8, 10, and 14 are available online at http:// ieeexplore.ieee.org.
Digital Object Identifier 10.1109/TMM.2006.886359
Vandeborre et al. [2] propose to use full 3-D information. The 3-D objects are represented as mesh surfaces and 3-D shape descriptors are used. The results obtained show the limitation of the approach when the mesh is not regular. This kind of ap-proach is not robust in terms of shape representation.
Antini et al. [3] present an approach based on curvature cor-relograms. The main advantage of correlograms relates to their ability to encode not only the distribution of features but also their arrangement on the object surface.
Assfalg et al. [4] present an approach to global and local con-tent-based retrieval of 3-D models that is based on Spin images. Spin images are used to derive a view-independent description of both database and query objects. A set of Spin images is first created for each object and the parts it is composed of. Then, a descriptor is evaluated for each Spin image in the set. Clustering is performed on the set of image-based descriptors of each ob-ject to achieve a compact representation.
Sundar et al. [5] encode a 3-D object in the form of a skeletal graph. They use graph matching techniques to match the skele-tons and, consequently, to compare the 3-D objects. They also suggest that this skeletal matching approach has the ability to achieve part matching and helps in defining the queries natu-rally.
In 3-D retrieval using 2-D views, the main idea is that two 3-D models are similar, if they look similar from all viewing angles. Funkhouser et al. [6] apply view-based similarity to implement a 2-D sketch query interface. In the preprocessing stage, a de-scriptor of a 3-D model is obtained by 13 thumbnail images of boundary contours as seen from 13 view directions.
Filali et al. [7], [8] propose an adaptive nearest neighbor-like framework to choose the characteristic views of a 3-D model. The framework gives good results but was only applied on a small database.
Using aspect graphs, Cyr and Kimia [9] specify a query by a view of 3-D-objects. A descriptor of a 3-D model consists of a set of views. The number of views is kept small by clustering views and by representing each cluster by one view, which is described by a shock graph. Schiffenbauer [10] presents a com-plete survey of aspect graphs methods.
Using shock matching, Macrine et al. [11] apply indexing using topological signature vectors to implement view-based similarity matching more efficiently.
Chen et al. [12] adhere to the intuitive idea that two 3-D models are similar if they also look similar from different an-gles. They use 100 orthogonal projections of an object and en-code them by Zernike moments and Fourier descriptors. They also point out that they obtain better results than other well-known descriptors.
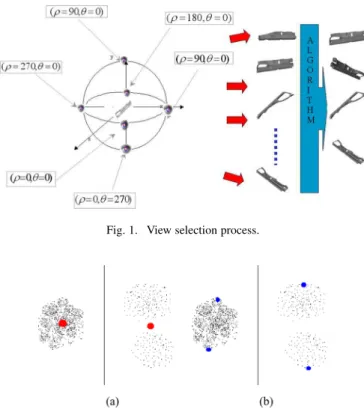
Fig. 1. View selection process.
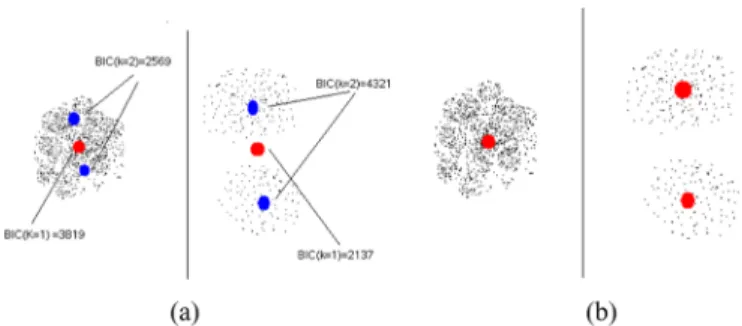
Fig. 2. LocalK-means on each part of the views clusters with K = 2.
A complete survey on 3-D shape retrieval can be found in Tangelder and Veltkamp [13].
In this paper, we propose a method for 3-D-model indexing based on 2-D views, which we call Adaptive Views Clustering (AVC). This method aims at providing an optimal selection of 2-D views from a 3-D model, and a probabilistic Bayesian method for 3-D-model indexing from these views. This paper is organized as follows. In Section II, we present the main principles of our method for characteristic view selection. In Section III, our probabilistic 3-D-model indexing is presented. Finally, the results obtained from two databases of 3-D models are discussed demonstrating the performance of our method. We compare our method to some state-of-the-art 3-D retrieval descriptors on the Princeton 3-D Shape Benchmark (PSB) database and the SEMANTIC-3D database.
II. SELECTION OFCHARACTERISTICVIEWS
Let be a collection of 3-D
models. We want to represent each 3-D-model by a set of 2-D views that best represent it. Fig. 1 shows an overview of the selection of the characteristic view algorithm. To achieve this goal, we first generate an initial set of views from the 3-D model, then we reduce this set to only those that best charac-terize this 3-D model. This idea comes from the fact that not all the views of a 3-D model have equal importance: there are views that contain more information than others. For example, one view is sufficient to represent a sphere as it looks the same from all angles. But, more than one view is needed to represent a more complex 3-D model such as an airplane.
In this paragraph, we present our algorithm for characteristic view selection from a 3-D model.
A. Generating the Initial Set of Views
To generate the initial set of views for a model of the col-lection, we create 2-D views (projections) from multiple view-points. These viewpoints are equally spaced on the unit sphere. In our current implementation, we use 320 initial views. In fact, we scale each model such that it can fit into a unit sphere. Then we translate it such that the origin coincides with the 3-D-model barycenter.
To select positions for the views, which must be equally spaced, we use a two-unit icosahedron centred on the origin. We subdivide the icosahedron twice by using the Loop-subdi-vision schema to obtain a 320 faceted polyhedron. Finally, to generate the initial views, we place the camera on each of the face-centers of the polyhedron looking at the coordinate origin. The views are silhouettes only, which enhance the efficiency and the robustness of the image metric. Orthogonal projection is applied in order to speed up the retrieval process and re-duce the size of the used features. To represent each of these 2-D views, we use 49 coefficients of Zernike moment descriptor [14], [15]. Due to the use of Zernike moments, the approach is robust against translation, rotation, and scaling.
B. Characteristic Views Selection
As every 2-D view is represented by 49 Zernike moment co-efficients, choosing a set of characteristic views that best char-acterize the 3-D models (320 views) is equivalent to choose a subset of points that represent a set of 320 points in a 49-dimen-sion space. Choosing characteristic views which best rep-resent a set of views is well known as a clustering
problem.
One of the widely used algorithm in clustering is -means
[16] algorithm. Its attractiveness lies in its simplicity and in its local-minimum convergence properties. However, it has one main shortcoming: the number of clusters has to be supplied by the user.
As we want from our method to adapt the number of charac-teristic views to the geometrical complexity of the 3-D model, using -means is not suitable. To avoid this problem, we use a method derived from -means. Instead of using a fixed number of clusters, we propose to use a range in which we will choose the ”optimal” number of clusters. In our case, the range will be . In this paper, we assume that the maximum number of characteristic views is 40. This number of views is a good compromise between speed, descriptor size and representation. We proceed now to demonstrate how to select the character-istic view set and also how to select the best within the given range. In essence, the algorithm starts with one characteristic view ( equal to 1), we add characteristic views where they are needed, and we do a global -means on the data starting with characteristic views as cluster centers. We continue alter-nating between adding characteristic views and doing a global -means until the upper bound for characteristic view number (40) is reached. During this process, for each , we save the characteristic view set.
To add new characteristic views, we use the idea presented in the -means clustering method by Dan Pelleg [17]. First, for every cluster of views represented by a characteristic view, we select two views that have the maximum distance in this cluster.
Next, in each cluster of views, we run a local -means (with ) for each pair of selected views. By local, we mean that only the views that are in the cluster are used in this local clus-tering (Fig. 2). Note that Figs. 2 and 3 are just a schematic ex-ample, as we represent a view in a 2-D space. In our system, each view is represented by a vector in a 49-dimensional space (cor-responding to the 49 Zernike moment features extracted from the view).
At this point, a question arises: “Are the two new charac-teristic views giving more information on the region than the original characteristic view?” To answer this question, we use Bayesian information criteria (BIC), which scores how likely the representation model (using one or two characteristic views) fits the data. Other criteria, like Akaike information criteria (AIC) [18], could also be used. Estimating the BIC score will be discussed in Section II-C.
According to the outcome of the test, the model with the higher score is selected (Fig. 3). These clusters of the views which are not represented well by the current centroids will re-ceive more attention by increasing the number of centroids in them.
We continue alternating between global -means and local -means on clusters belonged to the characteristic views until the upper bound for the characteristic view number is reached. Then, we compare the BIC score of each characteristic view set. Finally, the best characteristic view set will be the one that gets the highest BIC score on all the views. Algorithm 1 gives an overview of the characteristic view selection algorithm.
Algorithm 1 characteristic view selection algorithm.
Number of characteristic views,
while Number of characteristic views Maximum number characteristic views do)
Apply global -means on all the views (The start centers are the characteristic views).
Save the characteristic view set and its BIC Score.
for all cluster of views do
Apply -means (with ) on the cluster.
Choose the representation with the highest BIC score between the original characteristic view or the two new characteristic views.
Update the number of characteristic views.
end for end while
Select and the characteristic view set with the higher BIC score.
C. Bayesian Information Criteria
“Representation model selection” refers to the problem of using the data to select one model from a list of candidates
Fig. 3. Selecting the representations (with one or two characteristic views) that have the higher BIC score.
that best represent the data. In our case, a rep-resentation model will be a set of characteristic views.
Model selection is a well known mathematical problem.
This problem can be solved using many criteria like AIC [18], BIC [19], Bayes Factors [20] and so on. The Bayesian solu-tion to these problems is to compute the posterior probability for each model. Under weak conditions, BIC and Bayes methods are asymptotically equivalent. On the other hand, it appears to be some debate on the relative merits of AIC versus BIC, but it is beyond the scope of this paper [21], [22]. In practice, it has been observed that BIC selects models with a dimension smaller than AIC, because BIC “penalizes” more than AIC when dimension is higher than seven [23]. In this paper, we use the BIC for model selection.
To calculate the BIC score for a representation model having the cluster of views , we use the formula introduced by Schwarz [19]
(1) where is the number of parameters in also known as the Schwarz criterion [19], is the log-likehood of the data according to the th model taken at the maximum likelihood point, and is the number of views in the cluster.
In our case the models are all spherical Gaussians which is the type assumed by -means. The maximum likehood estimate (MLE) for variance is
(2)
where the Euclidean distance between the
Zernike moments of the respective views and . Here, is the characteristic view associated with the view . The log-likehood of the data is
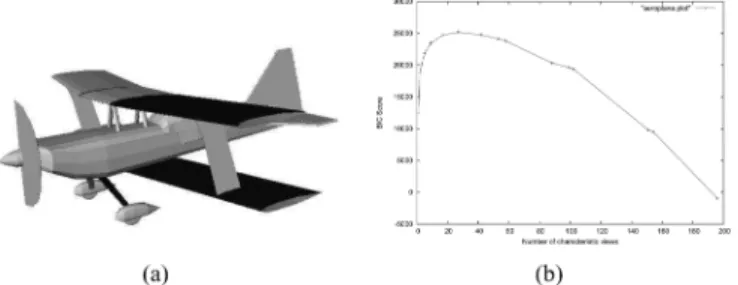
(3) Figs. 4 and 5 show the evolution of the BIC score with the number of views. These curves show that an “optimal” number of views exists where the BIC score is maximized. For the air-plane model in Fig. 4(a), the number of optimal views is 29.
Fig. 4. (a) Airplane model from the PSB database and (b) its corresponding BIC score curve.
Fig. 5. (a) Car model from the PSB and (b) its corresponding BIC Score curve.
For the car model in Fig. 5(a), only 17 views are needed as this 3-D model is less complex than the first one. This results from the fact that as the geometrical complexity of the 3-D model in-creases, the number of distinct 2-D-views also increases. This leads to a higher number of views to best represent it.
III. PROBABILISTICAPPROACH FOR3-D INDEXING
As mentioned before, not all views of a 3-D model have the same importance. There are views which represent the 3-D model better than others. On the other hand, simple objects (e.g., cube, sphere) can be at the root of more complex objects. In this section, we present a probabilistic approach that takes into account that views do not have the same importance, and that simple objects have higher probability to appear than more com-plex one.
Each model of the collection
is represented by a set of characteristic views
, with being the number of character-istic views. To each charactercharacter-istic view corresponds a set of represented views called .
Considering a 3-D-request-model , we want to find the model which is the closest to the request model . This model is the one that has the highest probability . Knowing that each model is represented by its characteristic views, can be written
(4) where is the number of characteristic views of the model . Let be the set of all the possible hypotheses of correspon-dence between the request view and a model ,
. A hypothesis is a Boolean variable which denotes that the view of the model corresponds or not
to the view request . The sign represents the logical or
operator. Let us note that if an hypothesis is true, then all the other hypotheses are false. can be expressed by
. We have
(5)
(6) Since we cannot observe in the same scene two characteristic views of the same 3-D model, we have
then
(7)
The sum can be reduced to the only
true hypothesis . In fact, a characteristic view from the request model can match only one characteristic view from the model . We choose the characteristic view with the maximum probability
(8) By (4) and (8), we have
(9) The closest model is the one that contains the view having the highest probability.
Using the Bayes theorem, we obtain
(10) On the other hand, we have
(11) and
(12) By using this remark, we obtain
Finally, we have (14), as shown at the bottom of the page. As mentioned in the begining of this section, the main idea of our probabilistic approach is that not all 3-D models in the collection have the same probability to occur. Simple objects (e.g., cube, sphere) could be at the root of more complex objects. Our algorithm assumes that the simpler is the 3-D model, the smaller is the number of the characteristic views. To model the fact that the larger the relative number of views of a model , the smaller the probability of the model, we estimate , the probability to observe a 3-D model by
(15) where is the number of characteristic views of the model , is the total number of characteristic views for the set of the models of the collection . is a coefficient that reduces the effect of small values of the exponentiel in . On the other hand, there are views that contain more infor-mation than other ones. We assume that the greater the number of represented views for a characteristic view , the more this characteristic view is important and the more in-formation it contains about the 3-D model. So, we modeled the probability to observe the characteristic view of the model by
(16) where is the number of views represented by the characteristic view of the model and is the total number of views represented by the model . The coeffi-cient is introduced to reduce the effect of small values of the view probability. We used different values for and in our experiments to study the evolution of our algorithm.
The value is the probability that, knowing that we observe the characteristic view of the model , this view corresponds to the view of the request model
(17)
where is the Euclidean distance between the 2-D Zernike descriptors of the view of the request model and
is the characteristic view of the 3-D model .
To summarize, in this section we presented our Bayesian re-trieval framework which takes into account the number of char-acteristic views of the model and the importance (amount of in-formation) of its views.
IV. EXPERIMENTALSETUP
In this section, we present the experimental results, the databases and the evaluation criteria. The algorithms we de-scribed in the previous sections have been implemented using C++ and the TGS OpenInventor libraries. The system consists of an off-line characteristic view extraction algorithm and an online retrieval process.
In our AVC method, every model was normalized for size by isotropically rescalling it so that the average Euclidean distance from points on its surface to the center of mass is 0.5. Then, all models were normalized for translation by moving their center of mass to the origin.
In the off-line process, the characteristic view selection takes about 18 s per model on a PC with a Pentium IV 2.4-GHz CPU. In the online process, the comparison takes less than 1 s for 1814 3-D models. To evaluate our method, we used two different 3-D-model databases. The PSB is a standard shape benchmark widely used in shape retrieval community. We also present our results on a more specific database, 5000 3-D CAD models pro-vided by the car manufacturer Renault within the framework of SEMANTIC project [24].
During our experiments, to show the contribution of the probabilistic approach to retrieval performance, we compare the probabilistic correspondence between two 3-D models to the use of a simple distance between the 3-D models. We define a dissimilarity between a 3-D-model and a query as
where is the Euclidean distance between the 2-D Zernike descriptors of the view of the request model and
the characteristic view of the 3-D model .
A. Data Set
Sections IV-A.1 and II present the 3-D-models databases we used in our experiments.
1) Princeton Shape Benchmark: PSB appeared in 2004 and
is one of the most exhaustive benchmarks for 3-D shape re-trieval. It contains a database of 1814 classified 3-D models col-lected from 293 different Web domains. There are many classi-fications given to the objects in the database. During our experi-ments we used the finest granularity classification, composed of
161 classes. Most classes contain objects with a particular func-tion (e.g., cars). Yet, there are also cases where objects with the same function are partitioned in different classes based on their shapes (e.g., round tables versus rectangular tables) [25]. We compare our method to some state-of-the-art shape-matching al-gorithms.
• D2 Shape Distribution: a histogram of distances between pairs of points on the surface [26].
• Extended Gaussian Image (EGI): a spherical function giving the distribution of surface normals [27].
• Complex Extended Gaussian Image (CEGI): a com-plex-valued spherical function giving the distribution of normals and associated normal distances of points on the surface [28].
• Q-Gram Statistics Descriptor (2-GR): a vector in 256-dimensional space, whose i-th co-ordinate is the number of 2-grams in the voxel representation of 3-D shape [29]. • Shape Histogram (SHELLS): a histogram of distances
from the center of mass to points on the surface [30]. • Shape Histogram (SECTORS): a spherical function
giving the distribution of model area as a function of spherical angles [30].
• Shape Histogram (SECSHELL): a collection of spher-ical functions that give the distribution of model area as a function of radius and spherical angles [30].
• Voxel: a binary rasterization of the model boundary into a voxel grid which is represented by the 32 spherical de-scriptors giving the intersection of the voxel grid with the concentric spherical shells.
• Spherical Extent Function (EXT): a spherical function giving the maximal distance from center of mass as a func-tion of the angle [31].
• Radialized Spherical Extent Function (REXT): a col-lection of spherical functions giving the maximal distance from the center of mass as a function of spherical angle and radius [32].
• Gaussian Euclidean Distance Transform (GEDT): a 3-D function whose value at each point is given by the composition of a Gaussian with the Euclidean Distance Transform of the surface [1].
• Spherical Harmonic Descriptor (SHD): a rotation in-variant representation of the GEDT obtained by computing the restriction of the function to cocentric spheres and storing the norm of each (harmonic) frequency [1]. • Light Field Descriptor (LFD): a representation of a
model as a collection of images rendered from uniformly sampled positions on a view sphere. The distance between two descriptors is defined as the minimum distance, taken over all rotations and all pairings of vertices on two dodecahedra [12].
Every model was normalized for size by isotropically rescaling it so that the average distance from points on its surface to the center of mass is 0.5. Then, for all descriptors except D2 and EGI, the model was normalized for translation by moving its center of mass to the origin. Next, for all de-scriptors except D2, SHELLS, SHD and LFD, the model was normalized for rotation by aligning its principal axes to the -, -, and -axes. The ambiguity between positive and negative
Fig. 6. 3-D models from PSB database [25].
axes was resolved by choosing the direction of the axes so that the area of model on the positive side of the -, -, and -axes was greater than the area on the negative side. Every spherical descriptor(EGI, CEGI, Sectors, etc.) was computed on a 64 64 spherical grid and represented by its harmonic coefficients up to order 16th order. Histograms of distances (D2 and Shells) were stored with 64 bins representing distances in the range . All descriptors, except LFD, were scaled to have -norm equal to 1. The LFD comprises 100 images encoded with 35 8-bit coefficients to describe Zernike moments and ten 8-bit coefficients to represent Fourier descriptors. For more details about the PSB database, refer to [25].
2) SEMANTIC-3D Database: The SEMANTIC project [24],
supported by the French Research Ministry and the RNRT aims to explore the techniques and tools preliminary to the realiza-tion of new services for the exploitarealiza-tion of 3-D contents through the Web. New techniques of compression, indexing and water-marking of 3-D data are developed and implemented in a indus-trial prototype application. These exchanges are ensured with a format of data standardized with functionalities of visualiza-tion and 3-D animavisualiza-tion. The exchanges are achieved on existing networks (internal network of the authors, wireless networks for the technicians, etc.).
In SEMANTIC project, our research group focuses on the indexing and retrieval of 3-D-data.
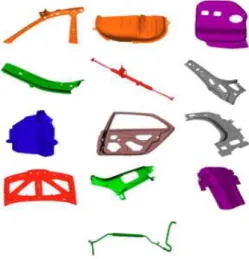
Within this framework, a database of 3-D CAD models was provided by the car manufacturer Renault which database contains 5000 of quite irregular polygonal meshes representing CAD parts. To measure the performance, we classified 758 models of this collection into 75 classes based on the judgment of two adult persons (Fig. 7), the 4242 other models were put in a class called ”others”. The smallest class contains four 3-D models. The largest class contains sixty-four 3-D models. Fig. 7 shows some 3-D models from the SEMANTIC Database.
B. Evaluation Criterion
To objectively evaluate our method we use a statistical tool provided by PSB to compare 3-D retrieval methods. Given a classification and a distance matrix computed with any shape matching algorithm, a suite of PSB tools produces statistics and visualizations that facilitate the evaluation of the match results [25].
The statistics that can be calculated using the PSB tools are: • Nearest neighbor: the percentage of the closest matches that belong to the same class as the query. This statistic pro-vides an indication of how well a nearest neighbor classifier would perform. Obviously, an ideal score is 100%, Higher scores represent better results.
Fig. 7. 3-D models from SEMANTIC database.
• First-tier and Second-tier: the percentage of models in the query’s class that appear within the top matches, where depends on the size of the query’s class. Specif-ically, for a class with members, for the first tier, and for the second tier. The first tier statistic indicates the recall for the smallest that could possibly include 100% of the models in the query class, while the second tier is a little less stringent (i.e., is twice as big). These statistics are similar to the Bull Eye Percentage Score , which has been adopted by the MPEG-7 visual SDs. In all cases, an ideal matching result gives a score of 100%, again higher values indicate better matches.
• E-Measure: a composite measure of the precision and re-call for a fixed number of retrieved results. The intuition is that a user of a search engine is more interested in the first page of query results than in later pages. So, this mea-sure considers only the first 32 retrieved models for every query and calculates the precision and recall over those re-sults. The E-Measure is defined as:
The E-measure is equivalent to subtracting van Rijs-bergen’s definition of the E-measure from 1. The max-imum score is 1.0, and higher values indicate better results • Discounted Cumulative Gain (DCG): a statistic that weights correct results near the front of the list more than correct results later in the ranked list under the assumption that a user is less likely to consider elements near the end of the list. Specifically, the ranked list is converted to a list , where element has a value 1 if element is in the correct class and 0 otherwise. DCG is then defined as follows:
The result is then divided by the maximum possible DCG (i.e., that would be achieved if the first elements were in
the correct class, where is the size of the class) to give the final score
where is the number of models in the database. The entire query result list is incorporated in an intuitive manner by the DCG [33].
• Recall versus Precision Curves: Recall versus Precision Curves are well known in the literature of content-based search and retrieval. The recall and precision are defined as follow:
where is the number of relevant models retrieved in the top retrievals, is the number of relevant models in the collection, which is the number of models to which the query belongs to.
V. EXPERIMENTS ANDRESULTS
A. Princeton Shape Benchmark
In our experiments, we computed the distances between all pairs of models in the PSB database and analyze them with the PSB evaluation tools to quantify the matching performance with respect to the base classification.
Fig. 8 shows a request using our 3-D retrieval system. On the left side, the request 3-D model is presented. The right side shows the 3-D models which have the highest probabilities of matching the 3-D request model.
As mentioned before, we use several performance measures to objectively evaluate our method: FT, ST, NN, DCG, and N-DCG match percentages, as well as the recall-precision plot [34].
Table I shows micro-average storage requirements (for our method, we used 23 views which is the average number of char-acteristic views for all the database models) and retrieval sta-tistics for each algorithm. Storage size is given in bytes. We found that micro and macro-average results gave consistent re-sults, and we decided to present micro-averaged statistics.
Fig. 9 shows the Recall versus Precision plots for our AVC method and some other shape descriptors. For visual clarity, we presented the curves of the most relevant algorithm only.
We find that the shape descriptors based on 2-D views (LFD and AVC) provide the best retrieval precision in this experiment. We might expect shape descriptors that capture 3-D geometric relationships would be more discriminating than the ones based solely on 2-D projections; however, the opposite is true.
Our method provides more accurate results with the use of Bayesian probabilistic indexing. The experiment shows that AVC gives better performance than 3-D harmonics, Radialized Spherical Extent Function, and Gaussian Euclidean Distance Transform on the PSB database. Light Field Descriptor gives better results than our method but uses 100 views, does not adapt the number of views to the geometrical complexity, and uses two descriptors for each view (Zernike moments and
Fig. 8. Screenshot of the 3-D-model retrieval system.
TABLE I
RETRIEVALPERFORMANCES FORPSB
Fourier descriptor), which makes it a slower and more memory consuming compared to the method we have presented.
Overall, we conclude that AVC gives a good compromise be-tween quality (relevance) and cost (memory and online compar-ison time) for the 3-D models of the PSB.
B. SEMANTIC-3D Database
The experiments are made on a database that contains 5000 3-D models. To objectively evaluate the performance of our method on this database, a classification was made (ground truth). 758 models are classified on 75 classes. A ”special” class called others contains all the 3-D models that were not classified.
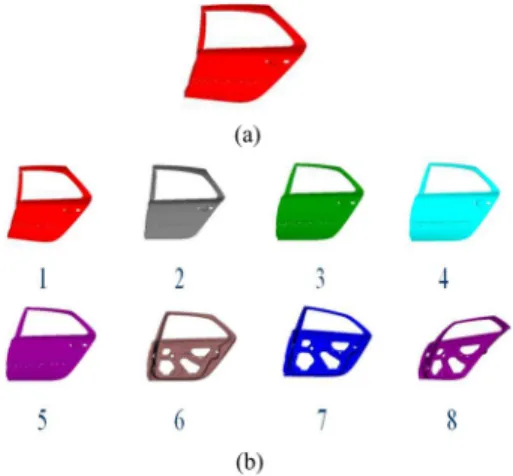
Fig. 10(a) shows a 3-D model from SEMANTIC database that is used as a query to our system. Fig. 10(b) shows the ranked
Fig. 10. (a) Query 3-D model and the (b) results on SEMANTIC database.
Fig. 11. Recall versus Precision for SEMANTIC database.
In Section III, we presented our probabilistic approach that uses two different parameters and . We conducted experi-ments on the SEMANTIC database using different values of and . Different Recall versus Precision plots have been com-puted (Fig. 11) for different and coefficients values.
Fig. 11 shows the Recall versus Precision plots for our AVC method on the SEMANTIC database. Some remarks can be achieved on these plots. First of all, when , the Recall versus Precision plot is the same as the one for our AVC
simple distance. This behavior could be explained easily by
re-placing in the (15) and (16) the values of and by 0. When and coefficients become greater than 1 the Recall versus Pre-cision plots looks like a random retrieval. The variation of and coefficients between 0 and 1 gives better Recall versus cision plots and scores. Experimentally, as Recall versus Pre-cision plots in Fig. 11 show, the best results are obtained for . That is why this value has been choosen for all experiments.
We can explain the good results of our method by the fact that the intra-class variance are very small. As the database contains real professional 3-D-CAD models, the 3-D models from the same class represent real mechanical automobile parts. The 3-D models from the same class represent different versions of the same models with small changes.
On the other hand, 3-D-CAD models in the database contain holes so that they can be attached to other mechanical parts.
Fig. 12. Robustness evaluation of noise and decimation from a 3-D model. (a) Orginal 3-D model. (b) Model with decimation. (c) Model with 5% noise. (d) Model with 10% noise. (e) Model with 15% noise.
The positions and the dimension of the holes can differentiate between two different models from the same class. As we repre-sent each view of the 3-D model by Zernike moments, the holes and the global shape are well taken into account. We can also notice the result enhancement when we use the probabilistic ap-proach for retrieval.
C. Robustness Evaluation of the Method
In order to assess the robustness of our method, we apply the following transformations for all classified 3-D models. Each transformed 3-D model is then used to query the test database.
The average recall and precision of all the 1814 classified models from the PSB database are used for the evaluation (Fig. 13). The robustness is evaluated by the following trans-formation.
1) Noise: to 15% of the 3-D model vertices we applied three random translations in the directions of -, -, and -axis ( , 10% and 15% the length of the model’s bounding box). Fig. 12(c)–(e) show typical examples of the noise effect.
2) Decimation: for each 3-D model, randomly select 20% polygons to be deleted. Fig. 12(b) shows a typical example of the decimation effect.
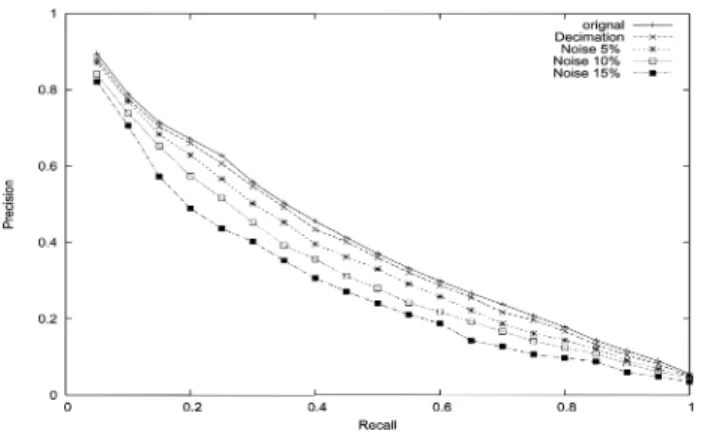
In Fig. 13, the first plot represents the original Recall versus Precision without any decimation nor noise addition. Decima-tion [Fig. 12(b)] gives very close results to the ones with the original models.
The Fig. 12 shows the effects of noise addition for different values 5%, 10%, and 15% on a 3-D-model; 5% noise addition could easily be obtained in real situations such as the use of a 3-D scanner to get a 3-D-model from a real object.
Precision versus Recall plots were computed for each value of noise and for decimation (Fig. 13). From these results, it can be observed that the performance of our approach is robust to 5% noise addition and to decimation. Even if 10% and 15% are high noise addition, Precision versus Recall plots (Fig. 13) shows that our approach remains quite robust. The 10% and 15% noise curve shows the ”limits” of our method in terms of noise robustness.
Fig. 13. Recall versus Precision on PSB database with deformations effects.
Fig. 14. (a) PC and (b) PDA browser interface of our online search engine.
D. On-Line Search Engine
The SEMANTIC project focuses on the development of tools and methods required to implement new operational services for retrieving 3-D content through the Web and communicating objects. Information and communication system must be avail-able for remote access and assistance, interconnecting origina-tors (mechanical part designers), nomadic users (automotive in-dustry technicians) and a central 3-D data server.
To test our algorithms and to assess the results presented in the previous sections, we developed an online 3-D search engine. Our search engine can be reached from any device having a compatible web browser (PC, PDA, SmartPhone, etc.) [35].
Fig. 14(a) shows the interface of our system using a PC web browser. Fig. 14(b) shows the interface of our system on PDA (Pocket PC under Windows Pocket 2003).
Depending on the web access device he/she is using, the user faces two different kinds of web interfaces: a rich web inter-face for full-featured web browsers [Fig. 14(a)], and a simpler interface for PDA web browsers [Fig. 14(b)]. In both cases, the results returned by the 3-D search engine are the same. The only difference lies in the design of the presentation of results.
Finally, the users should notice that, due to some copyright protection, the 3-D-CAD models from the SEMANTIC project are not available for public online use. The 3-D-database avail-able for tests of our 3-D search engine is the PSB database [25].
VI. DISCUSSION ANDCONCLUSION
In this paper, we propose a 3-D-model retrieval system based on characteristic view similarity which we called AVC. Starting from the fact that the more the 3-D model is geometrically com-plex, the more its 2-D views are different, we propose a char-acteristic view selection algorithm that relates the number of views to its geometrical complexity. Starting from 320 initial views, our algorithm selects the ”optimal” characteristic view set that best represents the 3-D model. The number of charac-teristic views varies from 1 to 40. We also propose a new proba-bilistic retrieval approach that takes into account that not all the views of 3-D models have the same importance, and also the fact that geometrically simple models have more probability to be relevant than more complex ones. Based on some standard measures, we compared our method to thirteen state-of-the-art methods on PSB database. Our method gives the second-best re-sults. The AVC method we proposed gives a good quality/cost compromise compared to other well-known methods. The re-sults of our method on a large 3-D-CAD-model database (5000 models) supplied by Renault, show that our method can also be suitable for 3-D-CAD-model retrieval. Our method is robust against noise and model degeneracy. It is usable in the case of topologically ill-defined 3-D model. A practical 3-D-model re-trieval system based on our approach is available on the web for online tests [35].
ACKNOWLEDGMENT
The authors would like to thank Professor D. Pelleg from Carnegie Mellon University for the help he provided on
-means.
REFERENCES
[1] M. Kazhdan, T. Funkhouser, and S. Rusinkiewicz, “Rotation invariant spherical harmonic representation of 3D shape descriptors,” in Proc.
Symp. Geometry Processing, Aachen, Germany, 2003.
[2] J. P. Vandeborre, V. Couillet, and M. Daoudi, “A practical approach for 3D model indexing by combining local and global invariants,” in Proc.
IEEE Int. Symp. 3D Data Processing, Visualization and Transmission,
Padova, Italy, Jun. 2002, pp. 644–647.
[3] G. Antini, S. Berretti, A. Del Bimbo, and P. Pala, “Retrieval of 3D objects using curvature correlograms,” in Proc. IEEE Int. Conf.
Multi-media & Expo, Tokyo, Japan, Jul. 2005.
[4] J. Assfalg, A. Del Bimbo, and P. Pala, “Spin images for retrieval of 3D objects by local and global similarity,” in Proc. IEEE Int. Conf. Pattern
Recognition, Aug. 2004, vol. 3, pp. 906–909.
[5] H. Sundar, D. Silver, N. Gagvani, and S. Dickinson, “Skeleton based shape matching and retrieval,” in Proc. IEEE Shape Modeling Int., 2003.
[6] T. Funkhouser, P. Min, M. Kazhdan, A. Haderman, D. Dobkin, and D. Jacobs, “A search engine for 3D models,” ACM Trans. Graph., vol. 22, no. 1, pp. 83–105, 2003.
[7] T. F. Ansary, J. P. Vandeborre, and M. Daoudi, “Bayesian approach for 3D models retrieval based on characteristic views,” in Proc. IEEE Int.
Conf. Pattern Recognition, Cambridge, U.K., Aug. 2004.
[8] T. F. Ansary, J. P. Vandeborre, S. Mahmoudi, and M. Daoudi, “A Bayesian framework for 3D models retrieval based on characteristic views,” in Proc. IEEE Int. Symp. 3D Data Processing, Visualization
and Transmission, Thessaloniki, Greece, Sep. 2004.
[9] C. M. Cyr and B. Kimia, “3D object recognition using shape similarity-based aspect graph,” in Proc. IEEE Int. Conf. Computer Vision, 2001, pp. 254–261.
[10] R. D. Schiffenbauer, A Survey of Aspect Graphs CIS, 2001, Tech. Rep. TR-CIS-2001-01.
[11] D. Macrini, A. Shokoufandeh, S. Dickenson, K. Siddiqi, and S. Zucker, “View based 3-D object recognition using shock graphs,” in Proc. IEEE
[12] D. Y. Chen, X. P. Tian, Y. T. Shen, and M. Ouhyoung, “On visual similarity based 3D model retrieval,” in Eurographics, 2003, vol. 22, pp. 223–232.
[13] J. W. H. Tangelder and R. C. Veltkamp, “A survey of content-based 3D shape retrieval methods,” in Proc. IEEE Shape Modeling Int., 2004, pp. 145–156.
[14] A. Khotanzad and Y. H. Hong, “Invariant image recognition by zernike moments,” IEEE Trans. Pattern Anal. Mach. Intell., vol. 12, no. 5, pp. 489–497, May 1990.
[15] W. Y. Kim and Y. S. Kim, “A region-based shape descriptor using zernike moments,” Signal Process.: Image Commun., vol. 16, pp. 95–100, 2000.
[16] R. O. Duda and P. E. Hart, Pattern Classification and Scene Analysis. New York: Wiley, 1973.
[17] D. Pelleg and A. Moore, “X-means: Extending K-means with effi-cient estimation of the number of clusters,” in Proc. Int. Conf. Machine
Learning, 2000, pp. 727–734.
[18] H. Akaike, “Information theory and extention of the maximum like-lihood principle,” in IEEE Int. Symp. Information Theory, 1973, pp. 267–281.
[19] G. Schwarz, “Estimating the dimension of a model,” Ann. Statist., vol. 6, pp. 461–464, 1978.
[20] J. O. Berger and L. Pericchi, “The intrinsic Bayes factor for model selection and prediction,” J. Amer. Statist. Assoc., pp. 109–122, 1994. [21] K. P. Burnham and D. Anderson, Model Selection and Multi-model
Inference. New York: Springer-Verlag, 2002.
[22] H. Bozdogan, “Model selection and Akaike’s information criteria (AIC): The general theory and its analytical extentions,”
Psychome-trika , vol. 52, pp. 354–370, 1987.
[23] E. Lebarbier and T. Mary-Huard, Le Critère BIC: Fondements théoriques et interprétation INRIA, 2004, Tech. Rep. RR5315. [24] Semantic Project [Online]. Available: http://www.semantic-3d.net [25] Princeton Shape Benchmark 2004 [Online]. Available: http://shape.cs.
princeton.edu/benchmark
[26] R. Osada, T. Funkhouser, B. Chazells, and D. Dobkin, “Matching 3D models with shape distributions,” in Proc. IEEE Shape Modeling Int., May 2001.
[27] B. Horn, “Extended Gaussian images,” Proc. IEEE 72, vol. 12, pp. 1671–1686, Dec. 1984.
[28] S. Kang and K. Ikeuchi, “Determining 3D object pose using the com-plex extended gaussian image,” in Proc. IEEE Int. Conf. Computer
Vi-sion and Pattern Recognition, Jun. 1991, pp. 580–585.
[29] E. Ivanko and D. Pervalov, “Q-gram statistics descriptor in 3D shape classification,” in Proc. Int. Conf. Advances in Pattern Recognition, Aug. 2005, pp. 360–367.
[30] M. Ankerst, G. Kastenmuller, H. P. Kriegel, and T. Seidl, “Nearest neighbor classification in 3D protein databases,” in Int. Soc. Behav.
Med., 1999.
[31] D. Saupe and D. V. Vranic, “3D model retrieval with spherical har-monics and moments,” in German Assoc. Pattern Recognit. (DAGM), Sep. 2001, pp. 392–397.
[32] D. V. Vranic, “An improvement of rotation invariant 3D shape de-scriptor based on functions on concentric spheres,” in Proc. IEEE Int.
Conf. Image Processing, 2003, pp. 757–760.
[33] G. Leifman, S. Katz, A. Tal, and R. mei, “Signatures of 3d models for retrieval,” in 4th Israel-Korea Bi-Nat. Conf. Geometric Modeling and
Computer Graphics, Aug. 2003, pp. 159–163.
[34] P. Shilane, P. Min, M. Kazhdan, and T. Funkhouser, “The princeton shape benchmark,” in IEEE Shape Modeling Int., 2004.
[35] Fox-Miire—3D Search Engine [Online]. Available: http://www-rech. enic.fr/3dretrieval
Tarik Filali Ansary received the B.E. degree
from Ecole Marocaine des Sciences de l’Ingénieur, Morocco, in 2002, and the M.S. degree from the University of Sciences and Technologies of Lille (USTL), Lille, France, in 2003, both in computer science. He received the Ph.D. degree in 2006 from the Institut National des Télécommunications, France, and at USTL with the FOX-MIIRE research group at the LIFL (UMR USTL/CNRS 8022), a Research Laboratory in the computer science field of the USTL.
His principal research interests include 3-D content-based retrieval, multi-media indexing, and retrieval from content.
Mohamed Daoudi (M’97) received the Ph.D. degree
in computer science from the University of Sciences and Technologies of Lille (USTL), Lille, France, in 1993 and the accreditation to supervise research (HDR) in computer science from the University of Littoral, Littoral, France, in 2000.
Since 1994, he has been an Associate Professor in the Computer Science Department, INT/Télécom Lille 1, where he teaches courses on data structures, distributed algorithms, and computer vision. From 2004 to 2005, he was a Professor at the Ecole Polytechnique de Tours. From 2000 to 2004, he was the Head of the MIIRE group of LIFL (UMR USTL/CNRS 8022), a Research Laboratory in the computer science field of the USTL. His research interests include digital pattern recognition, image processing, invariant representation of images and shapes, neural network, and three-dimensional content-based retrieval. He has contributed to more than 60 articles in journals and conference proceedings.
Dr. Daoudi has served as a Program Committee member for the Interna-tional Conference on Pattern Recognition (ICPR) in 2004 and the InternaInterna-tional Conference on Multimedia and Expo (ICME) in 2004 and 2005. He is a fre-quent reviewer for IEEE TRANSACTIONS ONPATTERNANALYSIS ANDMACHINE
INTELLIGENCE, and for Pattern Recognition Letters.
Jean-Philippe Vandeborre received the M.S. degree
in 1997 and the Ph.D. degree in computer science in 2002, both from the University of Sciences and Tech-nologies of Lille (USTL), Lille, France.
Currently, he is an Assistant Professor of the Groupe des Ecoles des Télécommunications (GET) at INT/Télécom Lille 1 (a graduate engineering school in information technology and communica-tions), France, in the Computer Science and Network Department where he teaches TCP/IP networks, Unix systems, and computer graphics. He is also a member of the LIFL (UMR USTL/CNRS 8022), a Research Laboratory in the Computer Science field of the USTL. His current research interests are mainly focused on 3-D model analysis, and include multimedia indexing and retrieval from content and their applications.
![Fig. 6. 3-D models from PSB database [25].](https://thumb-eu.123doks.com/thumbv2/123doknet/12429841.334443/7.891.502.785.99.213/fig-d-models-from-psb-database.webp)