HAL Id: inserm-00360790
https://www.hal.inserm.fr/inserm-00360790v2
Submitted on 2 Mar 2009HAL is a multi-disciplinary open access
archive for the deposit and dissemination of sci-entific research documents, whether they are pub-lished or not. The documents may come from teaching and research institutions in France or abroad, or from public or private research centers.
L’archive ouverte pluridisciplinaire HAL, est destinée au dépôt et à la diffusion de documents scientifiques de niveau recherche, publiés ou non, émanant des établissements d’enseignement et de recherche français ou étrangers, des laboratoires publics ou privés.
Evaluation of 14 nonlinear deformation algorithms
applied to human brain MRI registration.
Arno Klein, Jesper Andersson, Babak Ardekani, John Ashburner, Brian
Avants, Ming-Chang Chiang, Gary Christensen, D. Louis Collins, Pierre
Hellier, Joo Hyun Song, et al.
To cite this version:
Arno Klein, Jesper Andersson, Babak Ardekani, John Ashburner, Brian Avants, et al.. Evaluation of 14 nonlinear deformation algorithms applied to human brain MRI registration.. NeuroImage, Elsevier, 2009, 46 (3), pp.786-802. �10.1016/j.neuroimage.2008.12.037�. �inserm-00360790v2�
Evaluation of 14 nonlinear deformation
algorithms applied to human brain MRI
registration
Arno Klein
a,∗, Jesper Andersson
b, Babak A. Ardekani
c,d,
John Ashburner
e, Brian Avants
f, Ming-Chang Chiang
g,
Gary E. Christensen
h, D. Louis Collins
i, James Gee
f,
Pierre Hellier
j,k, Joo Hyun Song
h, Mark Jenkinson
b,
Claude Lepage
i, Daniel Rueckert
m, Paul Thompson
g,
Tom Vercauteren
n,ℓ, Roger P. Woods
o, J. John Mann
a,
Ramin V. Parsey
aaNew York State Psychiatric Institute, Columbia University, NY, NY 10032, USA bFMRIB Centre, University of Oxford, Department of Clinical Neurology, John
Radcliffe Hospital, Oxford OX3 9DU, UK
cNathan Kline Institute, Orangeburg, NY, 10962, USA dNew York University School of Medicine, NY, NY 10016, USA
eFunctional Imaging Laboratory, Wellcome Trust Centre for Neuroimaging, London
WC1N 3BG, UK
f Penn Image Computing and Science Laboratory, Department of Radiology,
University of Pennsylvania, Philadelphia, PA 19104-2644, USA
gLaboratory of Neuro Imaging, UCLA School of Medicine, Los Angeles, CA
90095-7332, USA
hDept. of Electrical and Computer Engineering, University of Iowa, Iowa City, IA
52242, USA
iMcConnell Brain Imaging Center, Montreal Neurological Institute, Montreal, QC
H3A 2B4, Canada
jINRIA Rennes, Bretagne Atlantique Research Centre, Campus universitaire de
Beaulieu, 35042 Rennes Cedex, France
kINSERM, Visages U746, IRISA, Campus de Beaulieu, Rennes, France ℓINRIA Sophia Antipolis - Méditerranée, 06902 Sophia Antipolis, France mVisual Information Processing, Department of Computing, Imperial College,
London SW7 2BZ, UK
nMauna Kea Technologies, 75010 Paris, France
oDepartment of Neurology, David Geffen School of Medicine at UCLA, Los
Abstract
All fields of neuroscience that employ brain imaging need to communicate their results with reference to anatomical regions. In particular, comparative morphometry and group analysis of functional and physiological data require coregistration of brains to establish correspondences across brain structures. It is well established that linear registration of one brain to another is inadequate for aligning brain structures, so numerous algorithms have emerged to nonlinearly register brains to one another. This study is the largest evaluation of nonlinear deformation algorithms applied to brain image registration ever conducted. Fourteen algorithms from laboratories around the world are evaluated using 8 different error measures. More than 45,000 registrations between 80 manually labeled brains were performed by algorithms including: AIR, ANIMAL, ART, Diffeomorphic Demons, FNIRT, IRTK, JRD-fluid, ROMEO, SICLE, SyN, and four different SPM5 algorithms (“SPM2-type” and regular Normalization, Unified Segmentation, and the DARTEL Toolbox). All of these registrations were preceded by linear registration between the same image pairs using FLIRT. One of the most significant findings of this study is that the relative performances of the registration methods under comparison appear to be little affected by the choice of subject population, labeling protocol, and type of overlap measure. This is important because it suggests that the findings are generalizable to new subject populations that are labeled or evaluated using different labeling protocols. Furthermore, we ranked the 14 methods according to three completely independent analyses (permutation tests, one-way ANOVA tests, and indifference-zone ranking) and derived three almost identical top rankings of the methods. ART, SyN, IRTK, and SPM’s DARTEL Toolbox gave the best results according to overlap and distance measures, with ART and SyN delivering the most consistently high accuracy across subjects and label sets. Updates will be published on the http://www.mindboggle.info/papers/ website.
∗ Corresponding author
Email address: [email protected](Arno Klein).
1 Introduction
Brain mapping – mapping the structures, physiology, functions, and connectivity of brains in individuals and in different populations – is possible due to a diverse but often disconnected array of brain imaging technologies and analysis methods. To make the best use of brain image data, researchers have attempted for over 40 years to establish a common reference frame such as a three-dimensional coordinate or labeling system to consistently and accurately communicate the spatial relationships within the data (Talairach and Szikla, 1967; Talairach and Tournoux, 1988; Drury et al., 1996; Fischl et al., 1999; Clouchoux et al., 2005). A common reference frame helps us to:
1. communicate and compare data
(across subjects, time, conditions, and image types), 2. classify data
(by meaningful spatial positions or extent), and 3. find patterns in data
(to infer structural or functional relationships).
These three benefits are contingent on one serious premise: positions and sizes in one brain must correspond to positions and sizes in another brain to make comparisons.
This premise almost universally does not hold when brain image data are compared across individuals. The noise that this introduces is often accepted by researchers who generally assume that if they have found corresponding features across two brains, the intervening points between those features correspond to one another as well. Brains are so variable in shape that there simply may not exist a point-to-point correspondence across any two brains, or even in the same brain over time.
Explicit manual labeling of brain regions is the preferred approach for establishing anatomical correspondence, but it is too prohibitive in terms of time and resources, particularly in cases where neuroanatomists are not available, in intraoperative or other time-sensitive scenarios, and in high-throughput environments that need to process dozens to thousands of brain images.1.
1 To indicate the level of investment required to manually label brain anatomy, the
Center for Morphometric Analysis (CMA) at the Massachusetts General Hospital (MGH) expects at least one month of training to train new technicians to the point of acceptable inter-rater reliability using their Cardviews (Caviness et al., 1996) labeling protocol and software; once trained, it takes hours to weeks to manually label a single brain. For 12 of the brains used in this study, a trained assistant took two weeks to label each brain. At this rate, performing a modest imaging study with 20 subjects and 20 controls would require 20 months devoted strictly to labeling. Manual labeling also suffers from inconsistencies within and across human labelers
Automatically determining anatomical correspondence is almost universally done by registering brains to one another or to a template. There has been a proliferation of different approaches to perform image registration that demands a comparison to guide choices regarding algorithms, software implementation, setup and parameters, and data preprocessing options. To better enable individuals to make these choices, the Valmet software tool (http://www.ia.unc.edu/public/valmet/) (Gerig et al., 2001) and the Non-rigid Image Registration Evaluation Project (NIREP) (http://www. nirep.org) were developed. The Windows-based Valmet was in 2001 the first publicly available software tool for measuring (as well as visualizing) the differences between corresponding image segmentations, but has received only one minor update since 2001 (in 2004). It uses several algorithms to compare segmentations: overlap ratio, Hausdorff distance, surface distance, and probabilistic overlap. The NIREP project “has been started to develop, establish, maintain, and endorse a standardized set of relevant benchmarks and metrics for performance evaluation of nonrigid image registration algorithms.” The initial phase of the project will include 16 manually labeled brain images (32 labeled regions in 8 men and 8 women) and four evaluation metrics: 1. relative overlap (equivalent to the “union overlap” defined in the Materials and methods section), 2. variance of the registered intensity images for an image population, 3. inverse consistency error between a forward and reverse transformation between two images, and 4. transitivity (how well all the pairwise registrations of the image population satisfy the transitivity property).
In this study we set out to evaluate what we believe are the most important nonlinear deformation algorithms that have been implemented in fully automated software programs and applied to human brain image registration. We measure accuracy at the scale of gross morphologi cal structures (gyri, sulci, and subcortical regions) acquired by magnetic resonance imaging (MRI). There have been two significant prior studies that compared more than three nonlinear deformation algorithms for evaluating whole-brain registration. The first was communicated in a series of publications by Hellier et al. (Hellier et al., 2001a, 2002, 2003); they compared five different fully automated nonlinear brain image registration software programs using the same set of quantitative measures. These included global measures comparing 17 deformed MRI source images and one target image: average brain volume, gray matter overlap, white matter overlap, and correlation of a measure of curvature, and local measures of distance and shape between corresponding principal sulci. Our study includes a version of each of the five methods and is different primarily because (1) all tests were conducted by a single individual (the first author) who had not authored any of the software packages, but received (Caviness et al., 1996; Fiez et al., 2000; Towle et al., 2003)
guidance from the principal architects of the respective algorithms, (2) its focus is on manually labeled anatomical regions, and (3) each and every brain was used as a source and as a target for registration rather than selecting a single target.
The second is a recent paper (Yassa and Stark, 2009) that compares nonlinear registration methods applied to regions in the medial temporal lobe; six of the methods are fully automated and two are semi-automated (requiring manual identification of landmarks). They apply these methods either to manually labeled brain regions, to weighted masks for these regions, or to the original unlabeled brains, as in our study. The four methods that they applied to unlabeled brains (and evaluated on regions in the medial temporal lobe) are the Talairach piecewise linear approach and three SPM programs (included in our study). Registering labeled regions obviously requires that the regions be labeled; their ROI-AL approach ‘labels to register’ rather than ‘registers to label’ or ‘registers without labels.’ They used two evaluation measures on pairs of images (20 MRI volumes total): an overlap measure (equivalent to the “target overlap” defined in the Materials and methods section) and a measure of blur in a group average of coregistered images. What sets our study apart from both of these prior studies is the unparalleled scale and thoroughness of the endeavor:
What sets our study apart from both of these prior studies is the unparalleled scale and thoroughness of the endeavor:
• over 14 nonlinear algorithms
• each algorithm applied at least 2,168 times (over 45,000 registrations total) • 80 manually labeled brain images
• 4 different whole-brain labeling protocols (56 to 128 labeled regions) • 8 different evaluation measures
• 3 independent analysis methods
This study evaluates 15 registration algorithms, one linear (FLIRT) and 14 nonlinear: AIR, ANIMAL, ART, Diffeomorphic Demons, FNIRT, IRTK, JRD-fluid, ROMEO, SICLE, SyN, and four different SPM5 algorithms (“SPM2-type” and regular Normalization, Unified Segmentation, and the DARTEL Toolbox; DARTEL was also run in a pairwise manner and all four SPM algorithms were run with and without removal of skulls from the images). The linear algorithm was included as an initialization step to establish a baseline prior to applying the nonlinear algorithms. Comparisons among the algorithms and their requirements are presented in Table 1 and in the Appendix, software commands are in Supplementary section 7, and brief descriptions are in Supplementary section 8. Many of them are in common use for registering structural MRIs to each other or to templates for neuromorphometric research or as an intermediary to compare functional or physiological data (Gholipour
et al., 2007), but some of them exist only as pre-release code made available by their respective authors for this study. See the “Algorithms excluded from the study” section in the Discussion for algorithms excluded from the study. Additional materials and updated information will be made publicly available via the website http://www.mindboggle.info/papers/.
2 Materials and methods
In this section, we first briefly describe the acquisition and preparation of the brain image and label data. Then we outline the preprocessing (brain extraction and formatting), linear registration, and nonlinear registration stages applied to the data, our evaluation measures, and our analysis methods. The first author performed these latter steps on an OSX system (Mac Pro 2-Quad-Core (8-processor) Intel Xeon, 3 GHz, 6 GB RAM) with a 10.4 operating system, except where noted (see Supplementary section 7).Custom Python (http://www.python.org) and Matlab (http://www.mathworks. com) software programs performed the preprocessing steps, called the different programs to process thousands of pairs of images, computed the results for evaluation, and produced the visualizations in the Results section.
Algorithm Deformation ≃dof Similarity Regularization FLIRT Linear, rigid-body 9, 6 norm. CR
AIR 5th-order polynomial warps 168 MSD (opt. intensity scaling)
Incremental increase of polynomial order; MRes: sparse-to-fine voxel sampling
ANIMAL Local translations 69K CC MRes, local Gaussian smoothing; stiffness parameter weights mean deformation vector at each node ART Non-parametric,
homeomorphic
7M norm. CC MRes median and low-pass Gaussian filtering Diffeomorphic Demons Non-parametric, diffeomorphic displacement field
21M SSD MRes: Gaussian smoothing
FNIRT Cubic B-splines 30K SSD Membrane energy*
MRes: down- to up-sampling; number of basis components
IRTK Cubic B-splines 1.4M norm. MI None used in the study; MRes: control mesh and image
JRD-fluid Viscous fluid: variational calculus (diffeomorphic)
2M Jensen-Rényi divergence
Compressible viscous fluid governed by the Navier-Stokes equation for conservation of momentum; MRes ROMEO Local affine (12 dof) 2M Displaced
frame difference
First-order explicit regularization method, brightness constancy constraint
MRes: adaptive multigrid (octree subdivision), Gaussian smoothing SICLE 3-D Fourier series
(diffeomorphic)
8K SSD Small-deformation linear elasticity, inverse consistency
MRes: number of basis components SyN Bi-directional
diffeomorphism
28M CC MRes Gaussian smoothing of the velocity field, transformation symmetry
SPM5: “SPM2-type” Normalization
Discrete cosine transforms 1K MSD Bending energy, basis cutoff Normalization Discrete cosine transforms 1K MSD Bending energy, basis cutoff Unified
Segmentation
Discrete cosine transforms 1K Generative segmentation model
Bending energy, basis cutoff
DARTEL Toolbox Finite difference model of a velocity field (constant over time, diffeomorphic)
6.4M Multinomial model (“congealing”)
Linear-elasticity; MRes: full-multigrid (recursive)
Table 1
Deformation model, approximate number of degrees of freedom (dof), similarity measure, and regularization method for each of the algorithms evaluated in this study. The dof is estimated based on the parameters and data used in the study; approximate equations, where available, are given in each algorithm’s description in the Supplementary section 8. Software requirements, input, and run time for the algorithms are in the Appendix. *Since this study was conducted, FNIRT uses bending energy as its default regularization method. MRes=multiresolution; norm=normalized; MSD=mean squared difference; SSD=sum of squared differences; CC=cross-correlation; CR=correlation ratio; MI=mutual information
Fig. 1. Brain image data. The study used four different image datasets with a total of 80 brains. The datasets contain different numbers of subjects (n) and different numbers of labeled anatomical regions (r) derived from different labeling protocols: LPBA40 (LONI Probabilistic Brain Atlas: n=40, r=56), IBSR18 (Internet Brain Segmentation Repository: n=18, r=84), CUMC12 (Columbia University Medical Center: n=12, r=128), and MGH10 (Massachusetts General Hospital: n=10, r=74). A sample brain from each dataset is shown. For each brain, there are three columns (left to right): original T1-weighted MRI, extracted brain registered to nonlinear MNI152 space, and manual labels registered to nonlinear MNI152 space (used to extract the brain). Within each column the three rows (top to bottom) correspond to sagittal (front facing right), horizontal (front facing top, right on right side), and coronal (right on right side) views. The LPBA40 brains had already been extracted and registered to MNI (MNI305 vs. MNI152) space (Shattuck et al., 2008). The scale, position, and contrast of the MR images have been altered for the figure. The colors for the manual labels do not correspond across datasets.
2.1.1 Image acquisition and manual labels
Brain image data (T1-weighted MRIs and corresponding manual labels) for 80 normal subjects were acquired from four different sources (see Fig. 1 and Table 2, and Caveats section in the Discussion regarding label reliability): LPBA40: 40 brain images and their labels used to construct the LONI Probabilistic Brain Atlas (LPBA40) at the Laboratory of Neuro Imaging (LONI) at UCLA (Shattuck et al., 2008) are available online (http:// www.loni.ucla.edu/Atlases/LPBA40). They were preprocessed according to existing LONI protocols to produce skull-stripped brain volumes. These volumes were aligned to the MNI305 atlas (Evans et al., 1993) using rigid-body transformation to correct for head tilt and reduce bias in the manual labeling process. This produced a transform from native space to labeling space and an associated inverse transform. In each of the 40 subjects, 56 structures were manually labeled according to custom protocols (http:// www.loni.ucla.edu/Protocols/LPBA40) using BrainSuite software (http: //brainsuite.usc.edu/). Brain masks were constructed from the manual labels and projected back to the native (labeling) space to produce brain-only MRI volumes. These volumes were then corrected for non-uniformity using BrainSuite’s Bias Field Corrector. Sulci were used as boundaries; white matter voxels that occurred between the boundaries of sulci and their surrounding gray matter were included in the structure. This is the only dataset where white matter is included with gray-matter regions.
After all of the registrations were conducted, we found errors in two of the LPBA40 subjects, particularly with the right putamen. We brought this to LONI’s notice and it is being corrected for future downloads. The impact of these errors on the present study appears to be negligible, as may be seen in Figs. 7 and 13, where there appears to be little difference between the average values for the left and right putamen.
IBSR18: 18 brain images acquired at different laboratories are available through the Internet Brain Segmentation Repository (http://www.cma.mgh. harvard.edu/ibsr/) as IBSR v2.0. The T1-weighted images have been rotated to be in Talairach alignment (Talairach and Tournoux, 1988) and have been processed by the CMA (Center for Morphometric Analysis, Massachusetts General Hospital (MGH) in Boston) ‘autoseg’ bias field correction routines. They were manually labeled with NVM software (http: //neuromorphometrics.org:8080/nvm/), resulting in 84 labeled regions. CUMC12: 12 subjects were scanned at the Columbia University Medical Center on a 1.5 T GE scanner. Images were resliced coronally to a slice thickness of 3 mm, rotated into cardinal orientation, then segmented and manually labeled by one technician trained according to the Cardviews
Dataset Subjects Ages µ=mean Volume (mm) Voxel (mm) TR (ms) TE (ms) flip ∠ LPBA40 40 (20 ♂, 20 ♀) 19–40 µ=29.20 256×256×124 38=0.86×0.86×1.5 2=0.78×0.78×1.5 10-12.5 4.2-4.5 20◦ IBSR18 18 (14 ♂, 4 ♀) 7–71 µ=38.4 +4 “juve-niles” 256×256×128 8=0.94×0.94×1.5 6=0.84×0.84×1.5 4=1×1×1.5 CUMC12 12 (6 ♂, 6 ♀) right-handed 26–41 µ=32.7 256×256×124 0.86×0.86×1.5 34 5 45◦ MGH10 10 (4 ♂, 6 ♀) 22–29 µ=25.3 256×256×128 1×1×1.33 6.6 2.9 8◦ Table 2
MRI acquisition parameters. Dataset, number and ages of subjects, volume and voxel dimensions in native space, TR, TE, and flip angle. The images were registered to either the nonlinear MNI152 or MNI305 atlas (see text) in a 181×217×181 volume of 1mm3
voxels.
labeling scheme (Caviness et al., 1996) created at the CMA, and implemented in Cardviews software (http://www.cma.mgh.harvard.edu/ manuals/parcellation/). The images have 128 labeled regions.
MGH10: 10 subjects were scanned at the MGH/MIT/HMS Athinoula A. Martinos Center for Biomedical Imaging using a 3 T Siemens scanner and standard head coil. The data were inhomogeneity-corrected, affine-registered to the MNI152 template (Evans et al., 1992), and segmented using SPM2 software (Friston et al., 1995). The images were manually labeled by Tourville of Boston University using Ghosh’s ASAP software (Nieto-Castanon et al., 2003); the labeling protocol (Tourville and Guenther, 2003) is similar to Cardviews, and in the version used for this study produces 74 labeled regions.
2.1.2 Brain extraction
To register the brains with each other, we extracted each brain from its whole-head image by constructing a mask from the corresponding manually labeled image (see Fig. 1). However, since white matter and cerebrospinal fluid were not fully labeled in all of the images, they had to be filled to create solid masks. For this, the non-background image in each sagittal slice was dilated by one pixel, any holes were filled, and then the image was eroded by one pixel. This procedure was repeated sequentially on the resulting volume for the coronal, horizontal, and again for the sagittal slices, and resulted in a volume containing the filled brain mask. This manual label-based skull-stripping procedure was performed on each MRI volume in the IBSR18, CUMC12, and MGH10 sets, but not for those in the LPBA40 set; the LPBA40 images had already been similarly prepared, but dilated and eroded with a larger and spherical structural element (neighborhood) (Shattuck et al., 2008). All four SPM algorithms were also run on whole-head images.
2.1.3 File preparation
All image and label volumes were in right-handed orientation and were converted to Analyze 7.5 (.img, .hdr) format (except for MINC format used by ANIMAL) because it was the most common image format accepted by the different software programs, and the only format presently compatible with AIR, ART, JRD-fluid, and SICLE (see Appendix B). This itself was a cause of difficulties, because the different software packages deal with Analyze header information differently, in particular with respect to leftÐright flipping and origin location. Because of this and because of discrepancies between brain and atlas origins for some of the data sets, origin and orientation information was removed from each of the image and label volumes using FSL’s “fslorient -deleteorient” and “fslchfiletype” commands. The NiFTI data format, accepted by most of the f/MRI software packages, obviates these concerns and is recommended over the Analyze format (http://nifti.nimh.nih. gov/). Exceptions to the above steps were made for SPM5’s template-based algorithms (Normalization, Unified Segmentation, and DARTEL Toolbox, but not “SPM2-type” Normalization): Analyze images were flipped right-to-left to left-handed orientation, and header orientation discrepancies were corrected using spm_get_space.m (other algorithms were unaffected after the fslorient command above).
Some extra preparation had to be done to accommodate the recommendations for running the individual software packages (see Appendix B), which included writing parameter files, intensity correction, padding, smoothing, and reorientation (in the case of SPM). For example, parameter files were required for ROMEO, IRTK, and for each registration pair when using SICLE, and command-line parameters had to be reset to make some of the programs run in less than an hour or so per registration. SICLE required considerable preparation: we wrote a Python script to generate the input parameter files and create output directories, normalized intensities in Matlab, and padded versions of all of the image volumes so that their dimensions were divisible by 16 (e.g., 181×217×181 files were padded to 224×224×192).
2.2 Linear registration as initialization
We linearly registered 40 of the brain images to a template using FMRIB Software Library’s (FSL) FLIRT (with the following settings: 9-parameter, correlation ratio, trilinear interpolation; see Fig. 1). The template was the “nonlinear MNI152,” the nonlinear average template in MNI space used by FSL (MNI152_T1_1mm_brain: 181×217×181 voxels, 1×1×1 mm/voxel). The remaining 40 images were from the LPBA40 set and had already been registered to the MNI305 atlas.
We then rigidly registered each of the 80 brains in MNI space, Is, to each of
the other brains in its group, It, again using FLIRT (6-parameter, correlation
ratio, trilinear interpolation). This resulted in 2,168 linear transforms Xs→t
and transformed images in MNI space Is→t (a straight arrow denotes linear
registration), with 2,088 of them representing non-identical source-target pairs (402+182+122+102−80). These linearly transformed source images, or “linear
source images,” serve as the input to each of the algorithms under comparison. We applied the above linear and rigid-body transforms (with nearest-neighbor interpolation) to the corresponding manually labeled volumes Ls, resulting in
the “linear source labels” Ls→t below (and in Figs. 2 and 3).
2.3 Nonlinear registration
Each of the nonlinear registration algorithms in the study then registered each of the 2,168 linear source images Is→t to its corresponding target
image It. We applied the resulting nonlinear transformation X[s→t];t (with
nearest-neighbor interpolation) to the corresponding linear source labels Ls→t,
producing warped source labels L[s→t];t (a curved arrow denotes nonlinear
registration). These labels are compared against the manual labels of the target, Lt, for evaluating registration performance. See Figs. 2 and 3 for the
context and Supplementary section 7 for the software commands used for each algorithm. Note that some structures were removed during preprocessing prior to computing the transforms, such as the cerebellum in the LPBA40 set, but were included when applying the transforms to the source labels.
2.4 Evaluation measures
We used volume and surface overlap, volume similarity, and distance measures to evaluate how well individual anatomical regions as well as total brain volumes register to one another. For this section and for Fig. 4, source S refers to a registered image to be compared with its registration target T (in our case, the warped source labels L[s→t];t and the target labels Lt). These evaluation
measures assume the manual label sets are correct, or “silver standards.”
2.4.1 Volume overlap
We used three overlap agreement measures and two overlap error measures, each quantifying some fraction of source S and target T volumes where their labels agree or disagree. For information on overlap measures, including cases for multiple and fractional labels, see (Crum et al., 2005). The first overlap
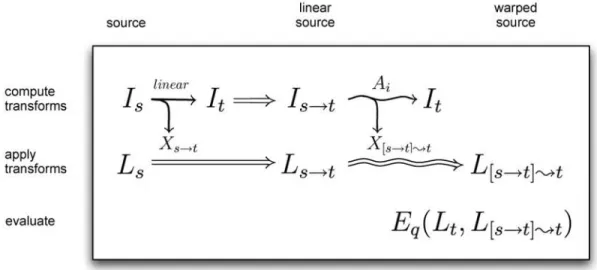
Fig. 2. Registration equations. The three stages of the study were to compute, apply, and evaluate registration transforms. To compute the transforms, we linearly registered each source image Is to a target image It (both already in MNI space),
resulting in a “linear source image” Is→tas well as a linear transform Xs→t(a straight
arrow denotes linear registration). Each nonlinear algorithm Ai then registered
(warped) the linear source image to the same target image, generating a second, nonlinear transform X[s→t];t (a curved arrow denotes nonlinear registration). We applied the linear transform to the source labels Lsto give the corresponding “linear
source labels” Ls→t, and applied the nonlinear transform to Ls→t to produce the
final warped source labels L[s→t];t. Finally, we compared these labels to the manual labels for the target, Lt, using a set of evaluation measures Eq.
agreement measure is the “target overlap,” T O, the intersection between two similarly labeled regions r in S and T divided by the volume of the region in T, where || indicates volume computed as the number of voxels:
T Or=
|Sr∩ Tr|
|Tr|
(1) Target overlap is a measure of sensitivity. When summed over a set of multiple labeled regions, we have the total overlap agreement measure for a given registration: T O= P r|Sr∩ Tr| P r|Tr| (2) Our second overlap agreement measure is the “mean overlap,” MO, a special case of the Kappa coefficient (Zijdenbos et al., 1994) sometimes called the Dice coefficient; it is the intersection divided by the mean volume of the two regions, which may again be summed over multiple regions:
M O= 2 P r|Sr∩ Tr| P r(|Sr| + |Tr|) (3)
Fig. 3. Overview. This diagram provides an overview of the study for a single nonlinear registration algorithm, placing example preprocessed data from Figure 1 into the equations of Figure 2. The three stages include linear registration, nonlinear registration, and evaluation (left to right). The four different datasets (LBPA40, IBSR18, CUMC12, and MGH10) are aligned along the left in four different versions: images, surfaces derived from the images, labels, and borders derived from the labels. A source and target are drawn from each version (image volumes are shown as coronal slices for clarity). A source image Is is linearly then nonlinearly registered
to a target image It. The linear and nonlinear transforms (Xs→t and X[s→t];t) are
applied to the corresponding source labels Ls. The resulting nonlinearly transformed
labels L[s→t];tare compared against the target labels Lt. This comparison is used to
calculate volume overlap and volume similarity per region. The target surface St is
intersected with the target labels Ltand warped source labels L[s→t];t to calculate
surface overlap. Borders between each labeled region and all adjacent labeled regions are constructed from Lt and L[s→t];t, and average distances between the resulting
Fig. 4. Overlap. This study uses volume and surface overlap, volume similarity, and distance measures to evaluate the accuracy of registrations. The equations for the three overlap measures: target overlap, mean overlap, and union overlap use the terms in this schematic Venn diagram of two partially overlapping objects, a source S and a target T . Their intersection is denoted by S ∩ T and their union by S ∪ T . S\T indicates the set (theoretic complement) of elements in S but not in T . Our third overlap agreement measure is the “union overlap,” UO, or Jaccard coefficient (Gee et al., 1993; Jaccard, 1912), the intersection over the union:
U O = P r|Sr∩ Tr| P r|Sr∪ Tr| (4) UO can be converted to MO by the following (Heckemann et al., 2006):
M O= 2 × U O
1 + U O (5)
To complement the above agreement measures, we also computed false negative (F N) and false positive (F P ) errors. For these errors we characterize the source as a tentative set of labels for the target, and again assume that the target’s manual labels are correct. These error measures can range from zero to one; a value of zero is achieved for perfect overlap.
A false negative error for a given region is the measure of how much of that region is incorrectly labeled. It is computed as the volume of a target region outside the corresponding source region divided by the volume of the target region. As before, it is computed in voxels and summed over a set of multiple labeled regions each with index r:
F N = P r|Tr\Sr| P r|Tr| (6) where Tr\Sr indicates the set (theoretic complement) of elements in Tr but
not in Sr.
A false positive error for a given region is the measure of how much of the volume outside that region is incorrectly assigned that region’s label. It is
computed as the volume of a source region outside the corresponding target region divided by the volume of the source region:
F P = P r|Sr\Tr| P r|Sr| (7) 2.4.2 Surface overlap
We anticipated that imaging artifacts affecting cortical thickness could bias our overlap measures, because (for the same cortical area) thicker regions will have relatively higher volume overlap agreements than thinner regions due to lower surface-to-volume ratios. We tried to reduce this bias by computing overlap agreement only on the target surfaces of the brain images, not throughout the entire target volumes. Computing overlap agreement on the surfaces should also decrease the impact of segmentation biases, when manual labels extend into white matter, especially for the LPBA40 set, where white matter between sulcal structures were also assigned the structures’ labels. We used Freesurfer software (http://surfer.nmr.mgh.harvard.edu/, ver-sion 1.41) to construct cerebral cortical surfaces (Dale et al., 1999) for each of the original 80 full-head images, and converted the Freesurfer-generated surfaces to each brain’s native space with Freesurfer’s “mri_surf2vol” command. We then linearly registered each surface to MNI space using the initial affine transform from the original brain image to the MNI template (“Linear registration as initialization” section). Each resulting target surface was intersected with its corresponding target label volume Lt and warped
source label volume L[s→t];t. We compared these target surface labels with
the warped source surface labels using the same overlap agreement and error measures used for the volumes.
2.4.3 Volume similarity
The volume similarity coefficient, V S, is a measure of the similarity between source and target volumes. Although this measure does not reflect registration accuracy (source and target regions can be disjoint and still have equal volumes), it is a conventional measure included for retrospective evaluation of prior studies. It is equal to the differences between two volumes divided by their mean volume, here again summed over multiple regions:
V S = 2 P r(|Sr| − |Tr|) P r(|Sr| + |Tr|) (8)
2.4.4 Distance error
The above overlap and volume similarity measures do not explicitly account for boundary discrepancies between corresponding source and target regions. So we chose our final evaluation measure, DE is equal to the minimum distance, mindist, from each source region boundary point, SrBp, to the entire set of
points making up the target region boundary, TrB, averaged across P points:
DEr = 1 P P X p=1 mindist(SrBp, TrB) (9)
We extracted an approximation of the boundary points for each region of each of the 40 LPBA40 brains by applying a cityblock distance transform2
in Matlab and retaining only those voxels of neighboring regions that were within two voxels from the region. This resulted not in a complete shell about a region, but only the portion of the shell abutting other labeled regions. We repeated this procedure for each region of each of the warped LPBA40 source labels generated by each registration algorithm. We chose to construct borders from the warped labels rather than warp borders constructed from the original labels because we were concerned about interpolation artifacts.
We applied the same distance function used to construct the borders to also compute DE between source and target borders. We computed DE for each region as well as for the entire set of label boundaries as a whole.
2.5 Analysis
Testing for significant differences in the performance of the registration methods is not trivial because of non-independency of samples. For example, for the LPBA40 dataset, each of the 40 brain images was registered to the 39 others, resulting in 1,560 pairwise registrations. Each of the brains is represented 39 times as the registration source and 39 times as the target. Because each brain is reused multiple times, independence of observations cannot be assumed. We determined that for most of the registration methods, there is a high correlation between overlap results obtained for pairs that share one or more brains (see Supplementary section 6).
To get around this issue of non-independency of samples, we conducted two separate statistical tests, a permutation test and a one-way ANOVA test, on a small independent sample, and repeated these tests on multiple such samples. We also conducted an indifference-zone ranking on the entire set of results,
2 bwdist.m in the Image Processing toolbox uses the two-pass, sequential scanning
testing for practical rather than statistical significance (see below). For each test, the underlying measure is target overlap averaged across all regions.
2.5.1 Permutation tests
We performed permutation tests to determine if the means of a small set of independent overlap values obtained by each of the registration methods are the same, after (Menke and Martinez, 2004) and according to the following permutation algorithm:
1. Select a subset of P independent brain pairs
2. Select a pair of methods (two vectors of P total overlap values) 3. Subtract the two vectors and compute the mean difference D 4. Select a subset of the elements from one of the vectors
5. Swap this subset across the two vectors
6. Subtract the resulting vectors; compute the mean difference Dp
7. Repeat steps #4-6 N times
8. Count the number of times n where3 abs(D
p)≥abs(D)
9. Compute the exact p-value: p=n N
10. Repeat steps #1-9; compute the fraction of times where p≤0.05
The subset of brain pairs was selected so that each brain was used only once, corresponding to the “no dependence” condition in Supplementary section 6. There were 20, 9, 6, and 5 independent brain pairs for the LPBA40, IBSR18, CUMC12, and MGH10 datasets, respectively, as well as 20, 9, 6, and 5 corresponding average target overlap values obtained by each method. The number of permutations N for each subset of brain pairs was either the exhaustive set of all possible permutations (212=4,096 for CUMC12 and
210=1,024 for MGH10) or 1,000 permutations (LPBA40 and IBSR18) to keep
the duration of the tests under 24 hours. The number of p-values calculated was either 100,000 (CUMC12 and MGH10) or 10,000 (LPBA40 and IBSR18).
2.5.2 One-way ANOVA
We also performed a standard one-way ANOVA to test if the means of similar subsets of independent average target overlap values obtained by each of the registration methods are the same. We then subjected these results to a multiple comparison test using Bonferroni correction to determine which pairs of means are significantly different (disjoint 95% confidence intervals about the means, based on critical values from the t distribution). We repeated these
ANOVA and multiple comparison tests 20 times, each time randomly selecting independent samples from each of the datasets. These tests are not expected to be as accurate as the permutation tests because some of the overlap values have skew distributions and because the p-values are not exact.
2.5.3 Indifference-zone ranking
Our third evaluation between methods tested practical significance rather than statistical significance. For example, if a region is registered to another region of equal volume and results in an offset of a single voxel, this is not considered a significant misregistration, but offsets greater than this are considered significant. An evaluation measure of registration accuracy for a given region within a given brain pair is calculated for two different registration methods. If these two values are within delta of one another (referred to as an “indifference zone” when ranking (Bechhofer, 1954)), they are considered equal. The delta must correspond to a practical difference in registration. If we model a region as a cube, then a single-voxel offset along the normal to one of its faces would mean the voxels on that face of the cube reside outside of its target Ñ this is equal to one-sixth of its surface. We therefore set delta to one-sixth of a target region’s surface. For the IBSR18, CUMC12, and MGH10 datasets, we assumed the surface to be that of a cube (6×edge2−12×edge,
where edge = the edge length of a cube with the volume of the target region, in voxels). For the LPBA40 dataset, we set the surface to the number of voxels bordering adjacent regions, extracted as in the “Distance error” section. Our implementation of indifference-zone ranking compared the 15 different registration methods to each other in the following manner. For each region in a given label set and for each pair of registered brains we constructed a 15×15 matrix, where each row and each column corresponded to a registration method. Each element of the matrix was assigned the value −1, 0, or 1, for the cases when the evaluation measure for the method corresponding to its row was at least delta less than, within delta of, or at least delta greater than that of the method corresponding to its column. Then we calculated the mean of these {−1, 0, 1} values across all registration pairs for each region to construct Figs. 7, 8, 9, and 10 (the latter three in Supplementary section 3).
3 Results
Results for the initial run are in Supplementary section 1, for the trivial case, where each brain was registered to itself, are in Supplementary section 2, volume similarity results are in Supplementary section 4, and distance error results are in Supplementary section 5.
3.1 Overlap results
3.1.1 Whole-brain averages
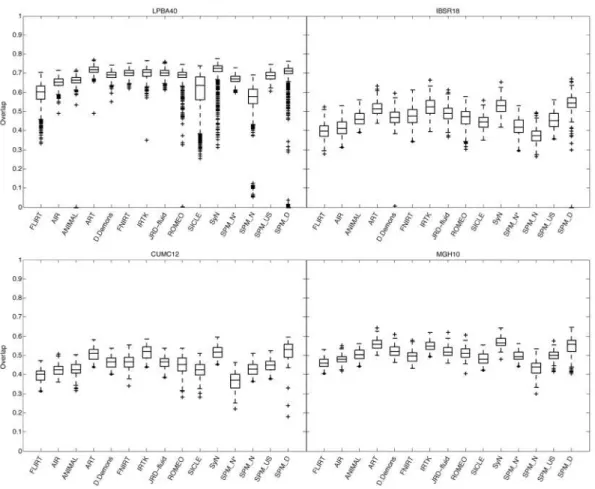
After the initial run and changes described in Supplementary section 1, out of 2,168 registrations per algorithm, the only cases where target overlap values were less than 25% were SPM’s DARTEL (79 cases; the majority were from one brain) Normalize (15 cases), ANIMAL (2 cases), and ROMEO (1 case) for the LPBA40 set and Diffeomorphic Demons (1 case) for the IBSR18 set. The target, union, and mean overlap values for volumes as well as surfaces (and the inverse of their false positive and false negative values), averaged over all regions, gave almost identical results when corrected for baseline discrepancies. Distributions of target overlap values are shown in Fig. 5. What is remarkable is that the relative performances of these methods appear to be robust not just to type of overlap measure, but also to subject population and labeling protocol, as evidenced by the similar pattern of performances of the methods across the label sets. This is particularly the case across IBSR18, CUMC12, and MGH10 sets. The pattern is more subtle in LPBA40 because that label set has fewer labeled regions that are larger and extend into white matter, and therefore results in higher and more similar absolute overlap values. We ran all 2,168 registrations again on whole-head images (before skull-stripping) using SPM’s Normalize, Unified Segmentation, and DARTEL, and the results were comparable or better with the skull-stripped images. The relative overlap performance of the SPM programs agrees with Yassa and Stark (Yassa and Stark, 2009): DARTEL performs better than Unified Segmentation which performs better than Normalize. Because the SPM DARTEL results were very similar for its original and pairwise implementations, we have included only the pairwise results; this is a fair comparison because the other methods do not include optimal average template construction.
3.1.2 Region-based results
The pattern of region-based overlap values is almost indistinguishable across the methods, discounting baseline differences (data not shown). In Fig. 6 we present volume and surface target overlap data for individual regions in their anatomical context (LPBA40 set). For the most part this figure suggests that the overlap values are approximately the same for volume and surface measures, corroborating whole-brain averages, but also exposes discrepancies at the level of regions (FLIRT and SICLE)4.
4 The worse surface overlaps of the cerebellum (for all the methods except ROMEO)
Fig. 5. Overlap by registration method. These box and whisker plots show the target overlap measures between deformed source and target label volumes averaged first across all of the regions in each label set (LPBA40, IBSR18, CUMC12, and MGH10) then across brain pairs. Each box represents values obtained by a registration method and has lines at the lower quartile, median, and upper quartile values; whiskers extend from each end of the box to the most extreme values within 1.5 times the interquartile range from the box. Outliers (+) have values beyond the ends of the whiskers. Target, union and mean overlap measures for volumes and surfaces (and the inverse of their false positive and false negative values) all produced results that are almost identical if corrected for baseline discrepancies. Similarities between relative performances of the different registration methods can even be seen here across the label sets. (SPM_N*=“SPM2-type” normalization, SPM_N=SPM’s Normalize, SPM_US=Unified Segmentation, SPM_D=DARTEL pairwise)
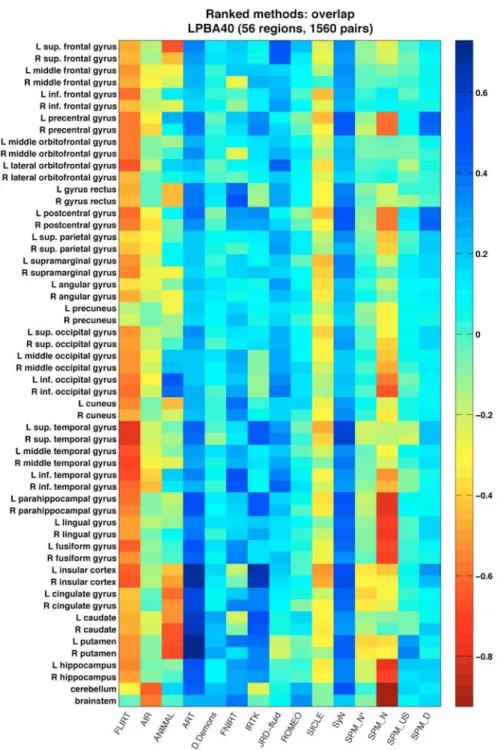
Most of the regions in the brain volume plots are hidden from view, so for a complete picture at the scale of individual regions, Figs. 7, 8, 9, and 10 present relative performances of the different methods for each region as color-coded tables for each of the four label sets (their construction is described in the “Indifference-zone ranking” section under “Materials and methods”; Figs. 8, 9, and 10 are in Supplementary section 3). If all of the methods had performed prior to computing the registration transforms, but the transforms were applied to the full label set (including the cerebellum).
equally well, the color tables would be a uniform color. However, some of the methods performed better than average, particularly against simple linear registration (FLIRT). By visual inspection, we can see that ART, IRTK, SyN, and SPM’s DARTEL have consistently high accuracy for the IBSR18, CUMC12, and MGH10 label sets relative to the other methods, and that in addition to ART, IRTK, and SyN, FNIRT and JRD-fluid also appear to have high relative accuracy for the LPBA40 set. As expected, we observed for all of the methods higher overlap values for larger sized regions, because of smaller surface-to-volume ratios (not shown).
3.2 Rankings
We ranked the registration methods in three independent ways: permutation tests, confidence intervals obtained from one-way ANOVA tests with Bonferroni correction, and indifference-zone ranking.
3.2.1 Permutation, ANOVA, and indifference-zone rankings
Table 3 presents the top three ranks of registration methods according to the percentage of permutation tests whose p-values were less than or equal to 0.05, and Table 4 according to relative target overlap scores. For both tables, members within ranks 1, 2, and 3 have means lying within one, two, and three standard deviations of the highest mean, respectively. Only ART and SyN are in the top rank for all four label sets and for all tests.
For the one-way ANOVA tests, rank 1 methods have means lying within the 95% confidence interval of the best method and rank 2 methods have confidence intervals that overlap the confidence interval of the best method. These rankings were in almost complete agreement among the target, union, and mean overlap values (and distance errors for the LPBA40 set). Because these results were very similar to the permutation test ranks, and because these tests are expected to be less accurate than the permutation tests, they are not included.
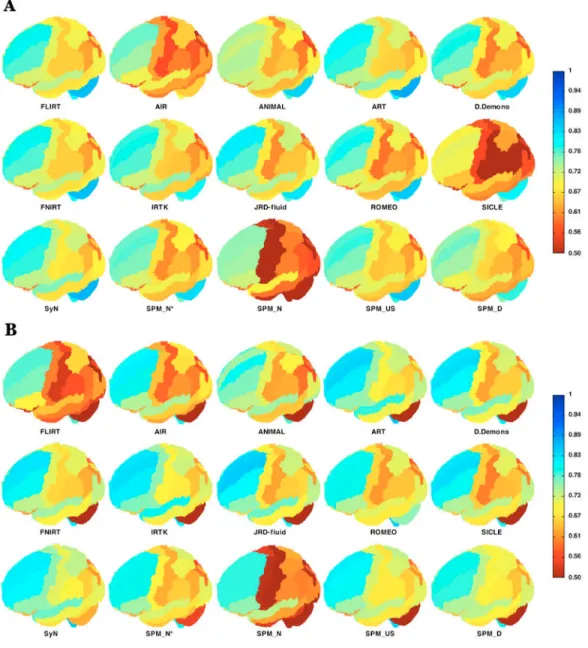
Fig. 6. Volume and surface overlap by registration method: LPBA40 regions. These brain images show the mean target overlap calculated across all 1,560 brain pairs for the (A) volume and (B) surface of each LPBA40 region, and depicts that mean as a color (blue indicates higher accuracy). The values for each registration method are projected on one of the LPBA40 brains, seen from the left, looking down from 30◦
, with the frontal pole facing left. (SPM_N*=“SPM2-type” Normalize, SPM_N=Normalize, SPM_US=Unified Segmentation, SPM_D=DARTEL pairwise)
Fig. 7. Indifference-zone ranking of the registration methods: LPBA40 overlaps. This matrix uses a color scale that reflects the relative performance of the registration methods (with blue indicating higher accuracy). Each colored rectangle represents the average score for a given method for a given region, averaged over 1,560 LPBA40 registrations. The scores are {−1, 0, 1} values indicating the pairwise performance of the method relative to each of the other methods (see text), according to target volume overlap (union and mean overlap results are almost identical). The colors (and color range) are not comparable to those of the other label sets (Figures 8, 9, and 10 in Supplementary section 3). (SPM_N*=“SPM2-type” Normalize, SPM_N=Normalize, SPM_US=Unified
LPBA40 µ(SD) IBSR18 µ(SD) CUMC12 µ (SD) MGH10 µ(SD)
rank
1
ART .82 (.35) SPM_D .83 (.27) SPM_D .76 (.24) SyN .77 (.37) SyN .60 (.38) SyN .72 (.51) SyN .74 (.51) ART .72 (.45) FNIRT .49 (.66) IRTK .67 (.53) IRTK .74 (.50) IRTK .61 (.51) JRD-fluid .49 (.66) ART .60 (.70) ART .60 (.70)
2 IRTK .43 (.63) JRD-fluid .30 (.82) SPM_D .27 (.23) D.Demons .13 (.82) D.Demons .27 (.69) SPM_US .11 (.83) JRD-fluid .24 (.66) ROMEO .06 (.63) 3
ROMEO .08 (.73) FNIRT .16 (.82) D.Demons .20 (.84) SPM_D .07 (.29) D.Demons .05 (.84) FNIRT .18 (.81) JRD-fluid .17 (.81)
Table 3
Permutation test ranking of the registration methods by label set. This table lists the methods that attained the top three ranks after conducting permutation tests between mean target overlaps (averaged across regions) for each pair of methods, then calculating the percentage of p-values less than or equal to 0.05 (of 100,000 tests for CUMC12 and MGH10 or of 10,000 tests for LPBA40 and IBSR18; µ=mean, SD=standard deviation). Methods within ranks 1, 2, and 3 have positive mean percentages lying within one, two, and three standard deviations of the highest mean, respectively. Values are not comparable across label sets (columns). (SPM_D=DARTEL pairwise)
LPBA40 µ(SD) IBSR18 µ(SD) CUMC12 µ (SD) MGH10 µ(SD)
rank
1
ART .35 (.07) SPM_D .50 (.19) SPM_D .47 (.17) SyN .39 (.06) SyN .34 (.24) SyN .40 (.12) IRTK .42 (.07) ART .36 (.07)
IRTK .35 (.15) SyN .41 (.06) ART .33 (.08) ART .35 (.05)
2 JRD-fluid .18 (.13)
3
JRD-fluid .20 (.08) FNIRT .06 (.11) JRD-fluid .07 (.07) IRTK .26 (.07) IRTK .18 (.15) D.Demons .01 (.08) FNIRT .07 (.09) SPM_D .25 (.28) FNIRT .17 (.08) ROMEO .01 (.28) D.Demons .05 (.05)
SPM_D .14 (.31)
Table 4
Indifference-zone ranking of the registration methods by label set. This table lists the methods that attained the top three ranks after averaging scores across all brain regions then across all registration pairs (µ=mean, SD=standard deviation). The scores reflect a pairwise comparison between methods, according to target overlap (see text). Methods within ranks 1, 2, and 3 have positive means lying within one, two, and three standard deviations of the highest mean, respectively. Values are not comparable across label sets (columns). (SPM_D=DARTEL pairwise)
4 Discussion
This study evaluates 15 registration algorithms (one linear, 14 nonlinear) based primarily on overlap measures of manually labeled anatomical regions. The scale and thoroughness are unprecedented (over 45,000 registrations, 80 manually labeled brain images representing 4 different labeling protocols, 8 different evaluation measures, and 3 independent analysis methods). We hope that the method of evaluation as well as the results will be useful to the neuroscience community. As they become available, additional materials and updated information will be made publicly available via the website http://www.mindboggle.info/papers/.
One of the most significant findings of this study is that the relative performances of the registration methods under comparison appear to be little affected by the choice of subject population, labeling protocol, and type of overlap measure. This is important because it suggests that the findings are generalizable to new healthy subject populations that are labeled or evaluated using different labeling protocols. Furthermore, we ranked the methods according to three completely independent analyses and derived three almost identical top rankings. However, in order to make recommendations, it is important to place these results in the context of the wider range of software packages available and the caveats inherent in registration in general and with respect to this study in particular, as we do below.
Although we were not able to see a pattern in the results that would allow us to rank algorithms by deformation model, similarity measure, or regularization method, there is a modest correlation between the number of degrees of freedom of the deformation and registration accuracy (0.29, or 0.45 if one excludes Diffeomorphic Demons), and between the number of degrees of freedom and year (0.55) (see Table 5). This finding corroborates Hellier’s evaluation: “The global measures used show that the quality of the registration is directly related to the transformation’s degrees of freedom” (Hellier et al., 2003). The four algorithms whose mean rank is less than two (SyN, ART, IRTK, and SPM’s DARTEL Toolbox) all have millions of degrees of freedom and all took at least 15 min per registration, and all but one (IRTK) were created in the last three years. Of the remaining 10 algorithms, seven have fewer than a million degrees of freedom, seven took less than 15 min, and six were created over three years ago.
Algorithm mean rank dof run time: minutes year SyN 1.00 28M 77 (15.1) 2008 ART 1.00 7M 20.1 (1.6) [Linux] 2005 IRTK 1.63 1.4M 120.8 (29.3) 1999 SPM5 DARTEL Toolbox 1.88 6.4M 71.8 (6.3) 2007 JRD-fluid 2.50 2M 17.1 (1.0) [Solaris] 2007 Diffeomorphic Demons 3.00 21M 8.7 (1.2) 2007 FNIRT 3.00 30K 29.1 (6.0) 2008 ROMEO 3.50 2M 7.5 (0.5) 2001 ANIMAL 69K 11.2 (0.4) 1994 SICLE 8K 33.5 (6.6) 1999 SPM5 Unified Segmentation 1K ≃1 2005 “SPM2-type” Normalize 1K ≃1 1999 SPM5 Normalize 1K ≃1 1999 AIR 168 6.7 (1.5) 1998 Table 5
Mean rank, degrees of freedom (dof), average run time, and year of publication for each algorithm. The 14 nonlinear deformation algorithms are ordered by mean rank (best at top), which was computed for each algorithm by averaging the target overlap ranks in Tables 3 and 4 (assigned by the permutation tests and indifference-zone rankings). The six algorithms at the bottom are of equal rank (4) since they were not in the top three ranks. For details on architecture and run time, see Appendix. Except for FNIRT and Diffeomorphic Demons, the dof and mean rank sequences roughly match.
4.1 Algorithms excluded from the study
We excluded semi-automated approaches that require even minimal manual intervention to reduce bias. A significant example is the forerunner of modern nonlinear registration methods, the original Talairach coordinate referencing system (Talairach and Szikla, 1967; Talairach and Tournoux, 1988), a piece-wise linear registration method that requires the identification of landmarks in a brain image. Although the Talairach system is well suited to labeling regions proximal to these landmarks (Grachev et al., 1998), it does not deal adequately with nonlinear morphological differences, especially when applied to the highly variable cortex (Grachev et al., 1999; Mandl et al., 2000; Roland et al., 1997; Xiong et al., 2000). Other examples that require landmarks include modern nonlinear algorithms such as Large Deformation Diffeomorphic Metric Mapping (personal communication with Michael Miller)(Beg et al., 2005) and Caret (http://brainmap.wustl.edu/, personal communication with David Van Essen and Donna Dierker)(Essen et al., 2001).
We also excluded some of the primary software programs for auto-matically labeling cortical anatomy: Freesurfer (http://surfer.nmr.mgh.
harvard.edu/)(Fischl et al., 2002, 2004), BrainVisa (http://brainvisa. info)(Cointepas et al., 2001), HAMMER (https://www.rad.upenn.edu/ sbia/software/index.html)(Shen and Davatzikos, 2002), and Mindboggle (http://www.mindboggle.info)(Klein and Hirsch, 2005; Klein et al., 2005), because their cortical labeling algorithms are tied to their own labeled brain atlas(es). We considered this problematic for three reasons: (1) we wanted to evaluate brain registration algorithms, not brain labeling algorithms or particular atlas-based approaches, (2) their atlas labels are inconsistent with the protocols used to label the brains in this study which would make evaluation difficult, and (3) creating new atlases for each of these requires considerable knowledge of the software. Freesurfer and BrainVisa differ from all of the other methods mentioned in this paper because they register surfaces rather than image volumes. Mindboggle differs from the others because it is based on combinatoric feature-matching and uses multiple independent atlases. And of the four, HAMMER is the only one that can transform an arbitrary set of labels when registering a source brain to a target brain. However, because we were not able to obtain reasonable results, we did not include it in the study. We also tested the PASHA algorithm (Cachier et al., 2003) with and without intensity normalization but because we obtained very inconsistent results across the datasets we decided not to include it in the study either. We also excluded other programs that do not allow one to apply transforms to separate image volumes.
4.2 Caveats
4.2.1 General caveats
There are numerous caveats that must be taken into account when evaluating registration data. The very question of correspondence between brains that we raised at the beginning of this paper is revisited at every stage: at the level of anatomy, image acquisition, image processing, registration (including similarity measure, transformation model, regularization method, etc.), evaluation measures, and analysis based on these measures. We will focus here on the most fundamental level of correspondence, at the primary level of anatomy, and on the effects of registration on anatomical correspondence. If we consider the scale of gross anatomy or patterns of functional activity or physiological data, then we may seek correspondences at the level of topographical, functional, or physiological boundaries without assuming one-to-one mapping of the points of the boundaries or the points within these regions of interest. In other words, another way of approaching this “correspondence problem,” and by extension the elusive common reference frame, is as a partial mapping between brains, independent of naming or
spatial conventions. The common reference frame is used simply as a reference of comparison or evaluation, not as a rigid framework for comprehensively annotating brain image data, as is often done.
If we cannot expect every brain to have a one-to-one mapping with every other brain, then if possible we need to compare similar brains. This can easily lead to the confound where image correspondence is mistaken for anatomic correspondence (Crum et al., 2003; Rogelj et al., 2002). Choosing a representative brain with which to establish correspondences with a given brain results in a Catch-22 where determining similarities itself entails determining correspondences between the brains. A few approaches around this dilemma include the use of an established average template or probabilistic atlas as an intermediary registration target (as is standardly done with SPM), construction of such a template from the subject group that includes the brain in question, and decision fusion strategies for combining multiple, tentative brain registrations or labels for a given target brain (Kittler et al., 1998; Rohlfing et al., 2004; Warfield et al., 2004; Klein et al., 2005). With all of these approaches, however, there still remains the distinct possibility that a given brain is not adequately represented by the majority of the set of brains to which it is being compared. Indeed, it is possible that substructures within a brain are most similar to a minority (or even a single, or no instance) of the set of brains, and would be overridden by the majority.
The evaluation measures and analysis methods used in this paper are predicated on the assumption that, at the macroscopic scale of topographic anatomical regions, there are correspondences across a majority of brains that can effectively guide registrations. It is very important to stress that we cannot make inferences about the accuracy of registrations within these macroscopic regions. Therefore our overlap evaluation measures not only ignore misregistration within a labeled region but are insensitive to folding in the deformations, which would impact studies such as deformation-based morphometry. More generally, our evaluation measures rely on information which is not directly included in the images, which is good for evaluating the registrations, but they do not inform us about the intrinsic properties of the spatial transformations. Example measures of the intrinsic properties of spatial transformations include inverse consistency error, transitivity error, and “mean harmonic energy” (where the Jacobian determinant of the transformation is averaged over the volume).
Another general caveat comes from recent evidence that nonlinear registration to average templates affects different brain regions in different ways that lead to relative distortions in volume that are difficult to predict (Allen et al., 2008). The evidence was based on varying the target template and registration method (AIR and piecewise linear). Although our study was not concerned with absolute volumetry, and nonlinear registrations were conducted from one
brain to another without the use of a template, we share the caution raised by their study.
4.2.2 Specific caveats
Caveats that are specfic to our study mirror the general caveats raised above: anatomical and labeling variability of the subject brains, quality of their images, the preprocessing steps the images were subjected to, the implementation of the registration algorithms, and our evaluation and analysis methods. With regard to the first three caveats, we made the assumption that each label set consists of a subject group of normal individuals whose brain images were acquired, preprocessed, and labeled in a consistent manner. Some of the co-authors have commented that the quality of the images in this study is worse than the quality of the images that they are used to applying their algorithms to. Some of the reasons for this are that the images for these label sets were acquired years ago, are incomplete (for example, only the CUMC12 set includes the cerebellum in registered images and labels), many are of low contrast, and all of them were linearly transformed to a template space that involved two trilinear interpolation steps (see below). All of the algorithms performed worst on the IBSR18 set, whose images were acquired from various sources and are of varying quality, flouting our assumption above regarding consistency.
Each brain image was labeled only once. Because there are no intra- or inter-labeler data for these images, we cannot know how accurately and consistently they were labeled, let alone have an idea of the degree of confidence for any of the label boundaries. We can only estimate based on labeling tests for two of the labeling protocols (Caviness et al., 1996; Shattuck et al., 2008). We therefore had to treat these label sets as “silver standards” whose hard label boundaries are considered correct.
Regarding pre-processing, the brain images of each label set were consistently preprocessed, and each registration method that performed preprocessing steps did so in a consistent manner across all images. However, these preprocessing steps may be suboptimal for particular registration methods. For example, aside from SPM’s algorithms, we did not test registration accuracy for whole-head images. Although most of the co-authors indicated that they believe their registration methods would perform better on properly skull-stripped images than on whole-head images5, we are not aware of any
published study that has made this comparison. Likewise, we are aware
5 FNIRT is an exception: In the beta version used in this study, zero values are
interpreted as missing data; FNIRT will not use the information for the edge of the cortex in the registration with this setting, which may result in misregistration of the surface of the brain.
of no comparisons between the registration of interpolated versus non-interpolated (bias-field corrected and uncorrected, intensity normalized and non-normalized, etc.) images. All of the images in this study were linearly interpolated twice, once to linearly register each brain to a template, and a second time to linearly register each source brain to a target brain in the template space, prior to nonlinear registration. We did this to be consistent, because all of the registration methods we compared do not accept an affine transform to initialize registration. The first author has observed much more accurate nonlinear registrations with ART (on a separate set of brain images) when using nearest-neighbor (or no) interpolation on a preliminary linear registration step, most noticeably in occipital-parietal boundaries. This suggests that, at the very least, ART would perform much better than this study suggests. More work will need to be conducted to see how consistent the improvements are and which algorithms are affected most by interpolation. Regarding the registration methods themselves, each one has a similarity measure, transformation model, regularization method, and optimization strategy. Unfortunately, we could only evaluate each algorithm in its entirety. A superior transformation model coupled with an unsuitable similarity measure, for example, would most likely lead to suboptimal results. By extension, a poor selection of parameter settings will lead to poor registrations. We could only evaluate each algorithm using the software parameters that were recommended by their authors. Perhaps the most crucial assumption of our study is that these parameter settings for each method were appropriate for all of our brain images. We fully expect that each registration algorithm could perform better given the opportunity to experiment with these settings. This is one aspect of our study that sets it apart from comparison studies such as Hellier’s (Hellier et al., 2001a, 2002, 2003), where the authors of the software packages were allowed to tweak and run their own programs on the full test set of brain images. The commands that were run for this study were recommended by the authors of their respective software programs after having seen only one or two of the 80 images from one of the four datasets (FNIRT, IRTK, SICLE, SyN, and SPM’s DARTEL Toolbox6), or no images
at all.
When reslicing the source label volumes, we used nearest-neighbor interpolation to preserve label values. An alternative approach is recommended where the source label volume is first split into N binary volumes, with one label per volume (Collins, personal communication). Each volume is then
6 Updated versions of these software packages were used after the authors of the
packages saw an image or two, or their recommended commands or parameter files were altered to set the number of iterations or control point spacing to reduce computation time, or the authors needed to determine if intensity correction was warranted (see Supplementary section 1).
resampled using the nonlinear transformation with a tricubic or truncated sync kernel instead of nearest-neighbor interpolation. The resulting N temporary volumes are finally combined into a single volume, where each voxel label is set to the label of the structure that has the highest value. This presumably gives more consistent behavior at structure edges, especially in areas where the deformation changes local volumes or where more than three structures meet. Others have implemented variants of this approach (Crum et al., 2004; Shattuck et al., 2008). We were unable to follow this recommendation due to computational and storage constraints, and were advised that the results would be only marginally different.
4.3 Recommendations
Bearing in mind the caveats mentioned above, particularly those regarding parameter settings, the first author makes the following recommendations based on the results of this study. All of the software packages under comparison are freely available via the Internet or from the authors themselves (except for JRD-fluid, run on LONI’s servers) and all but one (SICLE) are easy to install. They vary in the extent of their documentation, primarily because the pre-release software packages are new and very much under active development.
The highest-ranking registration methods were SyN, ART, IRTK, and SPM’s DARTEL Toolbox (see Tables 3, 4, and 5). SyN and ART gave consistently high-ranking results and were the only methods that attained top rank for all tests and for all label sets. IRTK and SPM’s DARTEL were competitive with these two methods.
All four of these methods are available on Unix-type systems, and all but ART are available for the Windows operating system. Of the four, only SPM requires a commercial software package (Matlab) and has a graphical user interface (which was not used in the study). If flexibility is desired, SyN provides the most options and the closest documentation to a manual for command-line parameters. If resources are an issue, note that SyN requires at least 1 GB RAM and 87 MB storage per x, y, z set of transform files (followed by ART at 67 MB for our data). If time is a constraint, ART is the fastest of the four. If consistency is the top priority, ART had the fewest outliers and among the tightest distributions of the four methods. If interested in particular regions, please refer to Figs. 7, 8, 9, and 10 (the latter three are in Supplementary section 3) to determine which of the 15 methods had the highest relative accuracy for those regions across the label sets.