HAL Id: cea-02438725
https://hal-cea.archives-ouvertes.fr/cea-02438725
Submitted on 14 Jan 2020
HAL is a multi-disciplinary open access
archive for the deposit and dissemination of sci-entific research documents, whether they are pub-lished or not. The documents may come from teaching and research institutions in France or abroad, or from public or private research centers.
L’archive ouverte pluridisciplinaire HAL, est destinée au dépôt et à la diffusion de documents scientifiques de niveau recherche, publiés ou non, émanant des établissements d’enseignement et de recherche français ou étrangers, des laboratoires publics ou privés.
Microstructure evolution in ion-irradiated oxidized
Zircaloy-4 studied with synchrotron radiation
micro-diffraction and transmission electron microscopy
K. Colas-Leroux, R. Verlet, M. Tupin, Z. Cai, K. Wolski, M. Jublot, P. Bossis
To cite this version:
K. Colas-Leroux, R. Verlet, M. Tupin, Z. Cai, K. Wolski, et al.. Microstructure evolution in ion-irradiated oxidized Zircaloy-4 studied with synchrotron radiation micro-diffraction and transmission electron microscopy. 18th International Symposium on Zirconium in the Nuclear Industry, May 2016, Hilton Head, United States. �cea-02438725�
1
18th International Symposium on Zirconium in the Nuclear Industry
Microstructure evolution in ion-irradiated oxidized Zircaloy-4 studied with
synchrotron radiation micro-diffraction and transmission electron microscopy
Kimberly Colas
1, Romain Verlet
1, Marc Tupin
1, Zhonghou Cai
2, Krzysztof Wolski
3, Michael
Jublot
1, Philippe Bossis
41
CEA-DEN, Service d’Etudes des Matériaux Irradiés, CEA-Saclay, 91191 Gif-sur-Yvette
Cedex, France.
2
Advanced Photon Source, Argonne National Laboratory, Argonne, IL 60439, United States of
America.
3
Centre SMS, Ecole des Mines de Saint Etienne, 158, cours Fauriel 42023 Saint Etienne Cedex,
France.
4
CEA-DEN, Département des Matériaux pour le Nucléaire, CEA-Saclay, 91191 Gif-sur-Yvette
Cedex, France.
Abstract
The corrosion process (oxidation and hydriding) of the zirconium alloy cladding is one of the limiting factors on the fuel rod lifetime, in particular for the Zircaloy-4 alloy. The corrosion rate of this alloy shows indeed a great acceleration at high burn-up in Light Water Reactors. Understanding the
corrosion behavior under irradiation for this alloy is an important technological issue for the safety and efficiency of LWRs. In particular, understanding the effect of irradiation on the metal and the oxide layers is a key parameter in the study of corrosion behavior of zirconium alloys.
Zircaloy-4 samples have undergone helium and proton ion-irradiation up to 0.3 dpa forming a uniform defect distribution up to 1 µm deep. Both as-received and pre-corroded samples have been irradiated in order to compare the effect of metal irradiation to that of oxide layer irradiation. After irradiation, samples have been corroded in order to study the impact of irradiation defects in the metal and in pre-existing oxide layers on the formation of new oxide layers. Synchrotron X-ray micro-diffraction and micro-fluorescence are used to follow the evolution of oxide crystallographic phases, texture and stoichiometry both in the metal and in the oxide in cross-section. In particular, the tetragonal oxide phase fraction, which has been known to have an important role on corrosion behavior, is mapped in both unirradiated and irradiated metal at the sub-micron scale and appears to be significantly affected by irradiation. These observations, complemented with electron microscopy analyses on samples in carefully chosen areas of interest are combined in order to fully characterize changes due to irradiation in metal and oxide phases of both alloys.
2
Introduction
Zirconium alloys are extensively used in the nuclear industry as nuclear fuel cladding and structural fuel assembly components. However, the corrosion process (oxidation and hydriding) of the zirconium alloy cladding is one of the limiting factors on the fuel rod lifetime, in particular for the Zircaloy-4 alloy. The corrosion rate of this material shows indeed a great acceleration at high burn-up in Light Water Reactors [1].Many assumptions are proposed in the literature to explain this behaviour such as hydriding effect [2-4], and irradiation [5, 6]. However neutron irradiation induces changes in all the components of the reactive system, metal, oxide and chemical environment and studying neutron irradiation effect on the corrosion kinetics is very expensive. To avoid working with radioactive material, it is possible to use ions to simulate these neutron irradiation damages. This study is focused on irradiation's effect on the corrosion of Zircaloy-4.
The Zircaloy-4 alloy is zirconium based with some small amount of tin in solid solution and second phase particles (Zr(Fe,Cr)2) [7]. These precipitates tend to amorphize under neutron irradiation and
undergo iron depletion [8]. The iron atoms from the precipitate actually dissolve in the metallic matrix [9]. Ion irradiation can be used to create dislocation loops or completely amorphize the second phase particles and/or dissolve iron in the matrix (by implanting this element). These transformations likely have an impact on the corrosion kinetics. The various effects of irradiation on the corrosion behaviour need thus to be separated in order to understand the relevance of each contribution to the acceleration of corrosion. In this study, the effect of irradiation of the metal matrix and of the oxide layer on the corrosion kinetics are investigated. The amorphization and iron-dissolution aspects are not studied. The rate limiting step being the diffusion of oxygen in the oxide layer, it is important to investigate the oxide film features (in particular the tetragonal phase proportion and oxide texture) as a function of the microstructural change in the metal in order to explain why the different materials (irradiated or not) have different corrosion rates. Two main microstructural characterization techniques have been used in this study: conventional transmission electron microscopy and synchrotron micro X-ray diffraction and fluorescence.
In particular, previous synchrotron XRD experiments performed on corroded pre-hydrided Zircaloy-4 have yielded information on the acceleration of corrosion due to hydride accumulation [10]. Figure 1 and Figure 2 show 3D maps obtained using micro-diffraction in scanning the sample from the metal to the resin. The map obtained on the pre-hydrided sample revealed the presence of a Zr3O phase
between the oxide layer and the massive hydride which had not been observed on the reference material. From these observations, it was evident that the corrosion mechanism is clearly different between hydride and Zircaloy-4. Moreover, Tupin et al. showed that the tetragonal content on the oxide formed on the pre-hydrided Zircaloy-4 is significantly lower than that estimated on the free hydrogen material, as evidenced on Figure 3.
3
Figure 1Three dimensional map of µ-XRD analyses performed on a reference sample corroded in light primary water at 360°C during 171 days (oxide thickness of 3.6 µm) [10].
Figure 2 Three dimensional map of µ-XRD analyses performed on a pre-hydrided sample corroded in light primary water at 360°C (oxide thickness of 7.4 µm) [10].
Figure 3 Approximate evolution of the tetragonal phase percentage (t-ZrO2) in the oxide from the metal/oxide interface to the surface for hydrided (square) and reference (circle) material (the percentage is estimated without texture
correction)[11].
metal oxide
intense (002) quadratic peak at the metal/oxide interface
Progressive disappearance of a-Zr and hydrides (δ and ε) (111), (020) and (002)
monoclinic peaks
(101) quadratic diffraction peak localised
at the internal interface
(111) δ-ZrH1.66
diffraction peak beneath the interface Ondulation due to the rugosity
of the M/O interface I (a.u)
metal oxide
intense (002) quadratic peak at the metal/oxide interface
Progressive disappearance of a-Zr and hydrides (δ and ε) (111), (020) and (002)
monoclinic peaks
(101) quadratic diffraction peak localised
at the internal interface
(111) δ-ZrH1.66
diffraction peak beneath the interface Ondulation due to the rugosity
of the M/O interface I (a.u) 0 5 10 15 20 0 0,5 1 1,5 2 2,5 3 3,5
% t-ZrO2 (Zy4 reference_liss)
% t-ZrO2 (hydrided material_liss)
%
t
-Z
rO
2
distance from the metal/oxide interface (µm)
external interface metal/oxide
4 It is clear from previous synchrotron XRD studies that the variations in oxide structure occur at the sub-micron scale, and the use of micro-diffraction provides unique information not obtainable by other means. The objective of the micro-diffraction studies is to obtain detailed information in order to discern what microstructural changes in the metal and in the oxide due to irradiation play a role in the corrosion resistance and allow us to improve models of oxide growth that take into account the irradiation effect of the matrix on the corrosion rate.
Experimental Procedures
Material and initial sample preparation
The Zircaloy-4 samples provided by AREVA CEZUS were initially in the form of 400 µm-thick recrystallized sheets. The composition of the Zircaloy-4 samples used in this study is reported in Table 1 [12].
Prior to corrosion and irradiation experiments, the samples were cut into corrosion coupons and polished to a mirror finish with a final polishing step of 0.25 µm diamond paste.
Table 1 Composition of Zircaloy-4 alloy used in this study [12].
(%wt) Zr Cr Fe O Sn
Zircaloy-4 Bal. 0.107 0.22 0.126 1.46
Irradiation experiments
The irradiation experiments were conducted at the JANNuS facility (France). Two types of ion-irradiation experiments were performed: the first consisted in irradiated the metal matrix of Zircaloy-4 samples prior to corrosion. The second consisted in irradiated oxide layers already formed on
Zircaloy-4 samples.
The metal matrix irradiation was done with 300 keV protons to a fluence of 1018 ions/cm² at a
temperature of 350°C. The dose received at the peak damage location is 4.5 dpa as calculated by the SRIM software. The irradiation parameters were chosen in order to have a constant damage level through the pre-transition oxide layer. The details of the calculated damage profile are discussed in the Results section.
The oxide layer irradiation was done with 1.3 MeV helium ions to a fluence of 1017 ions/cm2 at a
temperature around 50°C. The damage profile across the oxide layer is quite uniform and the average dose is approximately 0.35 dpa which is below the damage level for the zirconium oxide phase transformation [13].
Corrosion experiments
Corrosion experiments were done in water in a 0.5 L autoclave at a temperature of 360°C and a pressure of 187 bars. This temperature, slightly higher than the one encountered in PWR, was chosen to accelerate corrosion and obtain data in a reasonable amount of time. In order to reproduce the chemistry of the primary water of a PWR, 1000 wt.ppm of boron and 2 wt.ppm of lithium were added. Samples mass was measured before and after the experiment with a precision scale and the oxide thickness was calculated from the weight gain. The corrosion kinetic curves are plotted using data from these measurements.
5
Table 2 List of samples examined in this study
Irradiation conditions Corrosion conditions
Sample reference Ion Energy of ion (keV) Fluence (ions/cm²) Irradiation temp.(°C) Dose (dpa) Time (days) Temp. (°C) Oxide thickness (µm) Experiment order Metal matrix irradiation Zircaloy-4 unirradiated pre-transition - - - - - XRD: 50 TEM: 30 360 XRD: 1.4 TEM: 1.2 1. Irradiation 2. Corrosion Zircaloy-4 metal matrix irradiation pre-transition H+ 300 1018 350 4.5 14 360 1.5 1. Irradiation 2. Corrosion Zircaloy-4 unirradiated post-transition - - - 180 360 3.5 1. Irradiation 2. Corrosion Zircaloy-4 metal matrix irradiation post-transition H+ 300 1018 350 4.5 150 360 4.0 1. Irradiation 2. Corrosion Oxide irradiation Zircaloy-4 irradiated oxide He 1300 1017 50 0.35 50 360 1.4 1. Corrosion 2. Irradiation Zircaloy-4 irradiated oxide re-oxidized He 1300 1017 50 0.35 50 360 1.5 1. Corrosion 2. Irradiation 3. Corrosion for 1 day
Transmission Electron Microscopy
Conventional transmission electron microscopy (TEM) has been used in this study to characterize the damage created by irradiation and the oxide microstructure. The TEM samples were prepared using a FEI Helio 650 NanoLab Focused-Ion Beam (FIB). All TEM examination were performed on a 300 keV G2 FEI Tecnai instrument.
Synchrotron X-ray diffraction
The synchrotron X-ray micro-diffraction and micro-fluorescence experiments were conducted at the 2-ID-D beamline of the Advanced Photon Source (APS) at Argonne National Laboratory. A schematic illustrating the experimental set-up is presented in Figure 4. The samples are prepared in cross-section and the X-ray beam is focused to a 0.2 µm diameter spot. With the incident angle, the resulting beam size on the sample surface is 0.2 x 2 µm approximately. The incoming X-ray energy is 10.1 keV thus the overall volume probed with X-rays is 10-15 µm inside the sample. At each step, a diffraction pattern consisting in half of the Debye rings is recorded. A fluorescence detector also records the fluorescence signal from several elements at each point. The oxide layer is probed in steps of 0.15 µm from the outer surface to the metal.
6 The diffraction rings are integrated over their entire angular range (half the Debye ring) using the Fit2D software. The diffraction patterns obtained are then analyzed individually using the PeakFit software. The peaks are fitted using the Pearson VII peak shape which corresponds well to synchrotron XRD peaks (combination of Gaussian and Lorentzian peak shapes). From this fit, the peak position, amplitude, integrated intensity and full-width at half-maximum (FWHM) are extracted for each peak.
Figure 4 Schematic of the experimental set-up for the synchrotron micro-diffraction and micro-fluorescence experiments conducted at the 2-ID-D beamline at the APS (similar set-up as in [14]).
Results
Impact of metal irradiation on corrosion kinetics and oxide microstructure – Pre-transition samples The first part of the study on the effect of irradiation on the corrosion kinetics and oxide
microstructure consisted in performing proton irradiation experiments on Zircaloy-4 samples with 300 keV protons at a fluence of 1018 ions/cm². The damage created by ion-irradiation was examined using
TEM and representative micrographs of the unirradiated sample and the irradiated sample are
presented in Figure 5. By comparing both figures for the unirradiated samples (Figure 5a.) and for the irradiated sample close to the region of peak damage (Figure 5b.), a strong increase in the number of dislocation loops created by irradiation can be evidenced. The dislocation loops created are <a>-type loops. The exact number has not been quantified, however, from similar data available in the literature, it can be expected to be around 1022/cm² for the maximum dose of 4.6 dpa [15, 16]. No <c>-loops
were observed in this sample. Other examinations, not presented here for the sake of conciseness, have been performed close to the metal samples surface (~100 nm deep, local damage of 0.5 dpa).
Dislocation loops are also present close to the surface and their number density appears to be similar to the one observed in the peak damage region as illustrated in Figure 5. Intermetallic precipitates have been characterized using Select-Area Diffraction (SAD) and remain in the crystalline state even after irradiation at 4.6 dpa. Thus no amorphization was created by irradiation in the proton irradiation conditions chosen for this experiment.
Fluorescence detector
X-ray beam
Epoxy
Oxide
Metal
CCD Camera
7
Figure 5 TEM bright field image of: a. metal matrix and of an crystalline intermetallic precipitate Zr(Fe, Cr)2 for the
unirradiated sample ; b. metal matric irradiated with 300 keV protons up to 4.6 dpa.
The corrosion kinetic curves as measured for the unirradiated and the metal irradiated sample are presented, along with the expected damage profile as calculated by SRIM, in Figure 6. From these curves, it can be seen that the corrosion kinetics are accelerated by irradiation. In particular, there is a 1.5 increase in corrosion rate for the irradiated sample in the pre-transition stage. The kinetic transition occurs at an oxide thickness of about 1.7 µm for both samples although this corrosion occurs much sooner for the irradiated sample (~55 days) compared to the unirradiated sample (~130 days). The post-transition corrosion rate is slightly higher for the irradiated sample until the end of the irradiated region. Once the entire irradiated region has been corroded, the corrosion rate seems be close to that of the unirradiated sample.
Figure 6a. Damage profile in the metal matrix of a Zircaloy-4 sample irradiated with 300 keV protons at a fluence of 1018
cm-2 at 350°C ; b. Corrosion kinetics of Zircaloy-4 at 350°C for the unirradiated and the irradiated samples.
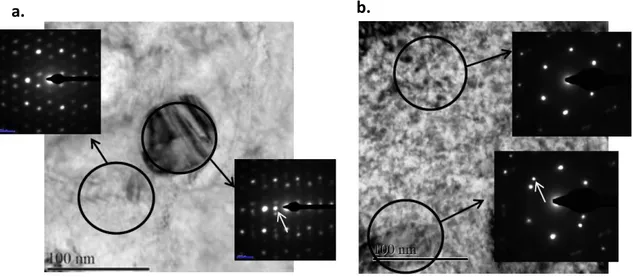
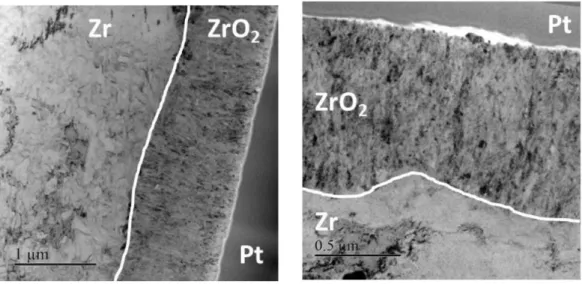
After corrosion in autoclave, the oxide layers for the unirradiated and the irradiated sample have been observed by TEM. Micrographs obtained on the unirradiated sample after 30 days of corrosion are presented in Figure 7, the ones obtained on the irradiated sample after 14 days of corrosion are presented in Figure 8. The first observation that can be made when comparing the two samples is that the oxide grown on the irradiated matrix is heavily cracked. In addition, the oxide thickness is approximately 1.2 µm after 30 days of oxidation for the unirradiated sample while that of the
a.
b.
Irradiated
Unirradiated
time (days)
8 unirradiated sample is approximately 1.5 µm after 14 days of oxidation. This confirms the accelerated corrosion kinetics of the irradiated sample as presented in Figure 6b. Figure 9 presents higher
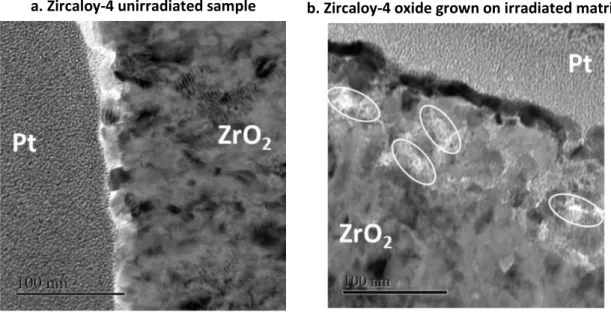
magnification micrographs of the sub-surface of the oxide layers for the unirradiated and the irradiated samples. The oxide grown on the irradiated matrix exhibits features that could be identified as nano-sized pores up to 100 nm below the outer oxide surface as seen on Figure 9b. contrarily to the unirradiated oxide which does not exhibit any nano-pores. This observed oxide microstructure of the irradiated sample suggests either a less passive oxide layer or diffusion short-circuits through the oxide thickness which could play a role in terms of acceleration of the corrosion kinetics.
Figure 7 TEM images of the oxide microstructure formed after 30 days of corrosion of an unirradiated metal sample of Zircaloy-4.
Figure 8 TEM images of the oxide microstructure formed after 14 days of corrosion at 350°C of an irradiated sample of Zircaloy-4 (irradiation conditions: 300 keV protons, fluence of 1018 cm-2 at 360°C).
9
Figure 9 Higher magnification TEM image of : a. oxide formed on an unirradiated Zircaloy-4 sample after 30 days of corrosion at 350°C ; b. oxide formed on an irradiated sample after 14 days of corrosion at 350°C (irradiation conditions: 300 keV protons, fluence of 1018 cm-2 at 350°C).
In order to further study the impact of metal irradiation on the oxide layer microstructure, a careful analysis of micro-diffraction and micro-fluorescence data has been undertaken. Some of the main findings from this study are presented in the following paragraph.
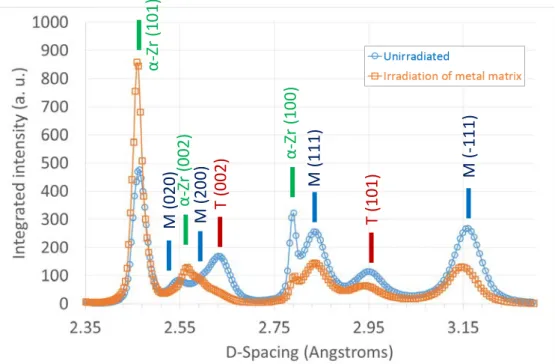
An example of typical diffraction patterns obtained for the unirradiated sample and for the irradiated sample is presented in Figure 10. The diffraction patterns are taken close to the respective oxide-metal interface. The diffraction patterns presented here are a selection of the larger d-spacing range studied with our sample-detector geometry. As seen in Figure 10, the signal to noise ratio is very good and allows the identification of the various oxide peaks with good confidence. Two main oxide phases are identified: the monoclinic phase (noted M) which is the main expected phase given our conditions of temperature and pressure, and the tetragonal phase (noted T) which is known to appear in oxides grown on zirconium alloys. In addition, peaks associated with the alpha zirconium matrix are also present and noted α-Zr.
Two main monoclinic peaks, M(111) and M(-111), and one tetragonal peak, T(101), are more closely studied in the following XRD analyses. These peaks are chosen because they are the main peaks in the Garvie-Nicholson tetragonal phase fraction formula [17] and that the tetragonal phase is sufficiently separated from the monoclinic phase to be fitted with good confidence. The Garvie-Nicholson formula is presented in Equation 1.:
𝑡𝑡 − % =
𝐼𝐼�𝑇𝑇(101)�+𝐼𝐼�𝑀𝑀(111)�+𝐼𝐼(𝑀𝑀(1�11))𝐼𝐼(𝑇𝑇(101)) (1)where I(X) represents the integrated intensity of the chosen diffraction peak and t-% represents the tetragonal phase fraction. With the experimental geometry used in this study, half of the Debye rings are present on the CCD diffraction camera. Due to the 180° symmetry of the oxide and metal crystal lattices, all the texture information is present in half a Debye ring. Thus, the effect of texture on the actual tetragonal phase fraction if any, is small. This would also confirm previous work from the literature suggesting the effect is small using this micro-diffraction technique and cross-sectional geometry [18].
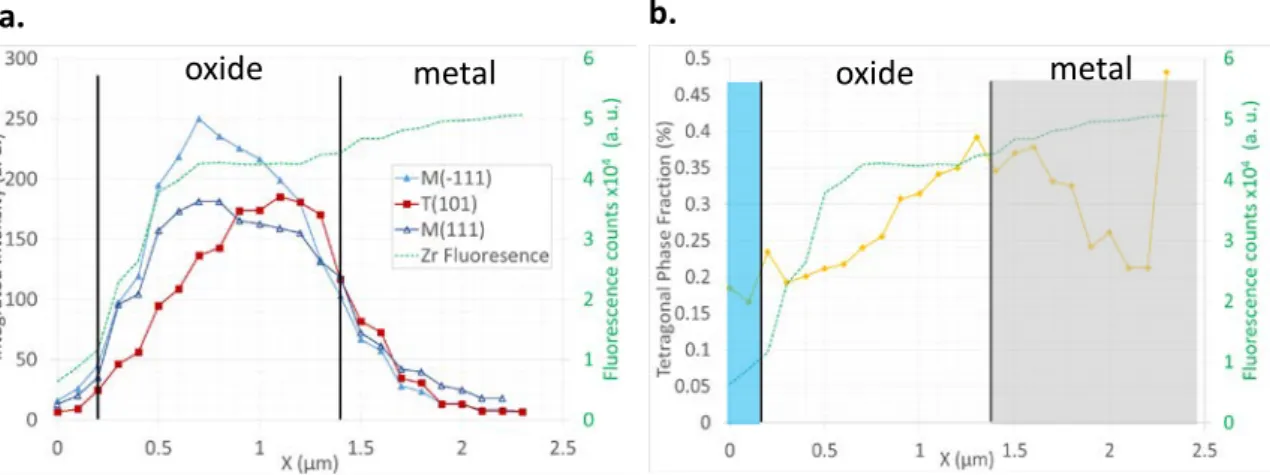
10 Figure 11 presents the integrated intensity (area under the peak) for the two monoclinic peaks and the tetragonal peaks for the unirradiated sample. From the evolution of the peak intensity, the location of the oxide layer can be identified. The evolution of the zirconium fluorescence data is also plotted in this figure. The fluorescence data corresponds well to the oxide intensities which allows us to measure a total oxide thickness of 1.4 µm which is expected after 50 day of corrosion. Using the Garvie-Nicholson formula presented in Equation (1), the evolution of the tetragonal phase fraction can be followed across the oxide layer thickness as illustrated in Figure 11b. From this figure, it can be seen that the tetragonal phase fraction increase across the oxide layer and is maximum at the oxide-metal interface which is coherent with previous literature results [14, 18, 19]. The average tetragonal phase fraction for this oxide layer is approximately 27 %. Literature results studying Zircaloy-4 oxide layers range from 10 to 60% [19-23]. While the value found for the oxide layer here is within the expected range, it is relatively high. This could be due to the fact that the studied layer is quite thin, since thinner oxide layers are known to present higher tetragonal phase fractions [19].
Figure 12a. presents the integrated intensity (area under the peak) for the two monoclinic peaks and the tetragonal peaks for the oxide grown on the irradiated matrix. The variations of the tetragonal phase across the oxide layer are more uneven than for the unirradiated sample. This is true both for the T(101) peak intensity and for the tetragonal phase fraction (Figure 12b.). The average tetragonal phase fraction for this oxide layer is approximately 18 %. This value is much lower than the one obtained for the unirradiated sample. The main conclusion from the peak intensity and tetragonal phase fraction analysis is that metal irradiation seems to lower the tetragonal phase fraction. Several scans have been analyzed both on the unirradiated and the irradiated sample allowing a large sampling of the oxide and this result has been confirmed for all observed locations.
Figure 10 X-Ray diffraction pattern close to the oxide metal interface for the unirradiated sample and for the oxide grown on an irradiated matrix (irradiation conditions: 300 keV protons, fluence of 1018 cm-2 at 360°C).
M (
-1
11)
M
(111)
M
(200)
M
(020)
T (
002)
T (
101)
α-Zr (
10
0)
α-Zr (
10
1)
α-Zr (
00
2)
11
Figure 11 a. Integrated intensity of the monoclinic (111), (1�11) and the tetragonal (101) oxide peaks; b. tetragonal phase fraction through the thickness of an oxide formed on an unirradiated Zircaloy-4 sample after 30 days of corrosion at 360°C.
Figure 12 a. Integrated intensity of the monoclinic (111), (1�11) and the tetragonal (101) oxide peaks; b. tetragonal phase fraction through the thickness of an oxide formed on an irradiated Zircaloy-4 sample after 14 days of corrosion at 360°C (irradiation conditions: 300 keV protons, fluence of 1018 cm-2 at 350°C).
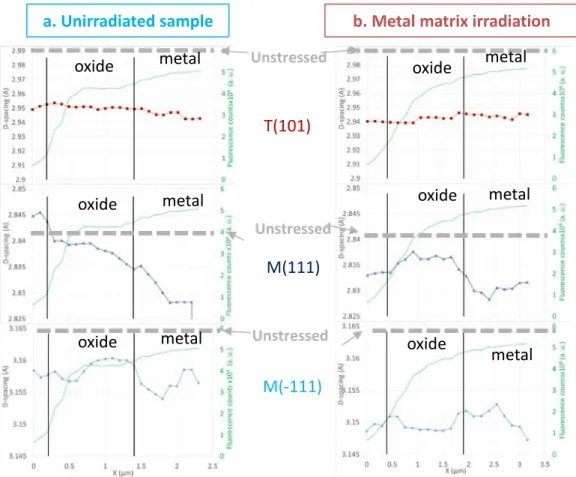
The position of the three main oxide peaks studied has also been investigated in order to observe potential different stress state and stoichiometry effects. Figure 13a. and b. show the d-spacing of the M(111), the M(-111) and the T(101) across the oxide thickness for the unirradiated and the oxide grown on the irradiated matrix respectively. The values for the unstressed peak positions are also indicated for each peak, these values are taken from oxide powder analyses [24]. As can be seen when comparing to the unstressed values from an oxide powder, both the monoclinic and the tetragonal phase are compressed in the oxide layer. This is expected due to the higher specific volume of the oxide phase compared to the metal phase. For the unirradiated sample the M(111) seems to be most compressed at the o/m interface. This is not observed in the irradiated sample. The monoclinic phase seems to be more compressed (lower d-spacing) or have a slightly different stoichiometry in the irradiated sample compared to the unirradiated sample.
oxide
metal
oxide
metal
a.
b.
oxide
metal
oxide
metal
12
Figure 13 Monoclinic (111), (1�11) and tetragonal (101) oxide peaks d-spacing through the oxide thickness: a. formed on an unirradiated Zircaloy-4 sample after 30 days of corrosion at 350°C (unirradiated sample); b. formed on an irradiated Zircaloy-4 sample after 14 days of corrosion at 350°C (irradiation conditions: 300 keV protons, fluence of 1018 cm-2 at
350°C).
Finally, in order to investigate the evolution of texture of the oxide phase between the unirradiated and the irradiated sample, the ratio of the intensity of each monoclinic peak is plotted against the
maximum intensity of the investigated monoclinic peak for each sample and presented in Figure 14. Due to multiplicity effects in particular, even for a random powder, the M(-111) will be the most intense peak, the M(111) will have an intensity at 65% of the M(-111) and so on [24, 25]. This
analysis has been done for the monoclinic oxide peak for the unirradiated sample and for the irradiated sample is presented in two locations: the center of the oxide layer (Figure 14a.) and the oxide/metal interface (Figure 14b.). At the center of the oxide layer, the texture of the monoclinic phase seems to be close to that of a random powder for the unirradiated sample but also for the irradiated sample although to a smaller extent. It is important to note that the planes that are being probed by this analysis are those that form the side of the monoclinic oxide columns as illustrated by the schematic drawing in Figure 14. At the center of the oxide layer (Figure 14a.), the irradiated sample has a different texture than the unirradiated one with a more intense M(111) peak in particular. At the oxide/metal interface (Figure 14b.), we see that the unirradiated sample has a different texture than that of a random powder, this could be due to the influence of the underlying metal grains. The irradiated sample is also textured although slightly differently than the reference layer. Overall it can be concluded that irradiation induces variation in the oxide monoclinic texture at the oxide/metal interface and across the oxide layer.
a. Unirradiated sample
b. Metal matrix irradiation
M(111)
M(-111)
T(101)
Unstressed Unstressed Unstressedoxide
metal
oxide
metal
oxide
metal
oxide
metal
oxide
metal
13
Figure 14 Monoclinic texture intensity ratio for a random powder, for the unirradiated sample and for an oxide grown on an irradiated matrix: a. at the center of the oxide layer, b. at the oxide/metal interface.
In this first paragraph, the impact of uniform damage of the metal matrix on the corrosion kinetics and on the oxide microstructure has been investigated. The main conclusions are that the irradiation damage induced by the chosen conditions of ion-irradiation are the formation of <a>-loops without any amorphization of the precipitates. The corrosion kinetics are strongly increased in the case of the irradiated sample, the kinetic transition occurs sooner but at the same oxide thickness. The
microstructure of the oxide layer formed in an irradiated matrix exhibits a lower tetragonal phase fraction compared to the reference sample. In addition, the d-spacing of the monoclinic phase is slightly lower than that measured in the unirradiated sample which suggests either a more compressive state or slight stoichiometry changes. Finally many cracks have been observed in the irradiated oxide layer including subsurface nanopores.
In order to study the effect of varying irradiation damage, and post-transition corrosion kinetics, samples corroded up to 180 days have been investigated using micro-XRD and micro-fluorescence.
Impact of metal irradiation on corrosion kinetics and oxide microstructure – Post-transition samples Characterizing post-transition samples using micro-XRD and micro-fluorescence has two objectives: it allows the investigation of the metal matrix irradiation on the post-transition kinetics and oxide
microstructure but also allows to study the impact of the implantation peak and a varying damage profile on the oxide microstructure. As presented in Table 2, two samples have been studied in this section: an unirradiated oxide layer corroded for 180 days with a resulting oxide thickness of 3.5 µm and an oxide layer grown on an irradiated metal matrix corroded for 150 days with a resulting oxide thickness of 4 µm. For this section, only the micro-diffraction and micro-fluorescence results are presented. In Figure 15, the integrated intensity of the main oxide peaks and the tetragonal phase fraction as calculated by the Garvie-Nicholson formula are presented for the unirradiated sample. As can be seen from the oxide peak intensity profile across the oxide layer, there are two distinct layers with varying oxide peak intensity. In particular, given the transition thickness of 1.7 µm as given by the kinetic curve in Figure 6, it can be observed that there is an increase of the tetragonal phase fraction just before the transition. Around the transition thickness, the tetragonal phase fraction is the lowest. In the second sub-layer, the increasing tetragonal profile close to the oxide/metal interface as already observed in pre-transition layers (Figure 11), is observed. The average tetragonal phase fraction in this scan is 27.3 % which is close to the pre-transition value.
a.
b.
14 The oxide peak intensities and the tetragonal phase fraction for the irradiated sample corroded 150 days are presented in Figure 16. As can be seen for this figure, similarly to unirradiated sample, the oxide layer is divided into two sublayers with an increase of the tetragonal phase fraction close to the transition thickness of 1.7 µm. The average tetragonal phase fraction in this scan is 24.8 % which is higher than the irradiated pre-transition sample.
Figure 15 a. Integrated intensity of the monoclinic (111), (1�11) and the tetragonal (101) oxide peaks; b. tetragonal phase fraction through the thickness of an oxide formed on an unirradiated Zircaloy-4 sample after 180 days of corrosion at 350°C (post-kinetic transition).
Figure 16 a. Integrated intensity of the monoclinic (111), (1�11) and the tetragonal (101) oxide peaks; b. tetragonal phase fraction through the thickness of an oxide formed on an irradiated Zircaloy-4 sample after 150 days of corrosion at 350°C (post-kinetic transition) (irradiation conditions: 300 keV protons, fluence of 1018 cm-2 at 350°C).
The d-spacing of the main oxide peaks studied for the unirradiated post-transition sample and the irradiated post-transition sample are presented in Figure 17. For the three main oxide peaks studied, the profile and position of the d-spacing across the oxide layer seems similar for the unirradiated and the irradiated layer. In particular, the sub-layer characteristic observed with the peak intensities is not evidenced. This suggest that the stress is relatively uniform across the oxide layer in the plane of observation (perpendicular to the oxide columns, which is equivalent to the radial direction in a cladding tube). The d-spacing observed for the post-transition samples are also similar to those observed in the pre-transition sample except for the M(111) which exhibits a d-spacing close to the unstressed value suggesting a release of the compressive stresses for this phase for the post-transition
oxide
metal
a.
b.
oxide
metal
15 samples.
Figure 17 Monoclinic (111), (1�11) and tetragonal (101) oxide peaks d-spacing through the oxide thickness: a. formed on an unirradiated Zircaloy-4 sample after 180 days of corrosion at 350°C (post-transition unirradiated sample); b. formed on an irradiated Zircaloy-4 sample after 150 days of corrosion at 350°C (post-transition) (irradiation conditions: 300 keV protons, fluence of 1018 cm-2 at 350°C).
Observation of the post-transition samples in the unirradiated and the irradiated state has shown a sub-layer structure with an increase of the tetragonal phase fraction close to the kinetic transition and a value lowest at the transition. The average tetragonal phase fraction is closer to the unirradiated one than when observing pre-transition samples. This suggests the effect of irradiation on the tetragonal phase is less significant in the case of post-transition layers. The effect of the implantation peak is not observed with micro-XRD which suggest that it could be mostly point-defects that are affected and not the sample microstructure. Finally the peak position is similar for both the unirradiated and the
irradiated post-transition samples confirming a smaller effect of irradiation for the longer corrosion durations.
Impact of oxide irradiation on corrosion kinetics and oxide microstructure
After investigating the effect of metal irradiation on the corrosion kinetics and the oxide
microstructure in the previous two parts, the objective of the third part of this study is to understand the impact of oxide irradiation. As described in more details in the ‘Irradiation experiments’, two samples are investigated in this section: one sample that had been pre-corroded for 50 days (oxide thickness of 1.5 µm) then irradiated using 1.3 MeV He ions up to 1017 ions/cm², the second sample has
a. Post-transition
unirradiated sample
b. Metal matrix irradiation –
Post-transition sample
M(111)
T(101)
Unstressed Unstressed UnstressedM(-111)
16 also been corroded for 50 days then irradiated using the same experimental conditions but then re-oxidized for one day at 360°C.
The damage profile as calculated by SRIM is presented in Figure 18a. As can be seen from this figure, the expected damage level across the oxide thickness is relatively uniform. The impact of the oxide irradiation on the corrosion kinetics of irradiated samples is presented in Figure 18b. The corrosion kinetics are significantly affected by irradiation, indeed, corrosion of the irradiated oxide leads to an acceleration of the corrosion rate during 23 days. After 23 days of corrosion, the corrosion rate of the unirradiated sample follows that of the unirradiated one. The samples studied next by TEM and micro-XRD and micro-fluorescence are situated on the corrosion kinetics graph on Figure 18b.
Figure 18 a. Damage profile in the oxide layer of a Zircaloy-4 corroded then irradiated with 1.3 MeV He ions at a fluence of 1017 cm-2 at 20°C ; b. Corrosion kinetics of Zircaloy-4 at 350°C for the unirradiated and the irradiated samples [26].
TEM samples of the cross section of the irradiated oxide layer have been prepared by FIB. A typical TEM bright field micrograph of the oxide layer is presented in Figure 19. This micrograph can be compared to that already presented in Figure 7. No major differences are observed when comparing the unirradiated oxide layer (Figure 7) to the irradiated oxide layer (Figure 19). This suggests the defects created by He irradiation at the chosen experimental condition (fluence, temperature, flux) likely induces small, point defects.
Irradiated
Unirradiated
Time (days)
Reference
Irradiated oxide
Irradiated oxide re-oxidized 1 day
17
Figure 19 TEM micrograph of an irradiated Zircaloy-4 oxide layer (irradiation conditions: 1.3 MeV He ions, fluence of 1017
cm-2, 0.35 dpa).
The results from the micro-XRD analysis on the integrated intensities of the oxide peaks of the irradiated oxide and on the irradiated re-oxidized oxide are presented in Figure 20 and Figure 21 respectively. For both samples, the profile of the tetragonal phase fraction is similar than that of the unirradiated sample (Figure 11b.) with a gradual increase across the oxide layer and a maximum intensity at the oxide/metal interface. The average tetragonal phase fraction of the irradiated oxide layer is approximately 18% while that of the re-oxidized sample is approximately 23%. These values suggest that, similarly to the metal irradiation, the oxide irradiation decreases the tetragonal phase fraction. After one day of re-oxidization of the irradiated metal however, the tetragonal fraction increases and is situated between the irradiated oxide and the reference oxide values.
Figure 20 a. Integrated intensity of the monoclinic (111), (1�11) and the tetragonal (101) oxide peaks; b. tetragonal phase fraction through the thickness of an oxide formed on an irradiated Zircaloy-4 oxide (irradiation conditions: 1.3 MeV He ions, fluence of 1017 cm-2, 0.35 dpa).
oxide
metal
oxide
metal
18
Figure 21 a. Integrated intensity of the monoclinic (111), (1�11) and the tetragonal (101) oxide peaks; b. tetragonal phase fraction through the thickness of an oxide formed on a sample irradiated Zircaloy-4 oxide then re-oxidized 1 day (irradiation conditions: 1.3 MeV He ions, fluence of 1017 cm-2, 0.35 dpa).
Analysis of the M(-111), M(111) and T(101) d-spacing is presented for the irradiated oxide in Figure 22a. and for the re-oxidized irradiated oxide in Figure 22b. From these figures, it seems that some of the compressive stresses in the M(111) irradiated oxide could be released by irradiation. The re-oxidized oxide monoclinic peak positions seem situated in between the irradiated oxide and the reference samples (Figure 13).
Finally, the study of the texture of the irradiated oxide and the re-oxidized irradiated oxide is presented in Figure 23. From this figure, it can be seen that the texture at the oxide/metal interface is different than the random texture for all three samples (unirradiated, irradiated oxide and re-oxidized irradiated oxide). Irradiation thus seems to modify the texture at the interface but not at the center of the oxide. This suggest that the oxide/metal interface seems to be more affected by irradiation than the center of the oxide layer.
oxide
metal
oxide
metal
19
Figure 22 Monoclinic (111), (1�11) and tetragonal (101) oxide peaks d-spacing through the oxide thickness: a. formed on an irradiated Zircaloy-4 oxide; b. formed on an irradiated Zircaloy-4 oxide then re-oxidized 1 day (irradiation conditions: 300 keV protons, fluence of 1018 cm-2 at 350°C).
Figure 23 Monoclinic texture intensity ratio for a random powder, for the unirradiated sample, for the irradiated oxide and for the re-oxidized irradiated oxide layer: a. at the center of the oxide layer, b. at the oxide/metal interface.
Results from the study of an irradiated oxide have been presented in this section. The oxide
microstructure is not significantly modified by irradiation as seen from TEM results. It appears that some of the compressive stresses could be released in the monoclinic phase of the irradiated oxide. The tetragonal phase fraction is also lower for the irradiated oxide. While the microstructural changes
a. Irradiated oxide
b. Re-oxidized irradiated oxide
M(111)
M(-111)
T(101)
Unstressedoxide
metal
oxide
metal
oxide
metal
oxide
metal
oxide
metal
oxide
metal
Unstressed Unstresseda.
b.
20 are small, the corrosion kinetics are significantly accelerated for the irradiated sample. The parameters studied in the re-oxidized oxide are mostly situated in between the irradiated oxide and the
unirradiated oxide. This suggests that the crystallographic state of the oxide layer returns to its initial state after short corrosion durations. The results in this section suggests that the defects induced by irradiation and playing a role in the corrosion kinetics are likely small point-defects. These defects strongly impact the corrosion kinetics while not modifying significantly the oxide microstructure.
Discussion
The effect of metal irradiation on the oxide layer and the corrosion kinetics have been investigated in the first part of this study.
For the unirradiated reference Zircaloy-4 sample, the oxide layer characterized by TEM and synchrotron micro-XRD is compact, composed mostly of the monoclinic phase in the compressed state. Approximately 27% of the oxide layer is composed of the tetragonal phase with an increasing profile across the oxide layer. This increase in concentration of the tetragonal phase at the oxide-metal interface is consistent with previous literature results [14, 18, 19] and could be linked to the gradient in compressive stresses across the oxide layer with a maximum stress value at the oxide/metal interface. The corrosion kinetic behavior of the unirradiated Zircaloy-4 is consistent with literature observations with a kinetic transition occurring at an oxide thickness of about 1.7 µm [18, 20]. In addition the texture of the oxide layer is stronger at the oxide/metal interface compared to that farther away in the oxide layer.
Microstructural characterization of the metal after irradiation have confirmed that only irradiation loops have been created using the chosen ion-irradiation conditions and no amorphization of the SPPs have been observed. The corrosion kinetics of the irradiated sample are increased compared to the unirradiated sample. The oxide layer grown on the irradiated metal matrix exhibits several cracks and nano-pores. In addition, the average fraction of tetragonal oxide phase is lower than for the
unirradiated material. The monoclinic peaks in the oxide layer formed under irradiation have a lower d-spacing than those in the reference sample: this suggests a more compressed oxide or a different stoichiometry. The lower tetragonal phase fraction in the irradiated sample could be due to two factors: the first could be that less tetragonal oxide has formed during the corrosion of the irradiated sample, which could be linked to a different state of equilibrium which could lead to a lower quantity of vacancies thus less tetragonal phase stabilized by oxygen vacancies [27]; the second could be that the same amount of tetragonal phase has formed but it has been more destabilized due to the relaxation of the higher stresses in the oxide (which could in turn be due to a harder matrix). In the current experiment, the distinction between those two possibilities cannot be assessed.
The examination of the post-transition samples has shown that the sub-layer structure is observed in both the unirradiated and the irradiated sample which is consistent with literature studies on thicker oxide layers [18]. An increase of the tetragonal phase fraction at the transition is also observed in both sample suggesting a link between the destabilization of the tetragonal phase fraction and the increase in corrosion kinetic. The average tetragonal phase fraction of the irradiated post-transition samples is very close to that of the unirradiated post-transition sample contrarily to the pre-transition samples where the effect was more significant. This suggest that post-transition layers are less affected by initial metal irradiation even though the corrosion affect highly irradiated parts of the metal. The kinetic curve has shown in particular that once the entire damage region has been corroded, the corrosion rate of the irradiated sample follows that of the unirradiated one.
The second main part of this study was to investigate the effect of irradiation of the corrosion layer. Ion-irradiation conditions were carefully chosen in order to avoid phase transformation of the
21 monoclinic oxide phase. The irradiated oxide layer exhibited no visible differences with the reference unirradiated layer using TEM. In particular no cracks were observed in the irradiated oxide or in the irradiated oxide re-oxidized one day.
The fact that no cracks were observed in the irradiated oxide while many cracks were observed in the oxide formed on metal irradiation suggests that cracking of the oxide is strongly linked to the
mechanical state of the metal matrix. Irradiation, by forming <a>-loops has hardened the matrix leading to a modification of the mechanical equilibrium between metal and oxide. A harder matrix means less accommodation of the stresses of the oxide growing on the matrix, up to a point of
cracking if the stresses are sufficient and thus a loss of protectiveness of the oxide layer and a resulting acceleration of the corrosion kinetics. This phenomenon is very similar to the faster corrosion kinetics observed in cold-worked stress-relieved Zircaloy-4 compared to recrystallized material [28] or to the acceleration of corrosion seen in heavily hydrided samples [2, 10].
The average tetragonal phase fraction of the irradiated oxide is lower than that of the reference sample. This is mostly due to a lower value of the tetragonal phase fraction near the oxide/metal interface. This suggests that irradiated has destabilized the tetragonal phase at the interface. Re-oxidizing the sample even one day tends to increase this value at the interface closer to the reference sample. The effect of irradiation on the tetragonal phase is thus visible even at small damage levels.
The corrosion kinetics of the irradiated oxide are accelerated when compared to the unirradiated material. This similar behavior to the metal irradiated samples could suggest that the defects created by irradiation accelerate diffusion of the oxygen vacancies in both cases.
Overall the microstructure of an oxide grown on an irradiated metal matrix and of an irradiated oxide is not extensively different than the reference sample. Some key parameters, such as the tetragonal phase fraction and porosity have been observed but the rest of the investigated parameters suggests that it could be mainly point-defects created by irradiation that have a strong influence on the corrosion kinetics. Techniques studying defects at this level such as Raman spectroscopy could thus bring additional information on the corrosion mechanism and how it is affected by irradiation [26].
Conclusions
The impact of irradiation on the corrosion kinetics and oxide microstructure have been studied using TEM and synchrotron micro-diffraction of ion-irradiated samples. The effects of the irradiation of the metal matrix and of the oxide layer have been studied separately.
Common observations between metal irradiation and oxide irradiation are as follows:
• Ion-irradiation of the metal matrix and of the oxide layer both lead to an acceleration of the corrosion kinetics.
• Irradiation induces a decrease of the tetragonal phase fraction. Differences observed between metal irradiation and oxide irradiation are as follows:
• The oxide formed on irradiated metal is severely cracked and presents a lower d-spacing which could be due to higher compressive stresses and/or stoichiometry variations.
• Irradiation of the oxide releases some of the compressive stresses in the monoclinic phase. No differences are observed in TEM: defects formed are likely point-defects.
22 The impact of irradiation of the metal and of the oxide is different in terms of oxide microstructure but similar in terms of corrosion kinetics.
Acknowledgements
The authors are grateful for the help of T. Soyez for his valuable participation in XRD data analysis. The authors would like to thank the staff of the Jannus Orsay and Jannus Saclay facilities for the use of the equipment. Use of the Advanced Photon Source is supported by the U.S. Department of Energy, Office of Basic Energy Sciences under Contract No. DE-AC02-06CH11357.
References
1. Garzarolli, F., Y. Broy, and R.A. Busch. Comparison of the Long-Time Corrosion Behaviour of Certain Zr Alloys in PWR, BWR and Laboratory Tests. in Zirconium in the Nuclear Industry: 11th International Symposium. 1996.
2. Blat, M., et al. Contribution to a Better Understanding of the Detrimental Role of Hydrogen on the Corrosion Rate of Zircaloy-4 Cladding Materials. in Zirconium in the Nuclear Industry: 12th International Symposium. 2000.
3. Kim, Y.S., K.S. Rheen, and D.K. Min. Phenomenological Study of In-Reactor Corrosion of Zirconium Alloys by Hydrides. in Zirconium in the Nuclear Industry: 10th International Symposium. 1994.
4. Garde, A.M. Enhancement of Aqueous Corrosion of Zircaloy-4 Due to Hydride Precipitation at the Metal/Oxide Interface. in Zirconium in the Nuclear Industry: 9th International
Symposium. 1991.
5. Iltis, X., F. Lefebvre, and C. Lemaignan. Microstructure Evolution and Iron Redistribution in Zircaloy Oxide Layers: Comparative Effets of Neutron Irradiation Flux and Irradiation Damages. in Zirconium in the Nuclear Industry: 11th International Symposium. 1996.
6. Lemaignan, C. Physical Phenomena Concerning Corrosion Under Irradiation of Zr Alloys. in Zirconium in the Nuclear Industry: 13th International Symposium. 2002.
7. Douglass, D.L., The Metallurgy of Zirconium, in Atomic Energy Review, Z.I. Turkov, Editor 1971, International Atomic Energy Agency: Vienna, Austria.
8. Lefebvre, F. and C. Lemaignan, Irradiation Effects on Corrosion of Zirconijm Alloys Claddings. Journal of Nuclear Materials, 1997. 248: p. 268-274.
9. Pêcheur, D., et al., Precipitate evolution in the Zircaloy-4 oxide layer. Journal of Nuclear Materials, 1992. 189(3): p. 318-332.
10. Tupin, M., et al., Mechanism of corrosion of zirconium hydride and impact of precipitated hydrides on the Zircaloy-4 corrosion behaviour. Corrosion Science, 2015. 98: p. 478-493. 11. Bisor-Melloul, C., Compréhension des mécanismes de prise d'hydrogène des alliages de
zirconium en situation de corrosion en conditions REP - Impact des hydrures sur la corrosion du Zircaloy-4, in Department of Nuclear Materials - CEA2010, Université d'Evry.
12. Dali, Y., et al., Corrosion kinetics under high pressure of steam of pure zirconium and zirconium alloys followed by in situ thermogravimetry. Journal of Nuclear Materials, 2012.
426: p. 148-159.
13. Gibert-Mougel, C., et al., Phase transformation of polycrystalline zirconiuam induced by swift heavy ion irradiation. Journal of Nuclear Materials, 2001. 295(121-125).
14. Yilmazbayhan, A., et al., Structure of zirconium alloy oxides formed in pure water studied with synchrotron radiation and optical microscopy: relation to corrosion rate. Journal of Nuclear Materials, 2004. 324: p. 6-22.
15. Doriot, S., et al. Microstructural Stability of M5 Alloy Irradiated up to High Neutron Fluences. in Zirconium in the Nuclear Industry: 14th International Symposium. 2005. 16. Zu, X.T., et al., Effet of proton and Ne irradiation on the microstructure of Zircaloy-4.
Philosophical Magazine, 2012. 85: p. 649-659.
17. Garvie, R.C. and P.S. Nicholson, Phase analysis in zirconia systems. Journal of the American Ceramic Society, 1972. 55(6): p. 303-305.
23 18. Motta, A.T., et al. Microstructure and growth mechanism of oxide layers formed on Zr alloys
studied with micro-beam synchrotron radiation. in Zirconium in the Nuclear Industry: 14th International Symposium. 2005.
19. Bechade, J.L., et al., Studies of Zirconium Alloy Oxide Layers Using Synchrotron Radiation. Materials Science Forum, 2000. 347(1): p. 471-476.
20. Bossis, P., et al. Multi-Scale Characterization of the Metal-Oxide Interface of Zirconium Alloys. in Zirconium in the Nuclear Industry: 12th International Symposium. 2000.
21. Petigny, N., et al., In situ XRD analysis of the oxide layers formed by oxidation at 743 K on Zircaloy-4 and Zr-1NbO. Journal of Nuclear Materials, 2000. 280: p. 318.
22. Kim, H.G., T.H. Kim, and Y.H. Jeong, Oxidation characteristics of basal (0002) plane and prism (1120) plane in HCP Zr. Journal of Nuclear Materials, 2002. 306.
23. Vrtlikova, V., et al. in International topical meeting on LWR fuel performance. 2000. Park City, UT, USA.
24. The Powder Diffraction File, 2006, International Center for Diffraction Data.
25. Cullity, B.D., Elements of X-ray Diffraction. Second Edition ed1978: Addison-Wesley Publishing Company, Inc.
26. Verlet, R., et al., Influence of light ion irradiation of the oxide layer on the oxidation rate of Zircaloy-4. Corrosion Science, 2015. 98(327-338).
27. Raza, M., et al., Oxygen vacancy stabilized zirconia (OVSZ); a joint experimental and theoretical study. Scripta Materialia, 2016. 124: p. 26-29.
28. Thomazet, J., et al. Fragema zirconium alloy corrosion behaviour and development. in
Fondamental Aspects of Corrosion on Zirconium Base Alloys in Water Reactor Environments. 1990.
![Figure 1Three dimensional map of µ-XRD analyses performed on a reference sample corroded in light primary water at 360°C during 171 days (oxide thickness of 3.6 µm) [10]](https://thumb-eu.123doks.com/thumbv2/123doknet/7757799.254527/4.892.231.663.111.409/figure-dimensional-analyses-performed-reference-corroded-primary-thickness.webp)
![Table 1 Composition of Zircaloy-4 alloy used in this study [12].](https://thumb-eu.123doks.com/thumbv2/123doknet/7757799.254527/5.892.113.777.495.554/table-composition-zircaloy-alloy-used-study.webp)

![Figure 4 Schematic of the experimental set-up for the synchrotron micro-diffraction and micro-fluorescence experiments conducted at the 2-ID-D beamline at the APS (similar set-up as in [14])](https://thumb-eu.123doks.com/thumbv2/123doknet/7757799.254527/7.892.126.633.261.520/schematic-experimental-synchrotron-diffraction-fluorescence-experiments-conducted-beamline.webp)