1
Comparison of different power plant clustering approaches for
modelling future power systems
First: Matija Pavičević, Third: Tomislav Pukšec Faculty of Mechanical Engineering and Naval Architecture
University of Zagreb, Zagreb, Croatia e−mail: matija.pavicevic@fsb.hr
Second: Sylvain Quoilin
Energy Systems Research Unit, Quartier Polytech University of Liege, Liege, Belgium
e−mail: squoilin@ulg.ac.be
ABSTRACT
Power system’s operational flexibility represents its ability to respond to unpredictable and unexpected changes in generation or demand. Traditional policy and planning models in most cases do not take in to the account the technical operating constraints that are directly responsible for its operational flexibility. Nevertheless, this capability becomes increasingly important with the integration of significant amounts of renewables (>=25%) whose intermittent nature is directly responsible for the decreased flexibility inherent in low-carbon generation technologies. Incorporating flexibility can significantly change optimal generation strategies, lower total system costs and improve policy impact estimates. The goal of this research is to prove that for computational efficiency reasons, it is useful to cluster some of the original units into larger ones. This process reduces the number of continuous and binary variables and can, in some conditions, be performed without significant loss of simulation accuracy. For these purposes a unit commitment and power dispatch model named Dispa-SET that focuses on the balancing and flexibility problems in the European grids has been applied to the Western Balkans power system. Two clustering options are available inside the model. MILP formulation aggregates very small or very flexible units into larger ones with averaged characteristics. LP formulation additionally simplifies the mathematical formulation by neglecting minimum up and down times, start-up costs and minimum stable loads. Preliminary results have shown that the difference between disaggregated and clustered approaches is almost negligible and falls within 15 % margin. This is especially true for highly interconnected regional systems with relatively high shares of hydro energy that is till now still the best flexibility option available for balancing out the renewables.
KEYWORDS
Power dispatch, Power plant clustering, Operational flexibility, Dispa-SET, Renewable energy, Western Balkans
INTRODUCTION
The IPCC’s Fifth Assessment Report-AR5 [1] confirms unequivocally global warming and provides evidence of its substantial and wide-ranging consequences such as permafrost melting, heavy precipitations, floods, droughts wildfires etc. However, despite the global huge commitment achieved by the Paris Agreement, during the 21° session of the Conference of the Parties to the United Nations Convention (COP21), countries’ pledges are still not enough to face the climate change challenge [2][3]. In fact a comprehensive portfolio of climate change
2
strategies must include both mitigation and ad hoc adaptation actions that allow achieving multiple goals in the sustainable development areas [4]. In order to tackle this issues the European Union has set itself a target to collectively reach a share of at least 27% renewables in the final energy consumption by 2030 [5]. This energy based goal could translate into 50% of total electricity production from renewable energy sources (RES-E) and reduction of GHG emissions by 40% [6]. For the 2050 framework these targets will increase even further reducing the GHG emissions by 80% and increasing the share of RES in electricity consumption up to 97% [7]. The Western Balkans is an interesting South East European (SEE) geopolitical area. It consists of one EU member state (Croatia), four candidate countries (Albania, Macedonia, Montenegro and Serbia) and two potential candidate countries (Bosnia and Herzegovina and Kosovo) [8] that have started to implement some the Unions 'acquis communautaire' and will eventually contribute to the common 2030 and 2050 climate targets.
European institutions, transmission system operators, scientific researchers and private companies have put a lot of effort to analyse the behaviour of future power systems. One of the main research fields, among others is power systems flexibility requirements and their modelling. They can be divided into four subgroups: instantaneous, short-term, mid-term and long-term flexibility requirements. Protection and stability is modelled at the fastest timeframes in order to ensure reliable system operation during normal operations and in the fractions of a second following a disturbance. In order to assess the voltage stability of the power system authors from [9] have developed a voltage stability index that can be used to estimate its stability margin. Load flow is another instantaneous flexibility requirement that captures many of the unique power system challenges such as the supply and demand balance. Although there are numerous studies dealing with the similar issue the basic concept is usually the same as the one proposed in [10]. This is a multi-objective optimal load flow simulation that generates a pareto optimal solution. Economic dispatch is another instantaneous to short-term flexibility requirement. It attempts to find the least cost combination of power generators to meet the demand. This can be done in numerous ways by either solving mixed integer linear programming (MILP) problem or introducing the genetic algorithms as shown in [11]. Unit commitment is a short-term requirement of the system that usually looks couple of hours to a few days in advance in order to determine which generators should be turned on and be ready for continuous dispatch. Authors from [12] have developed a unit commitment and power dispatch model that assess the joint effect of the centralized cogeneration plant and thermal storage on the efficiency and cost of the power system. Maintenance is a mid-term flexibility requirement where power generators are scheduled for maintenance, usually one to five weeks during low demand periods. Reliable maintenance scheduling of pumps in existing thermal power plants can reduce the maintenance costs by prolonging its availability as described in [13]. Hydro-thermal coordination is a mid-term to long-term flexibility requirement that allocates the water usage in accumulation dams. Authors from [14] have analysed the water-energy nexus of the Greek power system. Moreover, they quantified the generation costs, the environmental impacts, the water consumptions and withdrawals, as well as the water stress at different power plant locations throughout a year. Production costs can also be grouped into the mid-term to long-term requirements where modelling enters the realm of determining the expected costs of operating the power system for an extended period of time. Recent study that evaluates a power management for a hybrid renewable energy system with hydrogen production is a good example of how to allocate optimal production with the goal of minimizing the total system costs [15]. The final long-term flexibility is related to the capacity planning. It attempts to optimize investments into the future generation capacities at the least cost while maintaining reliability and reducing the environmental impact. This is computationally most CPU intense process. As described in the [16] power capacity expansion planning considering endogenous technology cost learning can take up to several days when no simplifications or relaxations are
3
introduced. When applied to the UK power system, simulations can range from 43 h upwards if cluster of 32 machines with total of 296 GB RAM is used. On the other hand authors from [17] have proven that a long-term capacity expansion planning model for an electric power system integrating large-size renewable energy technologies can simplify the complexity of such models reducing the computation time down to several hours.
This research is the extension of the earlier work [18] where the Dispa-SET model has been applied to the Western Balkans power systems and seven countries from the SEE [19]. It analyses different approaches related to the modelling of unit-commitment and economic dispatch problems in future power systems with high shares or renewable energy. Moreover, it compares the results from two different modelling approaches, MILP and MILP Clustered, and assesses their impact on the flexibility of the system. The hypothesis of this research is that the difference between disaggregated and clustered approaches is almost negligible and falls within margin of fifteen percentile points, especially in systems with high shares of renewable energy.
METHODS Framework
In early days of electric power systems, dispatch was scheduled manually and all decisions were done by human operators who based their decisions on experience from the past. That kind of dispatch was suboptimal and implementation of computer algorithms that had the ability to model unit commitment with high level of detail began to rise. The combined practical importance and theoretical complexity lead the optimization and power systems communities to use the latest optimization techniques including dynamic programming, branch-and-bound, genetic algorithms, and meta-heuristics such as ant colony. Nevertheless, Lagrange relaxation methods have dominated implementation of unit commitment in the markets and utility operators. Today MILP has re-emerged as one of the most convenient formulations for solving such problems as it also greatly simplifies formulating and adding additional constraints when compared to the Lagrange relaxation. With the use of the state-of-the-art general-purpose solvers modelers can now focus their effort on tweaking and tuning the algorithms in order to gain additional performance boost. Besides, dramatic speed and performance improvements can be made by adjusting the problem formulation itself. This can be done in couple of ways but in general there are three well known solutions: Tightening; reducing integer variables; and reducing the overall problem size.
Tightening of the relaxed integer formulation
The relaxed integer (linear) equations can be tightened to approximate more closely the non-convexities inherent to the MILP problems. This can be done in such a way that feasible integer solution space falls at integer solutions. This enables a LP representation to closely match the MILP formulation by allowing a more efficient brunch-and-cut method [20].
Reducing integer variables
Algorithms that can solve continuous LP problems are significantly more powerful and thus much faster and can take advantage of the fact that there are no discontinuities caused by the integer variables present in the MILP optimization problems [20].
Reducing overall problem size
Reducing the overall problem size can drastically decrease the required computation time as all known classes of LP algorithms scale with at least polynomial time that is a function of problem
4
dimension and size. In some instances this can reduce the computation time by factor of ten or more as described in [16] and [20].
Traditional formulation approaches
Traditional formulations of unit commitment problem are dedicated to the minimization of operating costs of two or more generator units committed to meet the power demand from the network. In most simple case the objective function can be formulated as follows:
𝐶𝑡𝑜𝑡= 𝑚𝑖𝑛 ∑ ∑(𝑐
𝑔,𝑡𝑠𝑡𝑎𝑟𝑡+ 𝑐𝑔,𝑡𝑣𝑎𝑟)
𝑡∈𝑇 𝑔∈𝐺
(1)
where 𝐶𝑡𝑜𝑡 are the total operation costs (€); 𝑐𝑔,𝑡𝑠𝑡𝑎𝑟𝑡 are the start-up costs (€) and 𝑐𝑔,𝑡𝑣𝑎𝑟 are variable costs of all units, g, and all time periods, t. Start-up costs represent the costs of committing the unit (on/off) and can be expanded by the additional fixed costs such as personnel and maintenance. They are formulated as follows:
𝑐𝑔,𝑡𝑠𝑡𝑎𝑟𝑡= 𝑆𝑔,𝑡∙ (𝑓𝑔𝑠𝑡𝑎𝑟𝑡∙ 𝑐𝑔
𝑓𝑢𝑒𝑙
+ 𝑐𝑔 𝑓𝑖𝑥
) (2)
where 𝑆𝑔,𝑡 (𝐷𝑔,𝑡) represents the start-up and shot-down events (-), 𝑓𝑔𝑠𝑡𝑎𝑟𝑡 is a fuel use per
start-up (MWh/start), 𝑐𝑔𝑓𝑢𝑒𝑙 are additional fixed costs per start (€/start) and 𝑐𝑔𝑓𝑖𝑥 are all additional fixed costs (€). This formulation is appropriate for long-term unit commitment problems and does not take into the account the warm and cold start-up costs. Start-up events can be formulated as follows:
𝑈𝑔,𝑡= 𝑈𝑔,𝑡−1+ 𝑆𝑔,𝑡− 𝐷𝑔,𝑡 ∀ 𝑈𝑔,𝑡, 𝑆𝑔,𝑡, 𝐷𝑔,𝑡 ∈ {0,1} (3)
where 𝑈𝑔,𝑡 represents the commitment (on/off) of each unit and is usually set to 1 if running and 0 if shut down. Solving the unit commitment problem results in optimal dispatch of given units they are dedicated to covering the demand. Thus, the following system balance constraint is mandatory in all unit commitment formulations and ensures that the sum of all power outputs 𝑃𝑔,𝑡, (MW) is equal to the sum of all the demands 𝐿𝑡, (MW), at all time periods:
∑ 𝑃𝑔,𝑡 𝑔∈𝐺
= 𝐿𝑡 ∀ 𝑡 ∈ 𝑇 (4)
Most conventional units cannot operate below certain load. Thus, it is necessary to introduce minimum and maximum output constraints that can be modelled as follows:
𝑈𝑔,𝑡∙ 𝑃𝑔𝑚𝑖𝑛≤ 𝑃𝑔,𝑡≤ 𝑈𝑔,𝑡∙ 𝑃𝑔𝑚𝑎𝑥 (5)
where 𝑃𝑔𝑚𝑖𝑛 is the minimum power output (MW) and 𝑃
𝑔𝑚𝑎𝑥 maximum power output (MW) of
unit g. Convectional units are also constrained by the ramping limits. They describe how fast a thermal unit can adjust its power output and are formulated as follows:
𝑃𝑔,𝑡−1− 𝑃𝑔,𝑡≤ 𝑈𝑔,𝑡∙ ∆𝑃𝑔𝑑𝑜𝑤𝑛,𝑚𝑎𝑥+ max (𝑃𝑔𝑚𝑖𝑛, ∆𝑃𝑔𝑑𝑜𝑤𝑛,𝑚𝑎𝑥) ∙ 𝐷𝑔,𝑡 (6) 𝑃𝑔,𝑡− 𝑃𝑔,𝑡−1≤ 𝑈𝑔,𝑡∙ ∆𝑃𝑔 𝑢𝑝,𝑚𝑎𝑥 + max (𝑃𝑔𝑚𝑖𝑛, ∆𝑃𝑔 𝑢𝑝,𝑚𝑎𝑥 ) ∙ 𝑆𝑔,𝑡
where ∆𝑃𝑔𝑑𝑜𝑤𝑛,𝑚𝑎𝑥 and ∆𝑃𝑔𝑢𝑝,𝑚𝑎𝑥 are ramp-up and ramp-down limits. Another constraint is related to the thermal unit operation. This are the minimum up and down times and can be formulated as follows:
5 𝑈𝑔,𝑡≥ ∑ 𝑆𝑔,𝜏 𝑡 𝜏=𝑡−𝑎𝑔min 𝑢𝑝 (7) 1 − 𝑈𝑔,𝑡≥ ∑ 𝐷𝑔,𝜏 𝑡 𝜏=𝑡−𝑎𝑔min 𝑑𝑜𝑤𝑛
where 𝑎𝑔min 𝑢𝑝 and 𝑎𝑔min 𝑑𝑜𝑤𝑛 are minimum up and down times (h). Clustering concept
For problems with simplified or non-binding transmission constraints, it is possible to combine similar generating units into clusters. Thus, for computational efficiency reasons, it is useful to cluster some of the original units into fewer larger ones. This mainly reduces the number of continuous and binary variables and can, in some conditions, be performed without
significant loss of simulation accuracy [21]. Clusters enable replacement of large sets of binary commitment decisions dedicated to each unit with a smaller set of such integer or binary states dedicated to each cluster. Integer or binary commitment decisions are somewhat
distinguishable from each other as with clustering the integer commitment state varies from zero to the number of units in the cluster. Such formulation still enables capturing of commitment decisions and to them associated relations for each unit. On the other hand, binary commitment decisions can only be related to the whole clusters and to them associated
relations such as such as power output level, reserves contribution, etc.
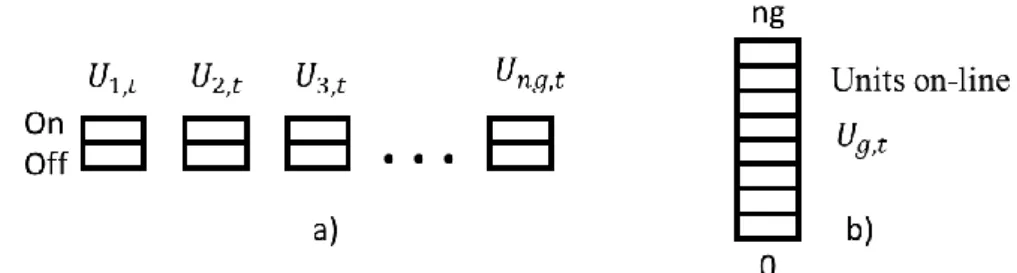
Figure 1 is a graphical representation of this two clustering approaches. From there it is clear that in traditional formulation each unit has its separate binary variable representing either on or off state of each unit while in clustering formation there is only one binary state dedicated to the commitment of the whole cluster and one integer variable dedicated to the number of units from that particular cluster being on line.
Figure 1 Comparison between traditional (a) and clustered (b) unit commitment for a single type of unit in a single time period [20].
Literature suggests that the number of possible discrete combinations of commitment variables with the traditional formulation scales exponentially with the number of units 2𝑛𝑔 [20].
Clustering approach on the other hand dramatically reduces this dimensionality to the product of the cluster sizes: ∏𝑛𝑔. This can lead to the reduction of the problem size of up to almost
6
97% resulting in a significant performance boost. Modern state-of-the-art brunch and cut solvers already implement sophisticated pruning methods that produce significant performance boosts even in traditional formulations. Nevertheless, clustering can still outperform traditional formulation in terms of computational speed by sacrificing small amount of accuracy.
Mathematically speaking, clustering represents a simple change to the original traditional formulation of the unit commitment problem. Here individual units are replaced by the clusters. Thus, the following relations remain the same for both approaches: Objective function (1); Variable and start-up costs (2); System balance (4); Minimum and maximum output constraint (5). Mathematical formulation of ramping limits and minimum up and down times is significantly different as now they impose constraints for the whole cluster rather than the individual units themselves. New formulation of the ramping limits now has the following form: 𝑃𝑔,𝑡−1− 𝑃𝑔,𝑡≤ (𝑈𝑔,𝑡− 𝑆𝑔,𝑡) ∙ ∆𝑃𝑔𝑑𝑜𝑤𝑛,𝑚𝑎𝑥− 𝑃𝑔𝑚𝑖𝑛∙ 𝑆𝑔,𝑡 +max (𝑃𝑔𝑚𝑖𝑛, ∆𝑃 𝑔𝑑𝑜𝑤𝑛,𝑚𝑎𝑥) ∙ 𝐷𝑔,𝑡 (8) 𝑃𝑔,𝑡− 𝑃𝑔,𝑡−1≤ (𝑈𝑔,𝑡− 𝑆𝑔,𝑡) ∙ ∆𝑃𝑔 𝑢𝑝,𝑚𝑎𝑥 + max (𝑃𝑔𝑚𝑖𝑛, ∆𝑃𝑔 𝑢𝑝,𝑚𝑎𝑥 , 𝑃𝑔 𝑞𝑢𝑖𝑐𝑘𝑠𝑡𝑎𝑟𝑡 ) ∙ 𝑆𝑔,𝑡 −𝑃𝑔𝑚𝑖𝑛∙ 𝑆𝑔,𝑡
where 𝑃𝑔𝑞𝑢𝑖𝑐𝑘𝑠𝑡𝑎𝑟𝑡 = 𝑎𝑔𝑞𝑢𝑖𝑐𝑘𝑠𝑡𝑎𝑟𝑡∙ 𝑃𝑔𝑚𝑖𝑛. Formulation of the minimum down time now takes in
to the account the number of units currently in off state. This leads to the following alteration of the (7): 𝑛𝑔− 𝑈𝑔,𝑡≥ ∑ 𝐷𝑔,𝜏 𝑡 𝜏=𝑡−𝑎𝑔min 𝑑𝑜𝑤𝑛 (9) Clustering methodology
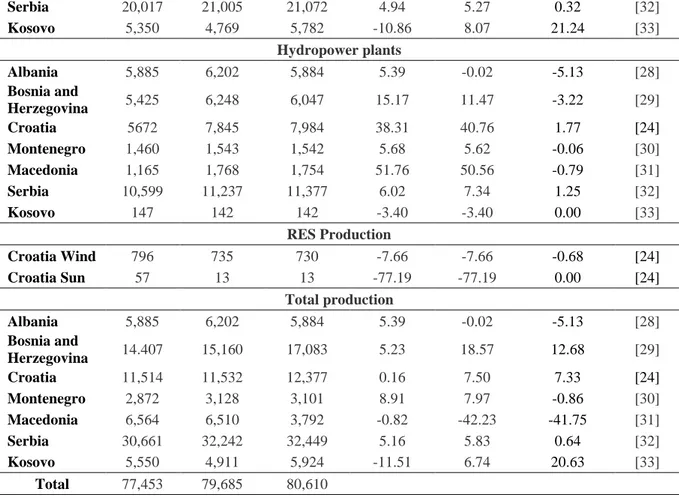
This research applies three different methods for clustering that are already built in into the DispaSET energy system modelling tool. Figure 2 is a graphical representation of those three clustering methods. Starting from the left units can be clustered only if they are of the same type, meaning that their description is the same (Gas, Coal, Hydro etc.), have the same values (Ramping rates, Start-up costs, Efficiency etc.) and their minimum power output is close to zero. Second method clusters highly flexible units of the same type whose start-up time is less than 1h. Third method groups small units whose maximum power output is less than 30 MW into a single cluster.
Figure 2 Graphical representation of different MILP clustering options built in the DispaSET tool [21].
7
CASE STUDY
In order to analyse different simulation approaches a case study analysis has been carried out. Both MILP formulations, the traditional and clustered one, have been analysed in terms of computation time, memory requirements and simulation results. Case A represents a traditional formulation of unit commitment and power dispatch problem where operation of each powerplant is optimized individually taking into the account all the operational constraints such as minimum up and down times, ramping limits and their costs, start-up and shut-down costs, minimum number of hours in operation, minimum start-up time, minimum partial load, CO2
intensity, CHP related constraints such as power-to-heat ratio, lost load due to the increase of steam extraction from the turbine; and storage related constraints such as capacity, charging and discharging power and their efficiency. In the year 2015, 122 hydropower plants and 24 thermal power plants were dedicated to electricity production in the analyzed region. Hydropower plants are divided into run of river hydropower plants (HROR) and hydro dam power plants (HDAM). Thermal power plants consist of either lignite, coal or oil-fired steam turbine power plants (STUR) and natural gas fired combined cycle power plants (COMC). Since this paper is a upgrade of previous work from the same authors [18][19] all the upgrades are discussed in the chapter below.
Table 1 lists all steam turbine (STUR), combined cycle (COMC), gas turbine (GTUR) and internal combustion engine (ICEN) units from Croatian zone, including technical parameters such as minimal and maximal efficiencies, start-up times, minimum up and down times, ramping rates, minimal part loads and CO2 intensities. The total combined installed capacity of
all units from Croatia and the Western Balkans region sums up to 9.921 MW. Of that, the two Serbian power plants Nikola Tesla A and Nikola Tesla B amount to more than 26.17 % of the regions total installed capacity. The smallest power plants have a capacity of 1 MW and are located in Croatia. It is the only ICEN power plant in the region. The three gas fired COMC power plants are located in Serbia and one in Croatia. They were initially built as peaking power plants, but due to the ongoing drop in price of electricity in neighboring countries their annual operation is limited to couple of days or even hours depending on weather conditions. All the technical data related to the operation parameters of the power plants is discussed in more detail in other scientific publications such as [22][23]. All other data related to the thermal power plants from the region can be found in [18][19].
Table 1 Technical data of the thermal power plants located in Croatia in the year 2015 [24]
Unit Zone Techology Power Effi-ciency Start Up Time Min Up Time Min Down Time Ramp Rates Min Part Load CO2 Intensity MW % h h h %/min % kg/MWh
KTE Jertovec HR COMC/GAS 78 0.36 3 2 2 0.06 0.062 0.398
EL-TO Zagreb HR STUR/GAS 90 0.15 3 2 2 0.06 0.122 0.398
mTEO Jakusevac HR GTUR/WST 2.036 0.38 6 1 0.25 0.1 0.2 1.062
TE-TO Zagreb HR STUR/GAS 440 0.306 3 2 2 0.06 0.15 0.398
TE -TO Osijek HR STUR/GAS 90 0.393 6 2 2 0.06 0.277 0.398
PZ Osatina HR ICEN/BIO 1 0.35 1 1 1 0.2 0.2 0.123
Bovis HR ICEN/BIO 1 0.35 1 1 1 0.2 0.2 0.123
NE Krsko HR STUR/NUC 348 0.57 24 10 24 0.025 0.5 0
TE Sisak HR STUR/OIL 396 0.57 3 6 1.5 0.025 0.15 0.517
8
TE Biomass HR STUR/BIO 24.6 0.45 3 1 2 0.02 0.02
TE Plomin 1 HR STUR/HRD 110 0.4 6 6 1.5 0.025 0.3 1.062
TE Plomin 2 HR STUR/HRD 192 0.42 6 6 1.5 0.025 0.3 1.062
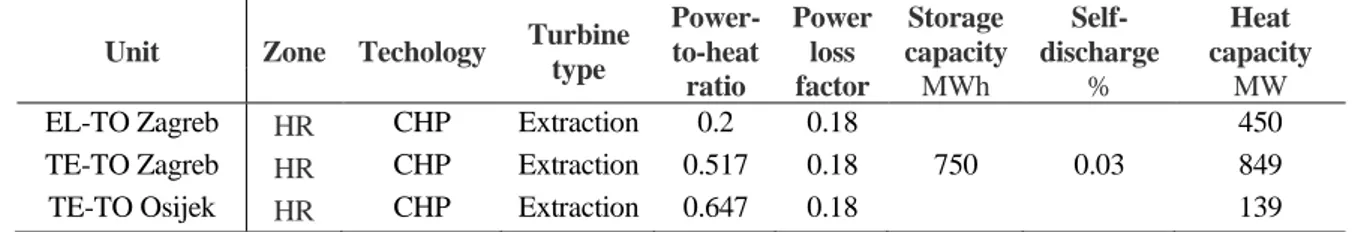
Table 2 represents a list of all three combined heat and power (CHP) power plants located in Croatian zone. It lists all CHP related parameters such as power-to-heat ratio, power loss factors and heat capacities. One unit, namely TE-TO Zagreb, also has a thermal storage unit that is used for efficiency reasons as it gives the unit additional flexibility in periods with reduced heating demand especially during the summer period. TE-TO Zagreb and TE-TO Osijek have relatively high power-to-heat ratio making them less flexible for electricity production while on the other hand EL-TO Zagreb is more focused on the heat production as its power to heat ratio is around 0.2 meaning that for 450 MW of heat it can only generate up to 90 MW of power.
Table 2 Technical data related to the Croatian CHP power plants [24]
Unit Zone Techology Turbine type Power-to-heat ratio Power loss factor Storage capacity Self-discharge Heat capacity MWh % MW
EL-TO Zagreb HR CHP Extraction 0.2 0.18 450
TE-TO Zagreb HR CHP Extraction 0.517 0.18 750 0.03 849
TE-TO Osijek HR CHP Extraction 0.647 0.18 139
Table 3 is a list of the Croatian HDAM units and their technical parameters such as nominal installed capacities, flow rates, nominal head, accumulation volume and nominal capacity. The total installed capacity of all HDAM’s in the region sums up to 6.788 MW. Of that 20.61 % is located in Albania, 25.81 % in Bosnia and Herzegovina, 22.25 % in Croatia, 9.99 % in Montenegro, 6.91 % in Macedonia, 14.12 % in Serbia and 0.51 % in Kosovo. Capacity wise, the largest HDAM in the region is HE Koman located in Albania, with a nominal capacity of 600 MW. In terms of potential energy accumulation and accumulation volume, the largest HDAM’s in Croatian zone are RHE Orlovac (potential energy in accumulation of 809.761 MWh), and HE Dubrovnik (accumulation volume of 1.109.000.000 m3). The accumulation period in these HDAM’s ranges from three to five days in the case of HE Zakućac and HE Vinodol and up to several months for HE Orlovac and HE Dubrovnik. Among all those HDAM’s five are pumped hydro power plants (HPHS): RHE Velebit with a turbine power rating of 276 MW and a pump power rating of 240 MW, RHE Orlovac with a turbine power rating of 237 MW and pump power rating of 10.2 MW and a small RHE Vindol with a turbine power of 5.4 MW and pump power rating of 6.9 MW.
Table 3 Technical data of the accumulation and pumped hydro power plants from the Croatian zone in the year 2015 [24].
Unit Zone Nominal power Installed flow Nominal head Accumulation volume Energy in accumulation MW m3/s m 1,000 m3 MWh HE Zakucac HR 486 220 250 3.000.000 2.047 HE Senj HR 216 60 410 128.000.000 143.008 HE Dubrovnik_HR HR 108 45 272 1.109.000.000 821.991 HE Vinodol HR 90 16.7 648 1.230.000 2.172 HE Peruca HR 60 120 47 541.000.000 69.289 HE Sklope HR 22.5 45 60 128.000.000 20.928
9
RHE Velebit HR 276 60 517 12.300.000 14.800
RHE Orlovac HR 237 70 380 782.000.000 809.761
RHE Vinodol HR 5.4 16.1 - - 4.049
Table 4 lists the Croatian HROR power plants and to them related technical parameters such as nominal installed capacities and flow rates. The total installed capacity of all HROR’s in the region sums up to 2.838 MW. Of that almost half, or around 46.79 %, is concentrated in the units Djerdap 1 and Djerdap 2, located in Serbia, while the remaining capacity is spread over 80 smaller ones, with an average capacity of 20 MW. All these HROR’s are mainly used as base load units whose production is proportional to the discharge rates of the rivers on which they are situated.
Table 4 Technical data for the hydro run of river power plants located in Croatia in the year 2015 [24]
Unit Zone
Nominal power
Installed
flow Unit Zone
Nominal power Installed flow MW m3/s MW m3/s HE Kraljevac HR 46.4 55 HE Gojak HR 55,5 57 HE Đale HR 40.8 220 HE Lešće HR 41.2 122 HE Varaždin HR 92.46 500 HE Rijeka HR 36.8 21 HE Dubrava HR 79.78 500 HE Miljacka HR 24 40
HE Čakovec HR 77.44 500 mHE Hrvatska HR 27.3 -
Table 5 lists all the renewable power plants such as windfarms and PV panels located in Croatia. Since these power plants operate only when the sun is shining or when the wind is blowing they are modelled as one single unit that represents aggregated power of all the RES units. Wind capacity in Croatia has been tripled in the period from 2010 to 2015 and it amounts to 418 MW. Solar PV has still not managed to surpass 50 MW of installed capacity. In order to model the RES output two EMHIRES databases where used. One estimates the power production for windfarms [25] and second one for PV [26] and is based on the 30 year satellite data.
Table 5 Technical data for the RES located in Croatia in the year 2015 [24]
Unit Zone
Nominal
power Unit Zone
Nominal power
MW MW
10
Figure 3 Installed power capacities by different fuel types in the WB region
Figure 3 represents the installed capacities of all the powerplants in the Western Balkans region. They are aggregated according to the fuel type that is used in different types of powerplants. It is obvious that the whole region has quite a lot of hydro potential as almost 50% of all the installed capacity comes from either HROR, HDAM or HPHS power plants. Rest of the installed capacity is mainly dominated by the lignite fired thermal units, and followed by natural gas fired CHP plants, one nuclear and one hard coal fired powerplants. Only RES are located in Croatia where only significant installed capacity is related to the wind farms. Figure 4 represents the total electricity demand in the region. Each colour represents zonal demands in each node. From here it is clear that the largest consumer is Serbia followed by Croatia and Bosnia and Hercegovina, Kosovo on the other hand is the smallest power consumer in region.
Figure 4 Aggregated electricity demand in the WB region
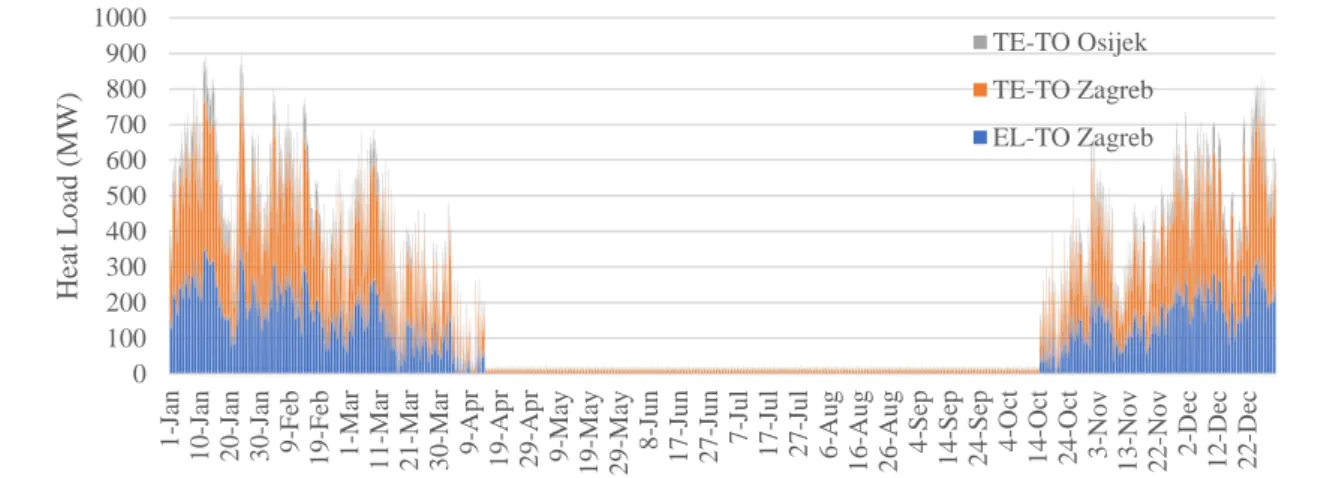
Figure 5 represents the heating demand in two Croatian cities, namely the capital city of Zagreb and a mid-sized city of Osijek. Both cities have a district heating system connected to the three
0 2,000 4,000 6,000 8,000 10,000 12,000 14,000 16,000 18,000 1 -J an 1 1 -J an 2 2 -J an 1 -F eb 1 2 -Feb 2 3 -Feb 5 -M ar 1 6 -Ma r 2 7 -Ma r 6 -A p r 1 7 -Ap r 2 7 -Ap r 8 -M ay 1 9 -Ma y 2 9 -Ma y 9 -J u n 2 0 -J u n 3 0 -J u n 1 1 -J u l 2 1 -J u l 1 -A u g 1 2 -Au g 2 2 -Au g 2 -S ep 1 3 -Sep 2 3 -Sep 4-O ct 1 4 -Oct 2 5 -O ct 5 -N o v 1 5 -No v 2 6 -No v 7 -D ec 1 7 -Dec 2 8 -Dec Do m esti c lo ad ( MW ) XK RS MK ME HR BA AL
11
powerplants: EL-TO Zagreb, TE-TO Zagreb and TE-TO Osijek. The local heating demand was modelled according to the modified degree hour method where seasonal and day night cycle characteristic have been taken into the account. Method has been described in more detail in following publication [27]. One can easily read that the highest heating demand is expected to occur during the months of December till February when the outside temperatures are the lowest. Total annual production of each of these units in year 2015 sums up to: 776.536 MWh in TE-TO Zagreb, 589.401 MWh in EL-TO Zagreb and 175.000 MWh in TE-TO Osijek [24].
Figure 5 Aggregated heat demand in all three cogeneration power plants in Croatia
REZULTS AND DISCUSSION
The results from the two analysed cases A and B represent “optimal” solutions of unit commitment and power dispatch problem driven by the input data available from the literature. One should note that these results may differ from real world data as it is extremely difficult to find operation characteristic of units and correct real world demand data without conducting any measurements. Thus this simulations represent a close approximation of the operation of the Western Balkans power system. Table 6 represents three key results such as simulation time, memory usage and calculated marginal price of electricity. They are the main topic of discussion in this work and will be analysed in more detail later on. Two less important indicators that are manly related to the stability of the power system are also presented. One can tell that the amount of curtailed power in traditional formulation of the problem is almost 10 times higher than in clustered formulation. At first this may suggest that clustering of units can have relatively high impact the stability of the system. On the other hand, curtailing power from renewable energy sources doesn’t necessary mean that the system is in danger of collapse. On the contrary power curtailment is one of the flexibility options of the power system and when kept inside certain margin it may not impact the final price at all. In our case curtailed power amounts to 0.57 % of total renewable power in Case A and 0.08 % in Case B. Load shedding on the other hand is another stability measure where big consumers are disconnected from the grid for certain amount of time. The amount of available load shedding depends from country to country but in our case, it was set to be 5% of the peaking demand. Results have shown that there is a significant amount of load shedding necessary to cover the current configuration of the system. This is mainly caused by the fact that some of the hourly cross border flows between the neighbouring countries such as Italy, Hungary, Bulgaria, Romani and Greece have been modelled as a random sum where the sum of all the numbers in a series should equal to some number. This caused high and unrealistic noise of the imported electricity and could be improved upon in future work. Nevertheless, the difference between the traditional and clustered configuration is significant and differs by a factor of three. If we compare our results to the total available annual amount of load shedding than in Case A it amounts to 4,19 % and 12,8 % in Case B. 0 100 200 300 400 500 600 700 800 900 1000 1 -J an 1 0 -Ja n 2 0 -Ja n 3 0 -Ja n 9 -F eb 1 9 -F eb 1 -M ar 1 1 -M ar 2 1 -M ar 3 0 -M ar 9 -A p r 1 9 -Ap r 2 9 -Ap r 9 -M ay 1 9 -M ay 2 9 -M ay 8 -J u n 1 7 -Ju n 2 7 -Ju n 7 -J u l 1 7 -Ju l 2 7 -Ju l 6 -A u g 1 6 -Au g 2 6 -Au g 4 -Sep 1 4 -S ep 2 4 -S ep 4 -O ct 1 4 -O ct 2 4 -Oc t 3 -N o v 1 3 -No v 2 2 -No v 2 -D ec 1 2 -De c 2 2 -De c Hea t L o ad ( MW ) TE-TO Osijek TE-TO Zagreb EL-TO Zagreb
12
Table 6 Technical comparison of the simulation results
Memory (MB) Time (hh:mm:ss) Load shedding (GWh) Curtailment (GWh) Marginal price (€/MWh) Case A 2729 02:49:51 3.346 201 19.224 Case B 714 00:33:37 10.233 29 21.503 Deviation -73.84 % -80.21 % 305,82 % 85.57 % +11.85 %
The difference between cases A and B where different simulation approaches have been analysed show that the total deviation between them varies from 0 % points for RES production from the sun up to 57,02 % points for thermal production in Macedonia. This difference is quite significant but can be reasoned by the fact that the only neighbouring country with interconnection lines is Kosovo. If for an example all the power plants in Kosovo are clustered into a single unit that is on average more efficient and cheaper or more flexible than the cluster of units from Macedonia than there would be overproduction in Kosovo.
Table 7 represents the results of the simulations on zonal level. From there it is clear that most values are within 10 % margin except some exceptions. In Case A highest deviation from real life results can be seen in the power output from Croatian thermal power plants. This is mainly due to the fact that most of the thermal power plants are gas based and when compared to the production costs from other unit types are quite expensive. It is extremely difficult to replicate real life production as many factors would have to be taken in to the account. These results show that if the assumption that the input data is indeed correct is true than the regions power system is run sub optimally from the perspective of marginal cost of electricity. In real life many factors determine which unit will be in operation and will dispatch power into the network. In ideal case the whole dispatch would be driven by a single day ahead or intraday market. The authors assume that in that case optimal dispatch would be somewhat different and closer to the obtained results. The difference between cases A and B where different simulation approaches have been analysed show that the total deviation between them varies from 0 % points for RES production from the sun up to 57,02 % points for thermal production in Macedonia. This difference is quite significant but can be reasoned by the fact that the only neighbouring country with interconnection lines is Kosovo. If for an example all the power plants in Kosovo are clustered into a single unit that is on average more efficient and cheaper or more flexible than the cluster of units from Macedonia than there would be overproduction in Kosovo.
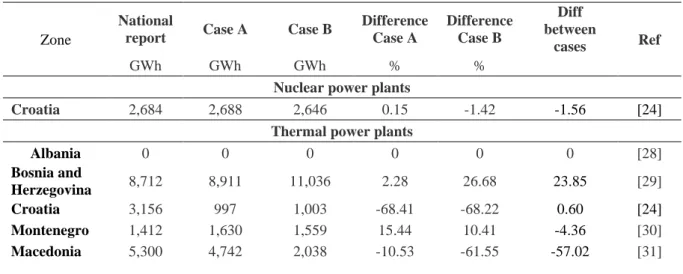
Table 7 Results obtained from the simulations
Zone
National
report Case A Case B
Difference Case A Difference Case B Diff between cases Ref GWh GWh GWh % %
Nuclear power plants
Croatia 2,684 2,688 2,646 0.15 -1.42 -1.56 [24]
Thermal power plants
Albania 0 0 0 0 0 0 [28] Bosnia and Herzegovina 8,712 8,911 11,036 2.28 26.68 23.85 [29] Croatia 3,156 997 1,003 -68.41 -68.22 0.60 [24] Montenegro 1,412 1,630 1,559 15.44 10.41 -4.36 [30] Macedonia 5,300 4,742 2,038 -10.53 -61.55 -57.02 [31]
13 Serbia 20,017 21,005 21,072 4.94 5.27 0.32 [32] Kosovo 5,350 4,769 5,782 -10.86 8.07 21.24 [33] Hydropower plants Albania 5,885 6,202 5,884 5.39 -0.02 -5.13 [28] Bosnia and Herzegovina 5,425 6,248 6,047 15.17 11.47 -3.22 [29] Croatia 5672 7,845 7,984 38.31 40.76 1.77 [24] Montenegro 1,460 1,543 1,542 5.68 5.62 -0.06 [30] Macedonia 1,165 1,768 1,754 51.76 50.56 -0.79 [31] Serbia 10,599 11,237 11,377 6.02 7.34 1.25 [32] Kosovo 147 142 142 -3.40 -3.40 0.00 [33] RES Production Croatia Wind 796 735 730 -7.66 -7.66 -0.68 [24] Croatia Sun 57 13 13 -77.19 -77.19 0.00 [24] Total production Albania 5,885 6,202 5,884 5.39 -0.02 -5.13 [28] Bosnia and Herzegovina 14.407 15,160 17,083 5.23 18.57 12.68 [29] Croatia 11,514 11,532 12,377 0.16 7.50 7.33 [24] Montenegro 2,872 3,128 3,101 8.91 7.97 -0.86 [30] Macedonia 6,564 6,510 3,792 -0.82 -42.23 -41.75 [31] Serbia 30,661 32,242 32,449 5.16 5.83 0.64 [32] Kosovo 5,550 4,911 5,924 -11.51 6.74 20.63 [33] Total 77,453 79,685 80,610
Figure 6 represents local annual generation in each zone sorted according to the fuel type. It is clear that the production in the whole region is dominated by the lignite and hydro power, which is then followed by nuclear, wind, hard coal and gas. Green bars highlight the net imports from neighbouring countries or countries that are not taking part in the simulation. It is interesting to see how different simulation approaches can result in different fuel mixes in each zone. In this case study Macedonia is regarded as a bottle neck due to the lack of interconnection capacities with other countries from the simulated region. This could be fixed if Bulgaria or Greece are included in the simulations. Authors are considering those countries for future analysis.
14
Figure 6 fuel mixes in Case A (top) and Case B (bottom)
Figure 7 and Figure 8 represent power dispatch curves in Croatia for two-week periods in January and July. First thing to note is the different dispatch in both cases. In Case A HROR units are simulated individually and thus the demand curve is sharper with a lot of peaks and valleys. Croatia also has a lot of importations from neighbouring countries which amount to more than 35 % annually. It is interesting to see how nuclear powerplant does not act as a base
15
load unit and its power output varies greatly during the day/night cycle. In Case A hard coal powerplant is in operation for couple of days while in Case B it doesn’t operate at all. The dotted line represents reservoir level of all hydro dams. Clustering of such units into a single one with a huge accumulation reservoir also greatly impacts the hydro output leading to quite a lot of curtailment during the night time. During the month of July, one can see how clustering approach overestimates the need for pumped hydro in the region. Nevertheless, both approaches are capable of covering the initial demand of the region.
Figure 7 Power dispatch in Croatia from 1st of January till the 14th of January for Case A (top) and Case B (bottom)
16
Figure 8 Power dispatch in Croatia from 1st of June till the 14th of June for Case A (top) and Case B (bottom)
CONCLUSION
This article describes the implementation of the Dispa-SET model to the six non-EU countries from the Western Balkans: Albania, Bosnia and Herzegovina, Kosovo, Macedonia, Montenegro and Serbia and one EU member state: Croatia. This implementation of the Dispa-SET can be freely downloaded1 and is released with an open-source license to ensure transparency and reproducibility of the work [34].
Each of these six countries has its own power generating units, independent domestic electricity demands and is interconnected with the neighbouring countries through 210 and 400 kV transmission lines. The most difficult and time-consuming part of implementing such a model is the data gathering. This includes the analysis of historical fuel prices, individual power plant
17
data, planned and unplanned outages due to the power plant overhauls, river hydrology and weather data, historical cross border energy flows and accumulation levels of all the available storage units. All this data has been statistically and mathematically processed and converted into the formats accessible by the model. The simulation process has been carried out simultaneously for the whole region.
In total two different case studies with two different modelling approaches, MILP and MILP Clustering, have been carried out. These results have been compared with the real-world data and on average the total power generation in each zone and by each technology is within 15 % of the real-world data. The only exception are two neighbouring zones Kosovo and Macedonia where the deviation is between 15 and 65 % and Croatia where the deviation from original results is in range from 30 to 60 %. Comparison of the two different modelling approaches was the main motivation behind this research. It has been show that the clustering approach applied in the Case B can significantly impact the computation time reducing it by more than 80 %, from initial 02:49:51 hours down to 00:33.37 hours. This is significant finding since the marginal price of electricity in both cases did not warry for more than 12 %. Traditional unit commitment and power dispatch approach calculated the price of 19.22 €/MWh while the clustered approach calculated the price of 21.50 €/MWh. More detailed analysis has confirmed that clustering approach can result in higher load shedding by a factor of three but to prove that this is always the case additional analysis with different input and weather data should be carried out.
The future work should be related to the expansion of the current region on neighbouring countries such as Romania, Bulgaria, Greece and Slovenia. The main goal behind this would be a more accurate description of the energy flows in the region. Moreover, it could be interesting to check how stochastic weather forecasts could affect the future scenarios.
Acknowledgement
Financial support from the European Commission’s Joint Research Centre, SEE Energy Transition Dialogue – EUKI project, as well as the RESFLEX project, funded by the Environmental Protection and Energy Efficiency Fund with the support of the Croatian Science Foundation is gratefully acknowledged.
REFERENCES
[1] IPCC. Summary for Policymakers. Clim Chang 2014 Impacts, Adapt Vulnerability - Contrib Work Gr II to Fifth Assess Rep 2014:1–32. doi:10.1016/j.renene.2009.11.012. [2] de Bruin K, Dellink RB, Ruijs A, Bolwidt L, van Buuren A, Graveland J, et al. Adapting
to climate change in The Netherlands: an inventory of climate adaptation options and ranking of alternatives. Clim Change 2009;95:23–45. doi:10.1007/s10584-009-9576-4. [3] Dewulf A. Contrasting frames in policy debates on climate change adaptation. Wiley
Interdiscip Rev Clim Chang 2013;4:321–30. doi:10.1002/wcc.227.
[4] VijayaVenkataRaman S, Iniyan S, Goic R. A review of climate change, mitigation and adaptation. Renew Sustain Energy Rev 2012;16:878–97. doi:10.1016/j.rser.2011.09.009.
[5] European Commission. A Framework Strategy for a Resilient Energy Union with a
Forward-Looking Climate Change Policy 2015:1–21.
doi:10.1017/CBO9781107415324.004.
[6] European Commission. Energy climate policy framework EU 2020-2030 2014:1–8. [7] European Commission. Roadmap for moving to a low-carbon economy in 2050. DG
18
[8] European Commission. Western Balkans Enlargement: Common Destination. 2017. [9] Ratra S, Tiwari R, Niazi KR. Voltage stability assessment in power systems using line
voltage stability index. Comput Electr Eng 2018;0:1–13. doi:10.1016/j.compeleceng.2017.12.046.
[10] El-Sobky B, Abo-Elnaga Y. Multi-objective optimal load flow problem with interior-point trust-region strategy. Electr Power Syst Res 2017;148:127–35. doi:10.1016/j.epsr.2017.03.014.
[11] Nemati M, Braun M, Tenbohlen S. Optimization of unit commitment and economic dispatch in microgrids based on genetic algorithm and mixed integer linear programming. Appl Energy 2018;210:944–63. doi:10.1016/j.apenergy.2017.07.007. [12] Jiménez-Navarro JP, Kavvadias KC, Quoilin S, Zucker A. The joint effect of centralised
cogeneration plants and thermal storage on the efficiency and cost of the power system. Energy 2018. doi:10.1016/j.energy.2018.02.025.
[13] Nakamura M, Kumarawadu P, Yoshida A, Hatazaki H. Reliable Maintenance Scheduling of Pumps in Existing Thermal Power Stations. IFAC Proc Vol 1997;30:165– 8. doi:10.1016/S1474-6670(17)42249-X.
[14] Fernández-Blanco R, Kavvadias K, Hidalgo González I. Quantifying the water-power linkage on hydrothermal power systems: A Greek case study. Appl Energy 2017;203:240–53. doi:10.1016/j.apenergy.2017.06.013.
[15] Higuita Cano M, Agbossou K, Kelouwani S, Dubé Y. Experimental evaluation of a power management system for a hybrid renewable energy system with hydrogen production. Renew Energy 2017;113:1086–98. doi:10.1016/j.renene.2017.06.066. [16] Heuberger CF, Rubin ES, Staffell I, Shah N, Mac Dowell N. Power capacity expansion
planning considering endogenous technology cost learning. Appl Energy 2017;204:831– 45. doi:10.1016/j.apenergy.2017.07.075.
[17] Min D, Ryu J, Choi DG. A long-term capacity expansion planning model for an electric power system integrating large-size renewable energy technologies. Comput Oper Res 2017. doi:10.1016/j.cor.2017.10.006.
[18] Pavičević M, Tomić I, Quoilin S, Zucker A, Krajačić G, Pukšec T, et al. Applying the Dispa-SET Model on the Western Balkans Power Systems. In: Ban M, Duić N, Schneider DR, editors. 12th Conf. Sustain. Dev. Energy, Water Environ. Syst., Dubrovnik: University of Zagreb; 2017, p. 53.
[19] Bell IH, Quoilin S, Georges E, Braun JE, Groll EA, WT Horton WT, Lemort V. A generalized moving-boundary algorithm to predict the heat transfer rate of counterflow heat exchangers for any phase configuration. Applied Thermal Engineering 2015; 79, 192-201.
[20] Palmintier B. Incorporating Operational Flexibility into Electric Generation Planning - Impacts and Methods for System Design and policy Analysis. Massachusetts Institute of Technology, 2012.
[21] Quoilin S, Hidalgo Gonzalez I, Zucker A. Modelling Future EU Power Systems Under High Shares of Renewables: The Dispa-SET 2.1 open-source model. 2017. doi:10.2760/25400.
[22] Hentschel J, Babić U, Spliethoff H. A parametric approach for the valuation of power plant flexibility options. Energy Reports 2016;2:40–7. doi:10.1016/j.egyr.2016.03.002. [23] Schill W-P, Pahle M, Gambardella C. On Start-Up Costs of Thermal Power Plants in
Markets with Increasing Shares of Fluctuating Renewables. DIW Discuss Pap 2016;1540:24.
[24] EIHP. Annual Energy Report Energy in Croatia 2015. Zagreb: 2016.
[25] Gonzalez Aparicio I, Zucker A, Careri F, Monforti F, Huld T, Badger J. EMHIRES dataset: Wind power generation. European Meteorological derived HIgh resolution RES
19
generation time series for present and future scenarios. 2016. doi:10.2790/831549. [26] Gonzalez Aparicio I, Huld T, Careri F, Monforti F, Zucker A. EMHIRES dataset Part
II : Solar power generation. 2017. doi:10.2760/044693.
[27] Pavičević M, Novosel T, Pukšec T, Duić N. Hourly optimization and sizing of district heating systems considering building refurbishment – Case study for the city of Zagreb. Energy 2017;137:1264–76. doi:10.1016/j.energy.2017.06.105.
[28] Manuser Jonno Foundation. Albania - Annual Report 2015. Albania; 2015. [29] Osnovni EES Pokazatelji BiH 2015. 2016.
[30] The government of Montenegro. Energy balance of Montenegro for 2017 (in Montenegrian) 2017.
[31] The governemnet of Macedonia. Godisen izvestaj za rabota na Regulatornata komisija za energetika na RM za 2015 godina. 2016.
[32] Republic of Serbia. Republic of Serbia Security of Supply Statement 2015. n.d.
[33] Energy Regulatory Office. Statement of Security of Supply for Kosovo ( Electricity , Natural Gas and Oil ) 2015:39.
[34] Pfenninger S, DeCarolis J, Hirth L, Quoilin S, Staffell I. The importance of open data and software: Is energy research lagging behind? Energy Policy 2017;101:211–5. doi:10.1016/j.enpol.2016.11.046.
![Figure 2 Graphical representation of different MILP clustering options built in the DispaSET tool [21]](https://thumb-eu.123doks.com/thumbv2/123doknet/6279316.164107/6.892.127.710.836.1061/figure-graphical-representation-different-milp-clustering-options-dispaset.webp)