deposits of superparamagnetic colloids
(Dated: September 17, 2019)Evaporation of sessile colloidal droplets is a way to organize suspended particles. It is already known that the composition of the surrounding fluid modifies the dried deposit. For superpara-magnetic particles, recent studies showed that external superpara-magnetic fields can act as remote controls for those deposits. In this paper, we study the configuration space given by the interplay of such fields and a modification of the fluid composition by considering various concentrations of phos-phate buffered saline (PBS). We show that the magnetic field modifies the morphological properties of the deposit, while the composition (i.e. PBS concentration) modifies the density profile of the deposit. We then present an explanation of these influences considering the competition between (i) sedimentation, (ii) coffee-ring and (iii) Marangoni flows. From these considerations, we propose a master curve which should be able to model the deposit densities of any system where the above mechanisms compete with each other.
I. INTRODUCTION
The evaporation of colloidal droplets has attracted a lot of attention from scientists during the last decades. This process indeed presents various applications, rang-ing from inkjet printrang-ing, paint and polymers [1] via nan-otechnology [2], up to blood analysis [3, 4]. One of the most abundant phenomena in evaporating droplets of colloids is the so-called ”coffee-ring” effect [5–7]. This nickname emphasizes the fact that particles tend to mi-grate to the edge of an evaporating droplet, leading to a ring-like deposit, which is typically observed in every-day coffee stains. The first model of this phenomenon is usually attributed to Deegan et al. [8, 9]. However, vari-ous other phenomena can occur in an evaporating droplet and modify its eventual deposit. Notably, the presence of surface-adsorbed polymers or surfactants [10, 11] or cap-illary interactions of ellipsoidal particles [12, 13] allow a uniform coating of the particles. Temperature gradients, tensio-active agents or binary mixtures can also create surface tension gradient producing Marangoni flows [14– 19]. Those flows also strongly modify the deposits’ pat-tern, in various ways [10, 20–22]. More recently, more complex deposit structures from various concentration of liquid crystals have been reported in the literature [23]. Droplets containing magnetisable particles have also attracted attention due to additional easily controllable magnetic properties [24–26]. Regarding micron-sized su-perparamagnetic colloids, magnetic interactions between particles can be used to control the properties of colloidal droplets’ deposits [27].
Superparamagnetic colloids are composite particles, combining a quasi-zero remanent magnetization and a high magnetic response [28–30]. They are made of a matrix of non-magnetic material (polystyrene or silica), with an external diameter d ranging from 100nm to a few micrometers. This matrix contains inserted mag-netic nanoparticles, which are magmag-netic monodomains, ensuring the paramagnetic behaviour of the whole par-ticles. This kind of particles, if they are immersed in a constant and homogeneous magnetic field, forms chains aligned with the field [28, 31–38]. This technique is used for many applications such as bacteria processing, cell
separation, chromatography, protein isolation, waste cap-ture, etc [28, 31, 39–47]. Superparamagnetic colloids are also well-known for the more complex structures they form under more complex fields, potentially leading to microbots [33, 34, 48–56]. Those controllable assemblies open ways to new kinds of applications thanks to their unique optical properties and versatility to execute vari-ous tasks [50, 51, 54, 57]. In the context of evaporating droplets, it has been shown recently that these assem-blies, in the case of micron-sized particles, could be de-posited in the dried deposit [27]. However, it has been highlighted that such a deposition requires the right con-centration of PBS, and that this latter parameter also has an impact on the dried deposit [17].
In this paper, we focus on how those two parameters, initial PBS concentration and external magnetic field, in-teract with each other. We describe the evolution of the various deposits resulting from their combination, in the case of micron-sized particles. We show that these pa-rameters influence the competition between three mech-anisms : (i) sedimentation, (ii) coffee-ring effect and (iii) Marangoni instabilities. While such competition between three mechanisms has already been observed previously [58], it is the first time that the resulting features are all observed at the same time in the same deposit. Bhardwaj et al. indeed described such a diagram were Marangoni recirculation, sedimentation and coffee ring flow com-pete with each other, but their actual measurements only stood on the 0-axis of their diagram, comparing only two mechanisms at a time. This work describes the evolu-tion of their interplay through combined variaevolu-tions of two control parameters, namely external magnetic fields and initial PBS concentration, describing the associated configuration space.
It is worth noticing that magnetostatic convection has previously been observed in magnetic suspensions, and could prevent coffee-ring formation [26]. However, this requires a ferromagnetic liquid with a magnetic field per-pendicular to the substrate. In our case, the magnetic field is parallel to the substrate, and the micrometric size of our particles makes that the magnetic properties of the fluid cannot be considered as continuous. Such magne-tostatic convection is then not observed in our case.
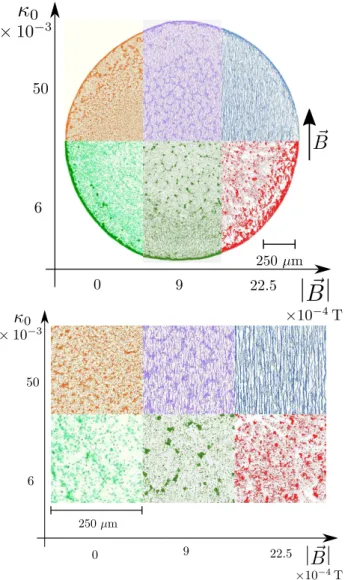
FIG. 1. Details of deposits obtained with different magnetic fields and various PBS concentration (defined by the initial volume fraction κ0, see main text). Each picture has been nu-merically colourized according to the corresponding field and PBS condition, as indicated by the axes. The bottom picture is a zoom on details near the centres of the deposits. Both global surface density of the particles and the morphological details of the deposits vary from one deposit to the other.
II. METHODS
A. Suspensions preparation
We prepared samples of water-dispersed superparam-agnetic microspheres (Estapor R M1-070/60, mean
diam-eter d ≈ 10−6, and magnetic susceptibility χ ≈ 0.1 in SI units [59]), with a volume fraction of φ = 5 10−4. The pu-rity of the dispersing liquid is ensured by centrifugating the commercial suspensions, then removing the super-natant and replacing it with the appropriate solution, i.e. diluted phosphate buffered saline (PBS). An ultrasonic probe is then used to disperse again the particles in the liquid phase. More details on the preparation protocol
can be found in Ref. [27]. The M1-070/60 particles are covered with carboxyl groups (-COOH), which induces a negative surface charge due to ionization (−COO−) at pH 6.5 and higher. The PBS fixes the pH around 7.4 and thus ensures electrostatic repulsion between the surfaces of the particles. Observations with optical microscopy ensures that the initial suspensions are stable on a time-scale corresponding to the evaporation time.
B. Microscopy observations
An experiment consists of dropping a 2 µl droplet of the suspension on a microscope cover glass. A home-made airtight evaporation chamber is placed upon it. The chamber’s base is airtight thanks to the application of petroleum jelly between the plexiglass and the cover glass. A constant current is sent in two surrounding coils to apply a magnetic field ~B on the sample. The suspen-sion is observed with an inverted microscope and a 16x magnification. The microscopy set-up used in this paper is the same as the one described for our previous work. See Ref. [27] for more details.
C. Reproducibility of the results
We prepared three different suspensions, each of them with various concentration of PBS but the same col-loidal volume fraction of φ = 5 10−4. We express here the dimensionless PBS concentration κ0 as the ratio of PBS volume VP BS in the total volume of the suspen-sion Vtot (made of PBS, pure water and particles) : κ0 = VP BS/Vtot. We used the initial volume fractions κ0= 6 10−3, 10 10−3and 50 10−3. For each of these sus-pensions, we observed the evaporation under constant and homogeneous magnetic fields of intensity ranging from 0. 10−4T to 22.5 10−4T by steps of 4.5 10−4T. For each of the specific conditions, we observed at least 5 different droplets evaporation in order to assess the re-producibility of the results.
III. RESULTS
A. General description
Typical parts of final dried deposits are shown in Fig. 1, for the extremal conditions we tested. For low PBS concentration and no magnetic field, a clear coffee-ring effect is observed. Most of the particles are indeed de-posited at the edge of the deposit. Still without field but with the highest PBS concentration, a ring-shaped de-posit is observed again at the edge of the droplet, but sim-ilar surface fractions of particles are also observed in the centre of the deposit. This more homogeneous deposi-tion of particles is actually induced by solutal Marangoni flows, as described in a previous study [17]. However,
0.5 1 1.5 2 2.5 3 3.5 0 5 10 15 20 25 ρC /ρ m κ0=6.10 -3 κ0=10.10 -3 κ0=50.10 -3 0 0.2 0.4 0.6 0.8 1 1.2 1.4 0 0.2 0.4 0.6 0.8 1 ρ /N r/R 0 0.2 0.4 0.6 0.8 1 1.2 1.4 1.6 1.8 2 0 0.2 0.4 0.6 0.8 1 ρ /N r/R 0 0.2 0.4 0.6 0.8 1 1.2 1.4 1.6 1.8 0 0.2 0.4 0.6 0.8 1 ρ /N r/R
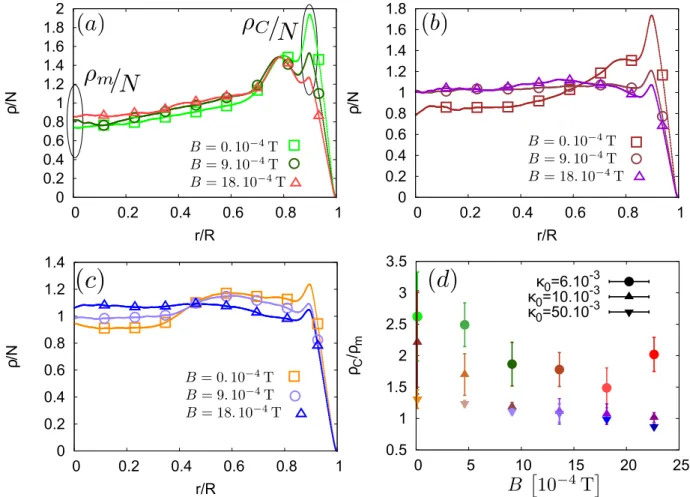
FIG. 2. Evolution of the mean surface density of the dried agglomerates normalized by the number of particles (so that the integral of the curve is equal to one), for the various PBS concentration (Initial volume fractions κ0 : (a) 6. 10−3, (b) 10. 10−3, (c) 50. 10−3). Both curves and dots are experimental data, the dots are there to distinguish the various curves in black and white impressions. For the coloured version, those are given accordingly to the colours in Fig. 1. The relative amplitudes of the coffee rings are summarized in (d) thanks to the ratio between the coffee ring density ρc (value of the curves at the local maximum nearest from the drop’s border) and the density in the centre of the drop ρm. For high PBS concentration and high magnetic field, this ratio drops below one, indicating that the coffee ring effect is mainly countered. The deposit is then almost uniform. The values of ρC and ρmused to obtain (d) are highlighted in (a) for the case of κ0= 6. 10−3.
when a magnetic field of intensity B = 22.5 10−4T is applied on the evaporating drop, the final deposits are radically different. For low concentration of PBS, the outer ring in the deposit is then strongly reduced and the deposit is characterized by a region near the edge where chains of particles aligned with the field are ob-served. Interestingly, the length of these chains varies with the magnetic field intensity, but does not depend significantly on the angular position in the deposit. For high PBS concentration, the coffee-ring trend in the de-posit is reduced as well but chains can be found even in the centre of the deposit, as already described in a previous publication [27].
B. Density profiles
1. Definition
A more quantitative analysis of the deposits can be performed by computing the mean surface density ρ of the particles in the deposit. We computed this quantity as a function of the relative distance from the centre r of the deposit, normalized by the radius R of the deposit. We then normalized it by its integral N = R1
0 ρ(δ)dδ, where δ = Rr. This normalization enhances the relative variation values and ensures that no difference in light-ening are taken into account. Resulting curves are pre-sented in Fig. 2. Those curves also enable to compute the ratio between the surface fraction in the middle of the drop ρ(0) ≡ ρm and the surface fraction of the particles in the coffee-ring ρC. This ratio ρρC
m has been previously
0 0.2 0.4 0.6 0.8 1 1.2 1.4 1.6 1.8 2 0 0.2 0.4 0.6 0.8 1 ρ /N r/R κ0=6.10 -3 B=0. κ0=10.10 -3 B=4.5 κ0=50.10 -3 B=18. 0.01 0.02 0.03 0.04 0.05 0 5 10 15 20 25 Co κ0=6.10 -3 κ0=10.10 -3 κ0=50.10 -3 0.70 0.75 0.80 0.85 0.90 0.95 1.00 0 5 10 15 20 25 C κ0=6.10 -3 κ0=10.10 -3 κ0=50.10 -3 0.00 0.05 0.10 0.15 0.20 0 5 10 15 20 25 Ma κ0=6.10 -3 κ0=10.10 -3 κ0=50.10 -3
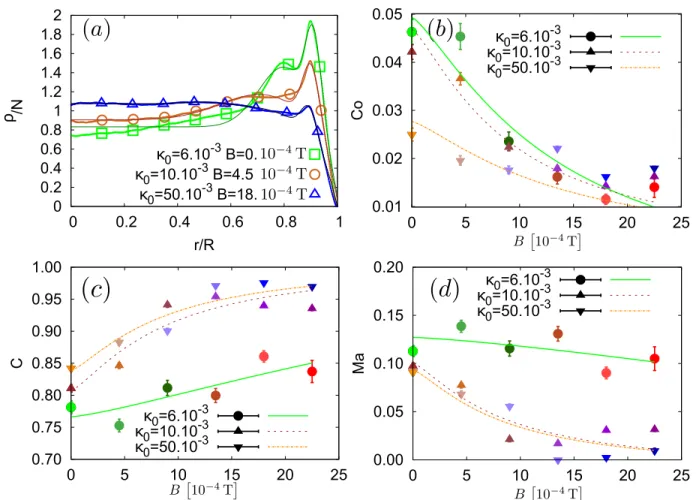
FIG. 3. Properties of the fitted mean surface density of the agglomerates. (a) Examples of fitted profiles : the thin curves are the fits of the thick ones, which are actually a superposition of measured points (containing larger points to distinguish them in black and white). For the coloured version, those are given accordingly to the colours in Fig. 1. The highest peak is characteristic from the lowest initial PBS concentration κ0 = 6. 10−3 while the lowest peak is on the curve with the highest concentration κ0 = 50. 10−3. The graphs (b),(c),(d) respectively show the evolution of the fit paramaters Co, C and M a. The Co parameter is the amplitude of the coffee-ring peak, C is the amplitude of the homogeneous background and M a is the amplitude of the Marangoni eddy. The lines are the trends predicted by our dimensional analysis (see main text, Eqs. (8) to (13)).
of this ratio is summarized in Fig.2d. It is interesting to notice that, for high PBS concentration and high mag-netic field, the ratio drops below 1, implying that the coffee ring is not the main phenomenon in this case.
2. Detailed density features
Actually, one can identify three features on our even-tual density profiles, each depending on different compet-ing mechanisms. Such competition between three mecha-nisms has already been observed previously [58], but it is the first time that the resulting features are all observed at the same time in the same deposit. Bhardwaj et al. indeed described such a diagram were Marangoni recircu-lation, sedimentation and coffee ring flow compete with each other, but their actual measurements only stood on the 0-axis of their diagram, comparing only two mecha-nisms at a time.
In our case, the first feature is the background of ho-mogeneous density. This is induced by both sedimen-tation of the particles (enhanced by the DLVO interac-tion between particles and the substrate [58] and the self-assembly of the particles [27]) and Marangoni instability (induced by transitional Marangoni bulk instability due to PBS [17]). It is worthwhile to notice there is a differ-ence between Marangoni instability, creating several re-circulation cells on a single radius length of the droplet, and Marangoni recirculation, creating a single recircula-tion cell on one radius length of the droplet. The latter tends to produce a peak of density at the centre of the droplet [14, 20, 58] while the former produces a more ho-mogeneous deposit, patterned with the border of the cells [17, 21, 27]. This feature creates a density profile which
2 4 6 8 10 12 14 16 18 20 22 24 0 5 10 15 20 25 <L> κ0=6.10 -3 B [10-4 T] κ0=10.10 -3 κ0=50.10 -3 0 5 10 15 20 25 30 35 40 45 50 0 0.2 0.4 0.6 0.8 1 L r/R 0 5 10 15 20 25 30 35 40 45 50 0 0.2 0.4 0.6 0.8 1 L r/R 0 5 10 15 20 25 30 35 40 45 0 0.2 0.4 0.6 0.8 1 L r/R
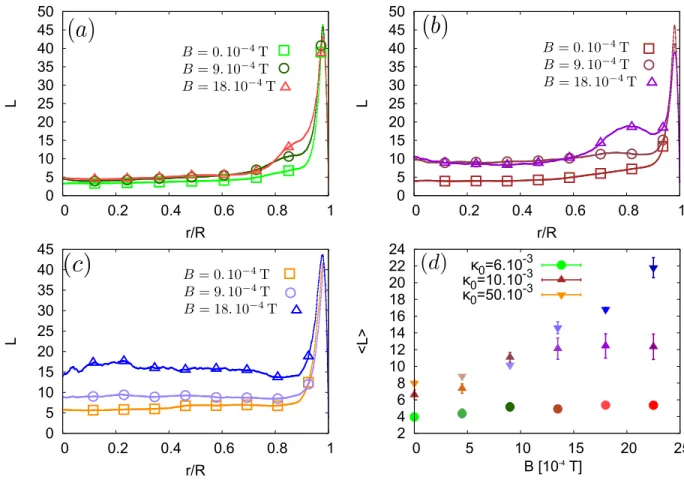
FIG. 4. Evolution of the mean major-axis length of the dried agglomerates (in particle’s diameter), for the various PBS concentration (Initial volume fractions κ0 : (a) 6. 10−3, (b) 10. 10−3, (c) 50. 10−3). The mean value of the major-axis length as a function of the magnetic field amplitude is summarized in the graph (d). For the coloured version, those are given accordingly to the colours in Fig. 1. The larger points are there to distinguish the curves in black and white version.
can be modelled as ρ/N = (1 − eK(r/R−1))/ Z 1 0 (1 − eK(δ−1))dδ = K(1 − eK(r/R−1))/(K − 1 + e−K), (1)
where K > 0 is a parameter describing the smoothness of the edge, and δ = r/R.
The second feature is the coffee-ring effect, created by the mass-conservative flow inside the droplet [6–9, 60]. This feature creates a peak of density in the eventual deposit near the edge of the droplet, that we modelled by a normal distribution
ρ/N = e−(r/R−mCo)2/(2σ2Co)/(
√
2πσCo), (2) where mCois the position of the centre of this outer peak and σCo is the standard deviation associated with this distribution.
The third feature is the so-called Marangoni eddies [22]. Those eddies are due to interactions between Marangoni recirculation at the edge of the deposit and the coffee-ring deposit. Indeed, the recirculation near the deposited coffee-ring tends to redistribute the particles slightly closer to the centre of the droplet, which creates
a secondary peak of density on a lower r/R coordinate. Such secondary peak can clearly be seen on Fig. 2(a). We modelled this peak with another normal distribution
ρ/N = e−(r/R−mM a)2/(2σM a2 )/(
√
2πσM a), (3)
where mM ais the position of the centre of this outer peak and σM a is its standard deviation.
We used Gaussians to model Marangoni and coffee-ring contributions since the sum of independent random vari-ables tend to Gaussian distribution (it is the so-called central limit theorem). Regarding the coffee-ring ef-fect, even if the particles are pushed towards the edge of the droplet, their exact distance from the centre of the droplet in the deposit depends on the contact line’s profile, their interactions with previously deposited par-ticles, interactions with the substrate and the air-liquid interface,... we then assumed as a first approach that all these tiny contributions would add up to lead to a distri-bution close to a Gaussian curve. An analogous reasoning can be performed for the contribution of the Marangoni eddy.
The final density profile can then be modelled as ρ N =CK 1 − eK(r/R−1) −1 + e−K +√Co 2πσCo e−(r/R−mCo)2/(2σCo2 ) +√M a 2πσM a e−(r/R−mM a)2/(2σM a2 ), (4)
where C, Co, M a ∈ [0, 1], (with C + Co + M a = 1 to respect the normalization of ρ/N ) are parameters de-scribing the relative importance of each feature. Result-ing fits and evolution of the fitted amplitude parameters C, Co, M a are shown in Fig.3 The trends of these curves are discussed in the Section IV A, on the basis of the com-petition between Marangoni instability, coffee-ring effect and sedimentation.
C. Morphological properties
In our experiment, the magnetic field also changes mor-phological properties of the deposit. More accurately, the chains formed by the particles during the evaporation process remain partly in the deposit. This morphological change can be assessed by the computing the local major-axis length L of the disjoint parts of final deposits. Those measurements are represented in Fig. 4. The main peak near the edge of the drop is actually caused by the coffee ring, which is locally seen as a very long agglomerate of particles. However, for low PBS concentrations (6 10−3 and 10 10−3 volume fraction), chains can also appear in a region close to this edge. The length of those chains becomes longer as the magnetic field increases. How-ever, the width of the region where they are observed does not depend on this magnetic field. For the highest PBS concentration, 50. 10−3 volume fraction, the chains are observed everywhere in the final deposit. The mean length of the chains increases with the amplitude of the magnetic field, as discussed in a previous work [27].
IV. DISCUSSION
A. Evolution of the density profile parameters
To understand the evolution of the different amplitudes C,Co and M a from Eq. (4), it is useful to compare the characteristic speed of each mechanism occuring in our system. Those speeds are the typical speeds for coffee-ring effect vCR, Marangoni recirculation vM a and sedi-mentation speed vS. Indeed, one can assume
Co ∝ (vCR− vS− vM g)/(Co + C + M a), (5) C ∝ (vS+ vM g− vCR)/(Co + C + M a) (6) and M a ∝ (vM g− vS− vCR)/(Co + C + M a), (7)
These hypotheses comes from the fact that if the sedi-mentation makes the particles stick to the substrate, the fluid will not be able to move them at its own veloc-ity, but will have to act against the sedimentation forces through a drag force. Moreover, the Marangoni speed and the coffee-ring speed simply add up to determine the actual flow in the droplet.[20] Then the effective speed for coffee-ring construction vef f,Co verifies D vef f,Co = D (vCR− vM g) − D vS ⇔ vef f,Co = vCR − vM g − vS. The same reasoning holds for the Marangoni eddy con-struction vef f,Ma= vM g− vCR− vS.
The magnitude order and dependencies of the typical speeds for coffee-ring effect vCR, Marangoni recircula-tion vM a and sedimentation speed vS are detailed in the Supplementary Materials, Section II of this paper. It is worth noticing that there is a transition in the sedi-mentation speed when κ0∼ 10−2. Indeed, at such PBS concentration, the DLVO interaction between particles and the substrate becomes attractive. For the low PBS concentration κ0= 6. 10−3, one can then evaluate vCR ∼ 10−6 m/s << vS ∼ 10−5 m/s << vMg ∼ 10−4 m/s while, for higher PBS concentrations κ0 = 10. 10−3 and κ0 = 50. 10−3, one has vCR ∼ 10−6 m/s << vMg ∼ 10−3 m/s << vS ∼ 10−2 m/s. Furthermore, one can determine the dominating terms depending on B and κ0 in the equations (5),(6) and (7). For κ0 = 10. 10−3 and κ0= 10. 10−3, one obtains the scalings
Co ∝ α1+ α2B 1.3+ α 3κ0 α4+ α5B1.3+ α6κ0 (8) C ∝β1+ β2B 1.3+ β 3κ0 β4+ β5B1.3+ β6κ0 (9) and M a ∝ ζ1+ ζ2B 1.3+ ζ 3κ0 ζ4+ ζ5B1.3+ ζ6κ0 (10)
where αi, βi, ζi > 0 are fitting parameters. One also ex-pects α1 ∼ α210−5 ∼ α4∼ α510−5, and alike for the β and ζ. Indeed, those various terms come from the same characteristic sedimentation speed vS. For the PBS con-centration κ0= 6. 10−3, since Fe> FVdW , the dominat-ing term in κ0 goes like
√
κ0. We can then consider the evolution of C,Co and M a separately for this concentra-tion. The parameters then scale like
Co ∝ α 0 1+ α02B1.3 α0 4+ α05B1.3 (11) C ∝β 0 1+ β20B1.3 β40 + β50B1.3 (12) and M a ∝ ζ 0 1+ ζ20B1.3 ζ0 4+ ζ50B1.3 (13)
Fits of the corresponding trends, respecting the afore-mentioned relations for the fitting coefficients αi, βi and ζi (and their prime version) are represented on Fig. 3.
B. Evolution of the morphological details
As we described elsewhere, for high volume PBS con-centration κ0 = 50. 10−3, the mean length of the chains varies as if the chains were self-organized as in an air-tight chamber of liquid and then abruptly stopped after a constant time te which can be assimilated to the evap-oration time of the droplet [27]. In other words, for this parameter, everything happens on average as if magnetic interaction dominated their assembly. This is explained by the fact that, for this value of κ0, the sedimentation, which depends on the magnetic self-assembly through its bulk speed, dominates the whole process for deposited particles (vCR ∼ 10−6 m/s << vMg ∼ 10−3 m/s << vS ∼ 10−2 m/s).
For low value of PBS κ0= 6. 10−3, the mean length of agglomerates in the deposit is mainly constant for every value of the magnetic field B. Actually, the only actual aggregates which remain in the eventual deposit are the ones created by the coffee ring and the Marangoni eddy. This is due to the fact that the coffee-ring speed diverges near the end of the evaporation process and is able to break all the chains, which are not sticking to the sub-strate, as we demonstrate in the Supplementary Materi-als, Section II (within DLVO interactions with the sub-strate, electrostatic repulsion counters the van der Waals attraction for κ0= 6 10−3).
The case of intermediate concentration κ0 = 10. 10−3 shows a mixed behaviour : for low magnetic fields, the mean length of agglomerates scales as for κ0= 50. 10−3, indicating that the magnetic assembly dominates for those short chains. However, for higher magnetic field, the mean length of agglomerates seem to saturate, as it does for κ0= 6. 10−3, but with a higher length. Having an intermediate behaviour might seem intuitive since we have a transition from chains broken by the coffee-ring flow to chains firmly sticking to the substrate. Moreover, the reason why short chains are able to stick on the sub-strate while long chains do not is probably related to the fact that long chains are easier to deform and break into smaller ones [61, 62].
V. CONCLUSION
From the previous observations, one might conclude that the amount of PBS, through both the strength of
the Marangoni recirculation [17] and the sedimentation of the particles on the substrate, is mainly responsible for the global distribution profile of the particles. More-over, this paper shows that the magnetic field mainly changes the morphological properties of the dried deposit with a lesser influence on the density profile. Previous experiments showed that the right strength of solutal-Marangoni instabilities allows the self-organized colloids to be deposited as is after evaporation [27]. This paper demonstrates that the influence of this instability is even richer, since it also determines where the chains will be deposited and show their length can also be limited by flow-driven phenomena.
A. Data availability
The datasets generated during and/or analyzed during the current study are available from the corresponding author on reasonable request.
ACKNOWLEDGEMENT
A.D. is financially supported by FNRS as research fel-low. This work was financially supported by the FNRS (Grant PDR T.0043.14) and by the University of Li`ege (Starting Grant C-13/88).
AUTHOR CONTRIBUTION
G.L. and A.D. designed the experiments. A.D. per-formed the experiments, analyzed the results and wrote the initial draft of the paper. N.V. and G.L. supervised the project, and all authors discussed the results and contributed to the final manuscript preparation.
ADDITIONAL INFORMATION
Competing interests : The authors declare no com-peting interests.
[1] Sefiane, K. Patterns from drying drops. Advances in colloid and interface science 206, 372–381 (2014). [2] Erbil, H. Y. Evaporation of pure liquid sessile and
spher-ical suspended drops: A review. Advances in colloid and interface science 170, 67–86 (2012).
[3] Brutin, D., Sobac, B., Loquet, B. & Sampol, J. Pattern formation in drying drops of blood. Journal of Fluid Mechanics 667, 85–95 (2011).
[4] Yakhno, T. A. et al. The informative-capacity phe-nomenon of drying drops. IEEE engineering in medicine and biology magazine 24, 96–104 (2005).
[5] Mampallil, D. & Eral, H. B. A review on suppression and utilization of the coffee-ring effect. Advances in colloid and interface science 252, 38–54 (2018).
[6] Mar´ın, A. G., Gelderblom, H., Lohse, D. & Snoei-jer, J. H. Order-to-disorder transition in
ring-shaped colloidal stains. Phys. Rev. Lett. 107, 085502 (2011). URL https://link.aps.org/doi/10.1103/ PhysRevLett.107.085502.
[7] Mar´ın, ´A. G., Gelderblom, H., Lohse, D. & Snoeijer, J. H. Rush-hour in evaporating coffee drops. Physics of fluids 23, 091111 (2011).
[8] Deegan, R. D., Bakajin, O., Dupont, T. F., Huber, G. et al. Capillary flow as the cause of ring stains from dried liquid drops. Nature 389, 827 (1997).
[9] Deegan, R. D. et al. Contact line deposits in an evapo-rating drop. Physical review E 62, 756 (2000).
[10] Kim, H. et al. Controlled uniform coating from the in-terplay of marangoni flows and surface-adsorbed macro-molecules. Physical review letters 116, 124501 (2016). [11] Anyfantakis, M., Geng, Z., Morel, M., Rudiuk, S. &
Baigl, D. Modulation of the coffee-ring effect in par-ticle/surfactant mixtures: the importance of particle– interface interactions. Langmuir 31, 4113–4120 (2015). [12] Yunker, P. J., Still, T., Lohr, M. A. & Yodh, A.
Suppres-sion of the coffee-ring effect by shape-dependent capillary interactions. Nature 476, 308–311 (2011).
[13] Yunker, P. J. et al. Effects of particle shape on growth dynamics at edges of evaporating drops of colloidal sus-pensions. Physical review letters 110, 035501 (2013). [14] Hu, H. & Larson, R. G. Analysis of the effects of
marangoni stresses on the microflow in an evaporating sessile droplet. Langmuir 21, 3972–3980 (2005). [15] Bennacer, R. & Sefiane, K. Vortices, dissipation and
flow transition in volatile binary drops. Journal of Fluid Mechanics 749, 649–665 (2014).
[16] Christy, J. R., Hamamoto, Y. & Sefiane, K. Flow tran-sition within an evaporating binary mixture sessile drop. Physical review letters 106, 205701 (2011).
[17] Darras, A., Vandewalle, N. & Lumay, G. Transitional bulk-solutal marangoni instability in sessile drops. Phys-ical Review E 98, 062609 (2018).
[18] Yen, T. M. et al. Reversing coffee-ring effect by laser-induced differential evaporation. Scientific reports 8, 3157 (2018).
[19] Li, Y., Yang, Q., Li, M. & Song, Y. Rate-dependent interface capture beyond the coffee-ring effect. Scientific reports 6, 24628 (2016).
[20] Hu, H. & Larson, R. G. Marangoni effect reverses coffee-ring depositions. The Journal of Physical Chemistry B 110, 7090–7094 (2006).
[21] Nguyen, V. X. & Stebe, K. J. Patterning of small par-ticles by a surfactant-enhanced marangoni-b´enard insta-bility. Physical Review Letters 88, 164501 (2002). [22] Still, T., Yunker, P. J. & Yodh, A. G. Surfactant-induced
marangoni eddies alter the coffee-rings of evaporating col-loidal drops. Langmuir 28, 4984–4988 (2012).
[23] Davidson, Z. S. et al. Deposition and drying dynamics of liquid crystal droplets. Nature Communications 8, 15642 (2017).
[24] Jadav, M., Patel, R. & Mehta, R. Influence of magnetic field on evaporation of a ferrofluid droplet. Journal of Applied Physics 122, 145302 (2017).
[25] Afkhami, S. et al. Deformation of a hydrophobic fer-rofluid droplet suspended in a viscous medium under uni-form magnetic fields. Journal of Fluid Mechanics 663, 358–384 (2010).
[26] Lee, J. G., Porter, V., Shelton, W. A. & Bharti, B. Mag-netic field-driven convection for directed surface
pattern-ing of colloids. Langmuir 34, 15416–15424 (2018). [27] Darras, A., Mignolet, F., Vandewalle, N. & Lumay,
G. Remote-controlled deposit of superparamagnetic col-loidal droplets. Physical Review E 98, 062608 (2018). [28] Faraudo, J., Andreu, J. S. & Camacho, J. Understanding
diluted dispersions of superparamagnetic particles under strong magnetic fields: a review of concepts, theory and simulations. Soft Matter 9, 6654–6664 (2013).
[29] Faraudo, J. & Camacho, J. Cooperative magnetophoresis of superparamagnetic colloids: theoretical aspects. Col-loid Polym. Sci. 288, 207–215 (2010).
[30] Tavacoli, J. W. et al. The fabrication and directed self-assembly of micron-sized superparamagnetic non-spherical particles. Soft Matter 9, 9103–9110 (2013). [31] Andreu, J. S., Camacho, J. & Faraudo, J.
Aggrega-tion of superparamagnetic colloids in magnetic fields: the quest for the equilibrium state. Soft Matter 7, 2336–2339 (2011).
[32] Promislow, J. H., Gast, A. P. & Fermigier, M. Aggrega-tion kinetics of paramagnetic colloidal particles. J. Chem. Phys. 102, 5492–5498 (1995).
[33] Dom´ınguez-Garc´ıa, P., Pastor, J. & Rubio, M. Aggre-gation and disaggreAggre-gation dynamics of sedimented and charged superparamagnetic micro-particles in water sus-pension. Eur. Phys. J. E 34, 1–7 (2011).
[34] Dom´ınguez-Garc´ıa, P., Melle, S., Pastor, J. & Rubio, M. Scaling in the aggregation dynamics of a magnetorheo-logical fluid. Phys. Rev. E 76, 051403 (2007).
[35] Fermigier, M. & Gast, A. P. Structure evolution in a paramagnetic latex suspension. Journal of colloid and interface science 154, 522–539 (1992).
[36] Darras, A., Fiscina, J., Pakpour, M., Vandewalle, N. & Lumay, G. Ribbons of superparamagnetic colloids in magnetic field. The European Physical Journal E 39, 1–6 (2016).
[37] Rojas, N., Darras, A. & Lumay, G. Self-assembly processes of superparamagnetic colloids in a quasi-two-dimensional system. Physical Review E 96, 012608 (2017).
[38] Darras, A., Fiscina, J., Vandewalle, N. & Lumay, G. Re-lating brownian motion to diffusion with superparamag-netic colloids. American Journal of Physics 85, 265–270 (2017).
[39] Yavuz, C. T. et al. Low-field magnetic separation of monodisperse fe3o4 nanocrystals. Science 314, 964–967 (2006).
[40] Krishnan, K. M. Biomedical nanomagnetics: a spin through possibilities in imaging, diagnostics, and ther-apy. IEEE Trans. Magn. 46, 2523–2558 (2010).
[41] Corchero, J. L. & Villaverde, A. Biomedical applications of distally controlled magnetic nanoparticles. Trends Biotechnol. 27, 468–476 (2009).
[42] Jeong, U., Teng, X., Wang, Y., Yang, H. & Xia, Y. Su-perparamagnetic colloids: controlled synthesis and niche applications. Adv. Mater. 19, 33 (2007).
[43] Gajula, G. P., Neves-Petersen, M. T. & Petersen, S. B. Visualization and quantification of four steps in magnetic field induced two-dimensional ordering of superparamag-netic submicron particles. Appl. Phys. Lett. 97, 103103 (2010).
[44] Khalil, K. S. et al. Binary colloidal structures assembled through ising interactions. Nat. Commun. 3, 794 (2012). [45] Gurevich, Y., Mankov, Y. & Khlebopros, R. Self-assembly of superparamagnetic ferrihydrite
nanoparti-cles. Dokl. Phys. 11, 478–481 (2013).
[46] Martinez-Pedrero, F. & Tierno, P. Magnetic propul-sion of self-assembled colloidal carpets: Efficient cargo transport via a conveyor-belt effect. Phys. Rev. Applied 3, 051003 (2015). URL http://link.aps.org/doi/10. 1103/PhysRevApplied.3.051003.
[47] Carstensen, H., Kapaklis, V. & Wolff, M. Phase forma-tion in colloidal systems with tunable interacforma-tion. Phys. Rev. E 92, 012303 (2015). URL http://link.aps.org/ doi/10.1103/PhysRevE.92.012303.
[48] M¨uller, K. et al. Pattern formation and coarse-graining in two-dimensional colloids driven by multiaxial magnetic fields. Langmuir 30, 5088–5096 (2014).
[49] Llera, M., Codnia, J. & Jorge, G. A. Aggregation dynam-ics and magnetic properties of magnetic micrometer-sized particles dispersed in a fluid under the action of rotat-ing magnetic fields. J. Magn. Magn. Matter 384, 93–100 (2015).
[50] Erb, R. M., Son, H. S., Samanta, B., Rotello, V. M. & Yellen, B. B. Magnetic assembly of colloidal superstruc-tures with multipole symmetry. Nature 457, 999–1002 (2009).
[51] Martinez-Pedrero, F. & Tierno, P. Magnetic propulsion of self-assembled colloidal carpets: Efficient cargo trans-port via a conveyor-belt effect. Phys. Rev. Applied 3, 051003 (2015).
[52] Martinez-Pedrero, F., Ortiz-Ambriz, A., Pagonabarraga, I. & Tierno, P. Colloidal microworms propelling via a co-operative hydrodynamic conveyor belt. Phys. Rev. Lett. 115, 138301 (2015).
[53] Carstensen, H., Kapaklis, V. & Wolff, M. Phase forma-tion in colloidal systems with tunable interacforma-tion. Phys.
Rev. E 92, 012303 (2015).
[54] Liu, P., De Folter, J. W., Petukhov, A. V. & Philipse, A. P. Reconfigurable assembly of superparamagnetic col-loids confined in thermo-reversible microtubes. Soft Mat-ter 11, 6201–6211 (2015).
[55] Edmond, K. V. et al. Tracking the brownian diffusion of a colloidal tetrahedral cluster. Chaos-Woodbury 21, 041103 (2011).
[56] Dreyfus, R. et al. Microscopic artificial swimmers. Nature 437, 862–865 (2005).
[57] Yu, J., Wang, B., Du, X., Wang, Q. & Zhang, L. Ultra-extensible ribbon-like magnetic microswarm. Na-ture communications 9, 3260 (2018).
[58] Bhardwaj, R., Fang, X., Somasundaran, P. & Attinger, D. Self-assembly of colloidal particles from evaporating droplets: role of dlvo interactions and proposition of a phase diagram. Langmuir 26, 7833–7842 (2010). [59] Darras, A., Opsomer, E., Vandewalle, N. & Lumay, G.
Superparamagnetic colloids in viscous fluids. Scientific Reports 7 (2017).
[60] Xie, Q. & Harting, J. From dot to ring: The role of friction in the deposition pattern of a drying colloidal suspension droplet. Langmuir 34, 5303–5311 (2018). [61] Li, D., Banon, S. & Biswal, S. L. Bending dynamics of
dna-linked colloidal particle chains. Soft Matter 6, 4197– 4204 (2010).
[62] Hall, C. L., Vella, D. & Goriely, A. The mechanics of a chain or ring of spherical magnets. SIAM Journal on Applied Mathematics 73, 2029–2054 (2013).