O
pen
A
rchive
T
OULOUSE
A
rchive
O
uverte (
OATAO
)
OATAO is an open access repository that collects the work of Toulouse researchers and
makes it freely available over the web where possible.
This is an author-deposited version published in :
http://oatao.univ-toulouse.fr/
Eprints ID : 18464
To link to this article
: DOI:
10.1016/j.ijadhadh.2017.09.004
URL :
http://dx.doi.org/10.1016/j.ijadhadh.2017.09.004
To cite this version
: Genty, Sébastien and Sauvage, Jean-Baptiste and
Tingaut, Philippe and Aufray, Maëlenn Experimental and statistical
study of three adherence tests for an epoxy-amine/aluminum alloy
system: Pull-Off, Single Lap Joint and Three-Point Bending tests.
(2017) International Journal of Adhesion and Adhesives, vol. 79. pp.
50-58. ISSN 0143-7496
Any correspondence concerning this service should be sent to the repository
administrator:
[email protected]
Experimental and statistical study of three adherence tests for an
epoxy-amine/aluminum alloy system: Pull-Off, Single Lap Joint and Three-Point
Bending tests
Sébastien Genty
a,b, Jean-Baptiste Sauvage
a, Philippe Tingaut
b, Maëlenn Aufray
a,⁎aUniversité de Toulouse, CIRIMAT, INPT-ENSIACET, 4 allée Émile Monso, 31030 Toulouse, France bSOCOMORE, ZI du Prat, 56037 Vannes Cedex, France
Keywords: Epoxides
Aluminum and alloys Adherence Single Lap Joint Pull-Off
Three-Point Bending Surface treatment Weibull
Principal Component Analysis
A B S T R A C T
The mechanical resistance of a bonded joint depends on the adhesive interaction onto the substrate and the mechanical properties of the adhesive itself. Many existing tests can be useful for measuring the adherence or evaluating mechanical adhesive response. All these tests do not provide the same information: in particular, adherence measurements can be split into initiation tests and propagation ones. In this paper, three adherence tests have been considered for the evaluation of the fracture initiation between a poly-epoxide adhesive (a mixture of pure epoxy and amine) and an aluminum surface (AA 2024-T3), namely the Pull-Off, Single Lap Joint (SLJ) and Three-Point Bending tests. Various surface preparation protocols before bonding have been tested and optimized for aluminum substrates, including mechanical and chemical surface treatments, followed by the application of an appropriate primer before bonding. This study paves the way for the future development of adhesive systems as it provides reliable surface preparation protocols for aluminum surfaces and gives an insight into the choice of an adequate adherence test dedicated to high-performance adhesives. The load at break (FMax), the experimental error, the failure mode and statistical studies according to the Weibull model and Principal Component Analysis (PCA) were studied on each surface preparation configuration. It has been shown that the application of a primer, especially a sol-gel product increases the load at break and provides more reliable results. Then, this paper shows that the two tests can quantify the failure initiation and distinguish the different surface preparation efficiency, are the Single Lap Joint test (mode II or mode I + II) and the Three-Point Bending test (mode I), with an increase of the results reliability with the latter one. The Pull-Off test (mode I) is useful as a routine checking, and particularly interesting because its response does not depend on the substrate thickness, even though it cannot highlight the difference between all surface preparations.
1. Introduction
Structural adhesives are commonly used in engineering structures to bond pieces with various morphological, physical and chemical prop-erties. In the automotive and aerospace industries, epoxy-based ther-mosets are one of the most widely used adhesives, thanks to their good mechanical properties (resistance to compression, peeling, shear and fatigue) and a good reduction of stress concentrations in fastened structures[1]. Most importantly, epoxy-amine systems are known for their excellent adhesion properties[2]. While the chemical design of an adhesive material is essential for the elaboration of a bonded joint with required properties, the surface preparation of the substrate plays a crucial role in the achievement of a strong bond between the adhesive
and the substrate [3]. For aluminum surfaces, the removal and re-placement of a new oxide layer on top of the aluminum plate lead to a strong, stable and homogeneous bond between the aluminum and an epoxy-amine adhesive system. The surface treatment can be considered as mechanical (grit-blasting or sandblasting), physical (laser- and plasma-treatment), chemical (acidic or alkaline etching) or electro-chemical (anodization and electrodeposition) [4]. For example, the removal of the aluminum oxide layer (Al2O3) is usually obtained with a
chemical surface treatment, such as sulfuric acid etching or nitric acid sodium sulfate etching[4,5].
Thus, the adhesion of the polymer on the substrate is a key para-meter, which strongly influences the final properties of the bonded joint. Nevertheless, the precise and reliable measurement of the fracture
⁎Corresponding author.
E-mail address:[email protected](M. Aufray).
Abbreviations: Sococlean A3431, Degreaser; Socosurf A1806-A1856, HNO3deoxidizer; Socogel B0102, sol-gel; Cr-primer, Br®127; SLJ, Single Lap Joint; FMax, Load at break; PCA,
initiation is not trivial. Among the various methods evaluated in lit-erature[6], the Pull-Off test[7–13](mode I) and Single Lap Joint (SLJ) test[14–18](mode II or mode I + II) have been widely employed for the development of commercial products in the aerospace and auto-motive industries since they present the advantages to be normative (ASTM D 4541 and NF EN 2243-1 respectively), very simple, cost-ef-fective and to offer the flexibility to test large groups of specimens for statistical assurance. The main difference between the two tests, after the opening mode, is that for SLJ measurements, the mechanical re-sponse depends on the thickness of the adhesive or the substrate[15], contrary to the Pull-Off test, provided that the substrate is thick enough not to be deformed during the test[10,13]. Despite the above-men-tioned advantages, the evaluation and quantification of the adherence cannot always be performed with such tests. Hence, a failure in the adhesive itself (i.e. cohesive failure) is often reported for strong ad-herent bonding elements, which typically let us notice the mechanical properties of the adhesive itself but prohibits the use of these techni-ques to measure the fracture initiation. In addition, the main source of error in these two tests stems from misalignments that can introduce peel forces leading to a non-uniform stress concentration at the edge of the bonded joint[6]. Then, a third adherence test was used: The Three-Point Bending test (AFNOR, ISO 14679:1997). It always provides the quantification of the adherence in an adhesively bonded structure, whatever the affinity of the adhesive to the substrate is. Indeed, ad-hesive fracture initiation is always expected and localizable[8,19–22]. But, as for SLJ, the fracture initiation force depends on the substrate thickness.
Experimental data and its study give information on the load at break (FMax), the variability of results and the failure mode. But, a large
amount of the raw data emerging from the adherence measurements is noticed, so that the interpretation of tests’ reliability, and the relevance of surface preparations are quite difficult. In order to assess the varia-bility, the most widely reported analysis of brittle materials is the dis-tribution function proposed by Weibull[23]. In this model, the bonded interphase is considered as a chain of several links, in which the failure of the materials is led by the weakest link. Thus, the dispersion of cri-tical defects can be evaluated and the reliability of adherence tests or experimental conditions (i.e. the Weibull modulus m) can be defined
[24–27]. Finally, in order to confirm the correlation of the measured properties by each adherence test, the Principal Component Analysis (PCA) has been used. Usually, it is one of the most widely used math-ematical tools of multivariate analysis, but it can sometimes reveal hidden or non-trivial interactions between the raw data by the identi-fication of the principal components: here, the adherence.
2. Experimental and theoretical details 2.1. Materials and coupons preparations 2.1.1. Substrates
The metallic substrate used was a commercial bare Aluminum Alloy 2024-T3 (AA 2024-T3), with a thickness of 1.600 ± 0.005 mm from
Rocholl GmbH (Germany) for Pull-Off test. The bare AA 2024-T3 sub-strate had a thickness of 1.000 ± 0.005 mm from Rocholl GmbH (Germany) for Single Lap Joint, and from Kaiser Aluminum (U.S.A.) for Three-Point Bending tests. The nominal chemical composition by weight percentage of this alloy is 3.8–4.9 Cu, 1.2–1.8 Mg, 0.3–0.9 Mn, 0.50 Si, 0.50 Fe, 0.25 Zn, 0.15 Ti, 0.10 Cr and fewer than 0.15 of other elements. The aluminum surface has been considered as identical since the chemical composition and the temper conditions of the material are also the same while the rugosity is the same considering measurement error. Aluminum plates were received as 1 dm² panels from the supplier and were then cut depending on the test specifications (seeSection 2.2).
2.1.2. Surface preparation
The surface preparation protocols evaluated in this study are com-posed of three surface treatments with or without two primer applica-tions (seeTable 1).
The first surface treatment, named “hydrochloric acid etching”, consisted of immersing the aluminum plate into a solution of 3.7 vol% of hydrochloric acid for five minutes at room temperature (23 °C ± 2 °C), rinsing in distilled water for two minutes at room tem-perature and drying at 50 °C in an oven for thirty minutes. The second surface treatment, named “degreasing followed by nitric acid deox-idizing”, consisted of degreasing the surface with an alkaline solution (10 vol% of SOCOCLEAN A3431 in distilled water) at 45 °C for fifteen minutes, rinsing in distilled water for two minutes at room temperature, deoxidizing the surface with an acidic solution (40 vol% of SOCOSURF A1858 + 10 vol% of SOCOSURF A1806 in distilled water) at 50 °C for five minutes, rinsing in distilled water for two minutes at room tem-perature and drying at 50 °C in an oven for thirty minutes. Once treated, aluminum panels have been primed or bonded within 8 h, in order to preserve the surface treatment effectiveness. The third surface treat-ment, named “abrasion”, consisted of abrading the surface for thirty seconds with a Scotch-brite®pad, cleaning with acetone-saturated wipes
and then with dry wipes.
After the surface treatment, either the substrates were bonded as treated (see “None” in the column “Applied primer” inTable 1) or two different commercial primers were applied onto the surface. The first one was a chromated modified epoxy corrosion inhibiting primer named BR®127 by Cytec; called Cr-primer. This primer was chosen as it
is a standard in the aerospace industry to protect the prepared surfaces from further oxidation before bonding. It was applied by spraying to a dry primer thickness of 2 µm, then air dried for thirty minutes, prior to being cured in an oven at 120 °C for thirty minutes. The second one was a Sol-gel conversion product (zirconium salts activated by an organo-silicon compound), named SOCOGEL B0102 by Socomore. It was ap-plied by spraying onto the surface until it was completely wetted, but without product flowing. It was dried for one hour at room temperature to a dry sol-gel thickness of 100 nm.
2.1.3. Adhesive and bonding thermal curing
The aluminum substrates were adhesively bonded by applying a mixture of an epoxy pre-polymer and an amine curing agent. The epoxy
Table 1
Surface preparations.
Series number Surface treatment Applied primer
1 Hydrochloric acid etching (3.7 v.%) None
2 Cr-primer (BR®127)
3 Sol-gel (SOCOGEL B0102)
4 Degreasing followed by nitric acid deoxidizing (10 vol% of SOCOCLEAN A3431 + 40% vol% of SOCOSURF A1806/A1858) None
5 Cr-primer (BR®127)
6 Sol-gel (SOCOGEL B0102)
7 Abrasion (Scotch-brite®) None
8 Cr-primer (BR®127)
pre-polymer is a bisphenol A diglycidyl ether (DGEBA or BADGE, Epoxy Equivalent Weight = 171–175 g eq−1, D.E.R.™ 332 from Dow
Chemicals) and the hardener is the triethylenetetraamine (TETA, Amine Hydrogen Equivalent Weight = 24 g eq−1, D.E.H.™ 24 from Dow
Chemicals). The “model adhesive” used in this study was a stoichio-metric mixture of DGEBA with 13.9 parts per hundred grams of resin (phr) of TETA. After bonding following each test conditions, coupons were kept at room temperature for three hours, prior to being cured in an oven. Coupons were heated from room temperature up to 60 °C, at 5 °C min−1for thirty minutes, then heated up to 90 °C at 5 °C min−1for
thirty minutes, followed by a heating step up to 150 °C at 5 °C min−1
for thirty minutes, and cooled down to room temperature at 2 °C min−1. This curing cycle allowed us to achieve a complete
poly-merization of the adhesive (i.e. conversion rate = 1). It has been evaluated by Dynamic Scanning Calorimetry as the onset of the glass transition temperature (Tg) has reached the maximum glass transition
temperature of the “model adhesive” (i.e. Tg = Tg∞where Tg∞ =
138 °C).
2.2. Adherence tests
For adherence measurement, three test methods have been used: the SLJ, the Pull-off and the Three-Point bending tests. Commonly, Pull-off and SLJ results are often strength terms (in Mega Pascals), while Three-Point bending results are force terms (in Newtons). In this paper, all the results have been expressed only as force terms. This is possible because it has been shown that strength at break is mainly governed by the edge, more than the bonded area[28]and that for small areas, the use of force and strength give the same information on adherence mea-surement[8].
2.2.1. Single Lap Joint test (AFNOR, NF EN 2243-1)
The Single Lap Joint (SLJ) test applies a force enabling a crack to initiate and propagate with a sliding mode (type II fracture mode). In this configuration, stresses have been shown as concentrated at the end of the overlap especially by finite element so that the mechanical re-sponse of this test strongly depends on the substrate and adhesive thicknesses [16,29] along with the adhesive thickness imperfections
[30]. Additionally, a lot of studies have been published in order to describe the effect of the bending moments [18,29,31,32]. It is well described that the bending moments around the edges can become predominant and are induced by the eccentric geometry (i.e. adherend and adhesive thickness) and the applied load. In such a case, the cracks propagate with a type I + II fracture mode. The SLJ test was considered according to the NF EN 2243-1. The panels previously described were die-cut to the correct required dimension (25.0 ± 0.5 mm by 75.0 ± 5.1 mm), using a strip cutter (Promattex, France). After the chosen surface preparation of the aluminum surface has been per-formed, the DGEBA-TETA liquid mixture was applied onto the surface by ensuring that it was done across the entire surface. In conformity with the normative reference, the joint had an overlap of 12.5 ± 0.5 mm and a width of 25.0 ± 0.5 mm as shown inFig. 1. Once assembled, the excess of adhesive has been removed with a spatula.
By using metallic packers, the applied adhesives had a thickness of 0,15 ± 0,05 mm, controlled after assembly and curing with a digital caliper to be in the given range. Series of twelve coupons were prepared and tested for each configuration. SLJ test was performed with a tensile machine (INSTRON 3369, Élancourt, France) and was carried out at room temperature (23 °C ± 2 °C using a 5000 N full-scale load cell with
a sensitivity of 0.5% of the measured values. The ends of the coupons were tightly gripped in the jaws of the tensile machine. Packers were used so that the jaws are aligned and an imaginary straight line passes through the two points of fixing and the center of the bonded area. Each coupon was gripped 50.0 ± 5.0 mm from the joint edge. In accordance with the normative reference, the rate loading has to be between 2800 and 5000 N min−1, and it has been chosen in this study to be
3000 N min−1. The recorded curve is typically a load-strain curve
where the load at break (FMax) was measured. Usually, the ultimate load
is then divided by the overlap to evaluate the lap shear strength (σMaxin
MPa), but it has been shown that the shear strength in a SLJ is mainly governed by the leading edge, and not by the bonded area[28]. In other words, for a very small variation of the surface, the load at break study makes sense.
2.2.2. Pull-Off test (AFNOR, ASTM D 4541)
The Pull-off test is often used to determine the adhesion from the force required to pull a tested adhesive off a surface. A large number of studies has been performed in order to determine the several factors affecting the measured load at break. Adherend thickness affects sig-nificantly the tensile strength and the failure mode. The lower the thickness is, the more the strength at break decreases while the more the failure is adhesive (interfacial)[10,33]. The thickness used in this study is that given in the standard of the test (i.e. 1.6 mm). According to the literature, for this adherend thickness, the deformation of the sub-strate is limited [10]. Another source of variance results from mis-alignments of the applied force that can introduce bending forces so that stresses can be concentrated on the edge and lead to a reduction of the measured strength[6]. However, the adhesive thickness has been shown to have little to do with the adherence strength or force[8].
The Pull-Off test was performed with a self-aligning tensile machine (PosiTest AT-A Automatic, by Defelsko) according to the ASTM D 4541. Pure aluminum studs of 10.0 ± 0.1 mm diameters were used, with a displacement speed of 1 MPa s−1. For this test, the substrate needs not
to be cut before the adhesive application. After the chosen surface preparation of the aluminum surface has been performed, 0.05 g of the DGEBA-TETA liquid mixture was applied onto the surface by ensuring that it was done across the entire surface. Then aluminum studs were adhesively bonded on the applied adhesive (seeFig. 2) and by applying a constant lead (4,000 g for 1 s). Finally, the adhesive has to be squeezed out, and the excess was cleaned around the fixture. The thickness of the adhesive is then measured with a digital caliper, and accepted if it is 0,15 ± 0,05 mm (the same as the one for SLJ test).
Series of twelve samples were prepared and tested for each con-figuration. The recorded value given by the device is expressed in MPa. For the same reason as SLJ test, the strength (MPa) is converted to load (N), by multiplying the strength at break by the bonded surface (i.e. 78.5 mm²).
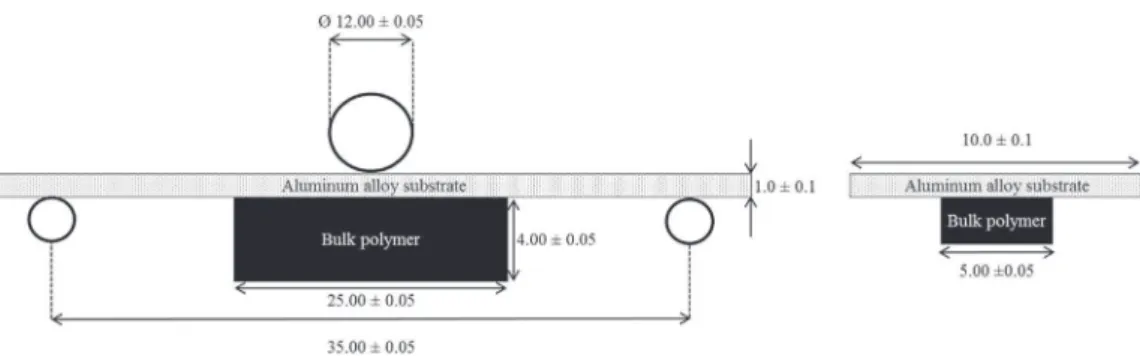
2.2.3. Three-Point Bending test (AFNOR, ISO 14679:1997)
The Three-Point Bending test was performed according to the nor-mative reference AFNOR, ISO 14679:1997, and the Three-Point Bending test was previously described from a mechanical point of view
[8,19]. The aluminum panels previously described were die-cut to the correct dimensions. The epoxy-amine adhesive was applied onto cut (10.0 ± 0.1 mm by 40.0 ± 0.1 mm) and prepared AA 2024-T3 (see
Section 2.1.2) by applying 0.5 mL with a syringe in a silicon mold be-tween two clamping plates to form an adhesive block with 25 by 5 by 4 mm3dimensions[8,19,21]. Series of twelve samples were prepared
and tested for each configuration. This test was performed with a tensile machine (INSTRON 3369, Élancourt, France), fitted with a 500 N full-scale load cell with a sensitivity of 0.5% of the measured values and was carried out at room temperature (23 °C ± 2 °C). The displacement rate was 0.500 ± 0.003 mm min−1 in the Three-Point configuration (see
Fig. 3). The ultimate load, FMax, was considered as the failure initiation measurement.
The two main parameters of the adherence force have been shown to be the substrate thickness and the shape of the adhesive cube[34]. 2.3. Statistical analysis of failure
The study of raw data can give information concerning the load at break (FMax), the variability of the results or the failure mode (initiation
and crack propagation). Beyond this interpretation, a statistical study can give additional information. For that purpose, two statistical studies regarding the Weibull model and the Principal Component Analysis have been performed.
2.3.1. Weibull analysis
Even if the tested adhesive is macroscopically homogeneous, the fracture has to be considered as a consequence of a probability of failure. This observation can only be considered for brittle materials. Let us note that this criterion is applicable for DGEBA-TETA adhesives since no plastic deformation occurs during mechanical testing. Based on the concept that the failure is led by the most serious flaw[35], the cumulative distribution function of the Weibull distribution is given by:
⎜ ⎟ = − ⎡ ⎣⎢− ⎛⎝ − ⎞ ⎠ ⎤ ⎦⎥ P 1 exp V σ σ σ u 0 m (1) where P is the failure probability for the stress σ, σ0is a normalizing
factor, σuis the stress below which there is zero probability of failure, m
is the Weibull modulus and V is the volume of the tested specimen. For estimating the Weibull distribution parameters, various methods are proposed: the least square method (LSM), the weighted least square method (WLSM), the maximum likelihood method (MLM) and the method of moments (MOM). For a small sample size (about ten), it has been shown that the LSM and WLSM outperform the MLM and the MOM[36]. Considering the sample size in this study (twelve) and the fact that both methods are very simple, the LSM has been chosen for estimating the Weibull distribution. According to the LSM, many estimators have been proposed to calculate Pjof the jth strength.
Among all the proposed estimators[35], two are commonly known and used: = + P j N 1 (2) = − P j 0.5 N (3)
where N is the number of tested samples.
BERGMAN[35]has shown that the choice of the most reliable es-timator is led by the sample size. When the number of samples is quite
low (i.e. less than 50), the most reliable estimator is the Eq.(3). This estimator has been used for the Weibull analysis in this study. It is ra-ther difficult to estimate the threshold strength below which the failure probability is zero (σu). To avoid an overestimation of this factor, it is
widely recommended to consider σu= 0 for brittle materials[35]. By
considering σu= 0 for better reliability, the logarithm of the opposite
logarithm of Eq.(1)gives the result as follows:
− − = − +
ln( ln(1 P)) m. ln(σ) m. ln(σ ) ln (V)0 (4)
If the termln(−ln(1−P))is plotted as a function ofln σ( ), a linear function is obtained in which m (i.e. the Weibull modulus) is the slope of the best straight-line relationship. The Weibull modulus is used to describe the variability in strength of brittle materials. If the failure is led by the weakest defect, then the Weibull modulus measures the distribution of these defects. The higher the Weibull modulus is, the lower the dispersion of defect is. For a same tested configuration among the three tests, a higher Weibull modulus would reveal that the test is the most reliable for measuring the adherence.
2.3.2. Principal component analysis (PCA)
Initially, the main purpose of PCA is to reduce the number of inter-correlated variables into a smaller number of non-inter-correlated variables
[37]. For a better visualization, two or three variables (for a display in two or three dimensions) is preferable. In this study, the principal component analysis was used to confirm if the variables (here the ad-herence tests) were correlated (without reducing their number). The two principal components (PC1, the largest variance and PC2) are plotted orthogonal to each other. This result is obtained by using XLSTAT (Addinsoft, 2016; XLSTAT 2016: Data Analysis and Statistical Solution for Microsoft Excel. Paris, France (2016)). The active variables are given by the average of FMaxwithin the three tests, the individuals
are given by the nine FMax(obtained with the various surface
ment). Thus, the individuals show the robustness of the surface treat-ments when the active variables represent the robustness of the adhe-sion tests.
3. Results and discussion
This study has been conducted using a model adhesive DGEBA-TETA system applied onto AA 2024-T3 substrates. The impact of the surface preparation on the adherence properties of the bonding ele-ments has been investigated by treating the aluminum panels with ei-ther a chemical or a mechanical treatment, followed or not by the ap-plication of an adherence promoting primer before bonding (see the
Table 1, previously described). For each surface preparation and test envisaged, twelve samples have been prepared in order to obtain reli-able results. After testing, the failure mode of one sample for each configuration has been determined by characterizing the morphology of the fractured surfaces either with optical study or Scanning Electron Microscopy (SEM). All the results related to the adherence tests were then combined and statistically compared with two studies: The Wei-bull analysis and the Principal Component Analysis (PCA).
Fig. 3. Three-Point Bending geometry (not to scale, dimensions in mm).
3.1. Impact of surface preparation on adherence
The fracture initiation has been evaluated by measuring the load at break (FMax) with three characterization tests namely the Pull-Off, SLJ
and Three-Point Bending tests. Then, after each testing, failure modes have been determined by characterizing the fractured surfaces mor-phology with optical microscopy for Three-Point Bending and SLJ and SEM for Pull-Off and Three-Point Bending test (Fig. 4). Let us note that on these pictures, a porosity can be observed when the volume of the adhesive used is important (i.e. in the case of the pull-off test and Three-Point Bending). This porosity cannot be easily controlled and results from air entrapment when the DGEBA-TETA mixture is made (blend of a high viscosity prepolymer and a low viscosity hardener). The failure mode is representative of the difference between the cohesive and ad-hesive resistance of the DGEBA-TETA system. Since the failure occurs at the point of least resistance, fracture initiation can be adhesive or co-hesive. Let us remind that we are interested in only failure initiation. Adhesive failure shows a fracture initiation occurring between the ad-hesive and the substrate, when coad-hesive failure is representative of a fracture initiation occurring in the bulk adhesive. Let us note the dual type failure is representative as a part of adhesive failure and another one cohesive with a non-localizable failure initiation. Thus, it is
impossible to conclude and quantify the adherence when the failure mode is dual.
In this study, adhesive failures were observed on fractured samples resulting from Three-Point Bending and SLJ tests, denoting a fracture initiation between the adhesive and the substrate (Fig. 4A and C). Fractured samples resulting from Pull-Off test showed an unknown fracture initiation (Fig. 4B).
TheFig. 5presents the average FMaxobtained with the three tests,
for each surface preparation evaluated. On all the histograms, black columns highlight the unknown fracture initiation when gray ones point out the adhesive fracture initiation. When unknown fracture in-itiations are observed, the adherence force is equal to or higher than FMaxbut cannot be quantified in this particular case.
Let us focus on the surface preparation impact. Looking at the his-tograms related to each test, the same trend was observed. Without any primer, a progressive increase of FMaxwas measured from the chemical
acidic HCl treatment, to the mechanical abrasion treatment and finally the degreasing/deoxidizing surface treatment. This result was expected since the importance of an appropriate deoxidizing treatment has al-ready been demonstrated before bonding[2,38,39]. An increase in FMax
has been measured for all surface treatments after the application of a primer, but the trend previously discussed between the different surface
Fig. 4. (A) Pictures of the adhesive fracture initiation by Single Lap Joint test; (B) Picture of adhesive fracture initiation after Three-Point bending test; (C) Picture of adhesive initiation after pull-off test; (D) Picture of an unknown initiation fracture after pull-off test.
treatments was maintained. For all tests evaluated, the application of a sol-gel after a surface treatment led to a higher increase in FMax
com-pared to the use of a Cr-primer. Few authors have investigated the effect of a primer application before bonding (as Br®127)[40]and the
im-provement of adherence by silanes (sol-gel) application has often been investigated[41].
Let us focus on the adherence tests impact. Considering the minimum value of FMax(i.e. the load at break obtained for HCl surface
treatment without primer) and the maximum value of FMax(i.e. the load
at break obtained for degreasing followed by nitric acid deoxidizing surface treatment with a sol-gel conversion, the ratio of these two FMax
is different between the Pull-Off test and the two other tests. It is equal to 2.0 for Pull-Off; 4.5 and 4.1 for SLJ and Three-Point Bending re-spectively. In other words, it appears that Pull-Off test is less selective than the two other tests. In addition, when the fracture initiation is unknown (i.e. black column inFig. 5), the FMaxmeasured is roughly the
same (except for the test series with a degreasing followed by nitric acid deoxidizing without any primer). In these cases, neither the adherence of the system nor the intrinsic mechanical properties have been mea-sured. Thus, the Pull-Off test is not an appropriate method to quantify the adherence of a DGEBA-TETA adhesive onto an aluminum substrate, treated or not. However, the simplicity of the method and the trends observed in Fig. 5 compared to the two other tests prove that this method is an adequate tool for comparative purposes. Concerning the SLJ and Three-Point Bending tests, failure modes were always adhesive. Unlike Pull-Off results, the standard deviations in FMaxresulting from
the tests with SLJ and Three-Point Bending tests are lower than the difference of measured adherence between two configurations. In other words, a quantitative evaluation of the adherence has been obtained
with these two tests. The interesting observation is that the adherence measurement has the same tendency for the three tests, even if the fracture modes are not the same. Indeed, fracture modes have been shown by finite element to be mode I for Pull-Off[10,11,42]and the Three-Point Bending[21], mode II for SLJ.
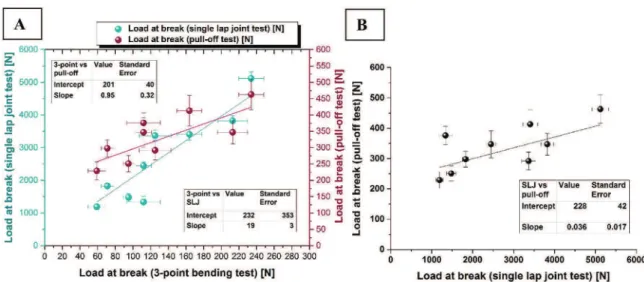
3.2. Comparison of the three adherence tests
To assess these observations about qualitative and quantitative evaluation of the adherence with the three methods used, the FMax
obtained by SLJ and Pull-Off as a function of those obtained by Three-Point Bending are presented inFig. 6A. For a complete reading, the
Fig. 6B presents the FMax obtained by Pull-Off test expressed in a
function of those obtained by SLJ.
Between the SLJ and Three-Point Bending tests, a linear function, with a slope error of 16% (∆a=
a
3
19) can be found so that when the adherence of a system is increasing, it can be measured in the same way by Three-Point Bending and SLJ tests. Despite a similar tendency which can also be noticed between Three-Point Bending results and that of Pull-Off, the linear function is less obvious and reliable. Indeed, when the Pull-Off results are expressed in function of Three-Point Bending, the error is 30% (∆a=
a 0,32 0,95). The error is 50% ( = ∆a a 0,017 0,036) when the Pull-Off test results are expressed in function of those of SLJ. This lack of reliability can also be noticed between the loads at break obtained by Pull-Off tests and those obtained by Single Lap Joint (Fig. 6B). These observations confirm that the adherence measurement by Pull-Off test is qualitative, contrary to the adherence measured by SLJ or Three-Point Bending which is quantitative.
Fig. 5. Average load at break measured by the Pull-Off, SLJ and Three-Point Bending tests, where gray columns represent an adhesive fracture initiation and black ones an unknown fracture initiation.
3.3. Statistical analysis
A difference between tests' reliability has been shown. In order to quantify the reliability of each test, the determination of the Weibull modulus according to the LSM has been used. This allows us to quantify the reliability of each adherence test and each surface preparation.
It has also been confirmed that the adherence measurement could be qualitative or quantitative depending on the used adherence test. The Principal Component Analysis has been used to analyze the cor-relation between each variable (here the adherence tests) and be able to confirm if each adherence test gives the same information (i.e. the ad-herence).
3.3.1. Weibull analysis
The main information studied in the Weibull analysis is the modulus m, which gives information on the reliability of the results. The Weibull modulus is generally reported to characterize the variability in strength of brittle materials (let us remind that this criterion is applicable to DGEBA-TETA adhesives since no plastic deformation occurs during mechanical testing). If the failure is led by the weakest defect, then the Weibull modulus measures the distribution of these defects[24–26,43]. The higher the Weibull modulus is, the lower the dispersion of the defect is. Consequently, by comparing the Weibull modulus of two tests conducted with the same configuration, a higher Weibull modulus is associated with a higher reliability for a test (i.e. sample preparation + mechanical testing) compared to the other one for the evaluation of the adherence. TheFig. 7shows an example of Weibull plots obtained with the three tests on an abraded and primed surface with sol-gel and
Table 2shows the calculated Weibull moduli following the Eq.(1)and the estimator given in the (Eq. (3), for each tested configuration ac-cording to the three different tests. Let us note that the slopes of the
Fig. 7are reported as bold and underlined values on theTable 2. The horizontal reading ofTable 2can give information about the surface preparation effect on the reliability. It can be noticed that the Weibull modulus is higher for primed samples. It is especially the case for samples with sol-gel: on average, the Weibull modulus is 6.5 for Cr-primer samples and 8.4 with sol-gel. On the other hand, there has been no apparent relationship between the surface treatment and the Weibull moduli: on average, m give 6.6 for HCl, 7.0 for abrasion and 6.6 for Degreasing/HNO3surface treatment. In other words, a good surface
preparation (i.e. a good surface treatment combined with a good primer application) not only increases the load at break FMaxbut it also
in-creases the reliability of the results.
A vertical reading ofTable 2gives information about the effect of the adherence test on the results reliability. For any surface
preparation, the highest Weibull moduli m are given for Three-Point Bending test (7.6 on average). Concerning the two other adherence tests (i.e. SLJ and Pull-Off test), the tendency is not always the same: the highest m value is given by SLJ for abraded and HCl surface treatment and given by the Pull-Off test for degreasing/HNO3samples. In other
words, the most reliable adherence test is the Three-Point Bending test. 3.3.2. Principal Component Analysis
In order to confirm if the three variables (i.e. the three test results) are correlated (i.e. measure the fracture initiation in the same way), a principal component analysis was performed. The objective is to qualify the robustness of the adherence. Thus, theFig. 8can be representative of the robustness of the adherence test whileFig. 9represents the ro-bustness of the surface preparation. Now, let us consider theFig. 8, showing the active variables (calculated from the average FMax) in
function of PC1 and PC2, orthonormal to each other.
SLJ and Three-Point Bending test results are strongly correlated to the principal component 1 (around 10° from the PC1 axis). Then, SLJ and Three-Point Bending test results appear to be correlated as an angle of 5° can be observed between the two variables, whereas the Pull-Off test results are nearly totally non-correlated with the two others (more than 45°). In other words, by using Pull-Off or SLJ/Three-point-bending tests, the measured properties are totally different. It can be supposed that the principal component 1 (PC1) represents the fracture initiation (i.e. adherence) when the PC2 can represent the intrinsic mechanical properties of the adhesive (i.e. cohesion). As a reminder, the fracture
Fig. 6. (A) Single Lap Joint and Pull-Off loads at break expressed in function of Three-Point Bending load at break; (B) Pull-Off loads at break expressed in function of SLJ loads at break.
Fig. 7. Weibull plot of the three tests according to abraded and primed with sol-gel samples.
initiation observed after SLJ and Three-Point Bending test was ad-hesive, when the fracture initiation was either adhesive or unknown concerning the Pull-Off test. Concerning the axis 2 (PC2), the SLJ and Three-Point Bending (negative correlation) can be opposed to the Pull-Off (positive correlation). Thus, it is an opposition axis between mea-surement of the intrinsic properties of the adhesive (i.e. cohesion) and the pure adherence.
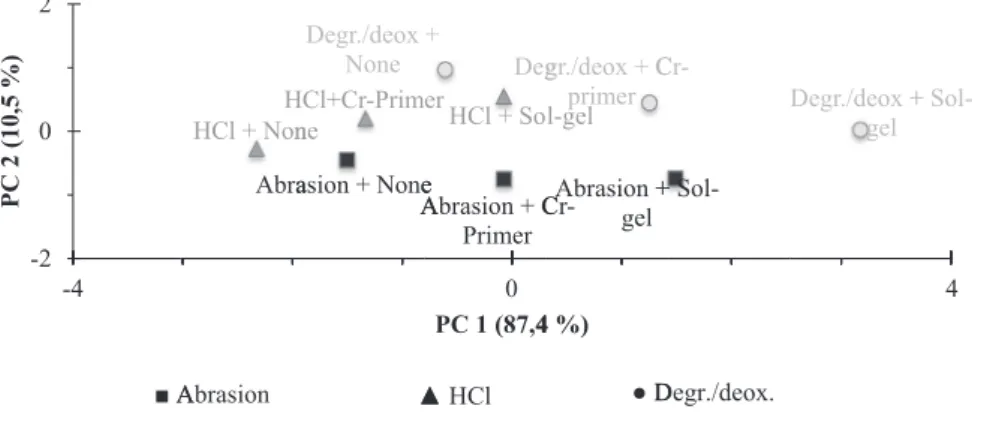
TheFig. 9shows the individuals plot in function of the PC1 and PC2, in order to explain the meaning of PC1 and PC2. In this figure, the correlation between PC1 and PC2 is expressed for each surface pre-paration (surface treatment and primer application). Thus, for a parti-cular point, for example "HCl + None", all the data collected are those in Lap Single Lap Joint, Pull-off and Three-Point Bending tests.
It can be firstly noticed that the individuals are strongly correlated to PC1. The correlation of the results following the axis PC1 leads up to the same tendency and results as the FMaxstudy (seeFig. 5and
asso-ciated section). Thus, it can be considered that PC1 represents the ad-herence. Regarding the axis 2, the interpretation is more difficult, but it likely represents the intrinsic mechanical properties of the adhesive (i.e. cohesion). Even if at first, there does not seem to be a correlation be-tween the primer application and PC2, if combined with fracture in-itiation (seeFig. 5), it can be noticed that when the fracture initiation is
unknown, the correlation with PC2 is more important. Finally,Fig. 9
shows the robustness of the surface treatments. A robust surface treatment is a treatment of which dependence on PC1 is the most im-portant and of which the dependence on PC2 is close to 0. Here, the most robust surface treatment is Degr./Deox. + Sol-gel.
4. Conclusion
In this paper, three tests were used to study the adherence of an epoxy-amine “model” adhesive bonded onto an AA 2024-T3 surface, having been treated in nine different ways. After testing, the load at break FMax, the variability of the results as well as the failure mode were
studied. Then, two statistical study analyses in accordance with the Weibull analysis and the Principal Component Analysis (PCA) have been conducted.
Regarding the surface treatment, it has been shown that the load at break was increased with an abraded surface compared to a simple Hydrochloric acid etching, and even better with a degreasing followed by nitric acid deoxidizing. In the same way, the application of a primer increased the load at break, as well as the reliability. The comparison of the three adherence tests has been made. It has been noticed that the fracture initiation was always adhesive for SLJ (Mode II or I + II) and Three-Point Bending test (Mode I), and unknown for the Pull-Off test (Mode II). Despite this difference, the same tendency has been observed between the three adherence tests. Let us note that the measurement scale is more important for SLJ and Three-Point Bending test leading us to a better differentiation between the various adherence levels. However, the Pull-Off test remains efficient as a routine test because the mechanical response does not depend on the thickness of the adhesive or the substrate, provided that the substrate is thick enough not to be deformed during the test (i.e. try out various adhesive systems and various substrates).
The Weibull analysis showed that the more reliable test was the Three-Point Bending test, in comparison with the SLJ and Pull-Off test. Thanks to the PCA, it has been shown that the Pull-Off test measures the balance between the intrinsic properties (i.e. cohesion) and the ad-herence of the adhesive, when the SLJ and Three-Point Bending tests are only measuring the adherence.
Table 2
Experimental Weibull moduli (m) with an associated error of maximum 5% for all the tested surface preparation according to the three adherence tests.
HCl Abrasion Degreasing/HNO3
None Cr-primer Sol-gel None Cr-primer Sol-gel None Cr-primer Sol-gel
Pull-Off 4.0 6.5 8.6 5.9 5.8 5.6 7.4 8.4 8.2 SLJ 4.4 5.5 8.8 6.0 5.9 6.9 2.3 4.9 8.0 Three-Point Bending 4.4 5.8 11.4 8.4 9.4 9.5 4.1 6.7 9.9 -1 0 1 -1 PC2 (10,5 % ) 0 PC1 (87,4 %%) Pull-Of Single L (FMax) Three-P Bendin 1 ff (FMax) Lap Joint Point ng (FMax)
Fig. 8. Circle of correlations and plot of the loadings of the active variables (FMax) with principal components 1 and 2 (respectively PC1 and PC2).
Fig. 9. PCA classification of the FMaxaverage from the nine sur-face preparations.
Acknowledgement
The authors want to gratefully thank P. Floquet (Université de Toulouse, Laboratoire de Génie Chimique UMR CNRS 5503) for his suggestions and helpful discussions about statistical analysis, particu-larly for invaluable contribution to the Principal Component Analysis. References
[1] Ellis B. Chemistry and technology of epoxy resins. Dordrecht: Springer Science; 1993.
[2] Petrie EM. Handbook of adhesives and sealants. New York: Mc Gaw-Hill; 2007. [3] Shi J, Pries H, Stammen E, Dilger K. Chemical pretreatment and adhesive bonding
properties of high-pressure die cast aluminum alloy: AlSi10MnMg. Int J Adhes Adhes 2015;61:112–21.
[4] Critchlow GW, Brewis DM. Review of surface pretreatments for aluminium alloys. Int J Adhes Adhes 1996;16:255–74.
[5] Prolongo SG, Ureña A. Effect of surface pre-treatment on the adhesive strength of epoxy-aluminium joints. Int J Adhes Adhes 2009;29:23–31.
[6] Duncan B, Crocker L. Review of tests for adhesion strength. Natl Phys Lab Rep 2001. [7] Kohl JG, Singer IL. Pull-off behavior of epoxy bonded to silicone duplex coatings.
Prog Org Coat 1999;36:15–20.
[8] Roche AA, Dole P, Bouzziri M. Measurement of the practical adhesion of paint coatings to metallic sheets by the pull-off and three-point flexure tests. J Adhes Sci Technol 1994;8:587–609.
[9] Ramos NMM, Simoes ML, Delgado JMPQ, De Freitas VP. Reliability of the pull-off test for in situ evaluation of adhesion strength. Constr Build Mater 2012;31:86–93. [10] Lee M, Wang CH, Yeo E. Effects of adherend thickness and taper on adhesive bond strength measured by portable pull-off tests. Int J Adhes Adhes 2013;44:259–68. [11] Costa-Mattos HS, Monteiro AH, Sampaio EM. Modeling the strength of bonded
butt-joints. Compos Part B 2010;41:654–62.
[12] Öchsner A, Stasiek M, Mishuris G, Grácio J. A new evaluation procedure for the butt-joint test of adhesive technology: determination of the complete set of linear elastic constants. Int J Adhes Adhes 2007;27:703–11.
[13] Lee M, Yeo E, Blacklock M, Janardhana M, Feih S, Wang CH. Predicting the strength of adhesively bonded joints of variable thickness using a cohesive element ap-proach. Int J Adhes Adhes 2015;58:44–52.
[14] Da Silva LFM, Carbas RJC, Critchlow GW, Figueiredo MAV, Brown K. Effect of material, geometry, surface treatment and environment on the shear strength of single lap joints. Int J Adhes Adhes 2009;29:621–32.
[15] Da Silva LFM, Rodrigues TNSS, Figueiredo MAV, de Moura MFSF, Chousal JAG. Effect of adhesive type and thickness on the lap shear strength. J Adhes 2006;82:1091–115.
[16] Da Silva LFM. Influence of the adhesive, the adherend and the overlap on the single lap shear strength. J Adhes 2006;7:1–9.
[17] Na J, Liu Y, Cai L, Tao S, Yan Y. An adhesive joint strength evaluation method and its application in mechanical engineering. J Adhes Sci Technol 2015;30:131–44. [18] Weibgraeber P, Becker W. Finite fracture mechanics model for mixed mode fracture
in adhesive joints. Int J Solids Struct 2013;50:2383–94.
[19] Bouchet J, Roche A-A. The formation of epoxy/metal interphases: mechanisms and their role in practical adhesion. J Adhes 2002;78:799–830.
[20] Mittal KL. The role of the interface in adhesion phenomena. Polym Eng Sci 1977;17:467–73.
[21]Bouchet J, Roche AA, Jacquelin E. The role of the polymer/metal interphase and its residual stresses in the critical strain energy release rate (Gc) determined using a three-point flexure test. J Adhes Sci Technol 2001;15:345–69.
[22]Roche AA, Bouchet J, Bentadjine S. Formation of epoxy-diamine/metal interphases. Int J Adhes Adhes 2002;22:431–41.
[23]Weibull W. A statistical distribution function of wide applicability. J Appl Mech 1951;18:293–7.
[24]Ben Salem N, Bresson G, Jumel J, Shanahan MER, Bellut S, Lavelle F. Weibull analysis of stiffness and strength in bulk epoxy adhesives reinforced with particles. J Adhes Sci Technol 2013;27:2278–95.
[25]Arenas JM, Narbon JJ, Alia C. Optimum adhesive thickness in structural adhesives joints using statistical techniques based on Weibull distribution. Int J Adhes Adhes 2010;30:160–5.
[26]Seo DW, Lim JK. Tensile, bending and shear strength distributions of adhesive-bonded butt joint specimens. Compos Sci Technol 2005;65:1421–7.
[27]Leigh SH, Berndt CC. A test for coating adhesion on flat substrates – a technical note. J Therm Spray Technol 1994;3:184–90.
[28]Wang TT, Ryan FW, Schonhorn H, Telephone B. Effect of bonding defects on shear strength in tension of lap joints having brittle adhesives. J Appl Polym Sci 1972;16:1901–9.
[29]Banea MD, da Silva LFM, Campilho RDSG. The effect of adhesive thickness on the mechanical behavior of a structural polyurethane adhesive. J Adhes
2015;91:331–46.
[30]Kim H. The influence of adhesive bondline thickness imperfections on stresses in composite joints. J Adhes 2003;79:621–42.
[31]Silva TC, Nunes LCS. A new experimental approach for the estimation of bending moments in adhesively bonded single lap joints. Int J Adhes Adhes 2014;54:13–20. [32]Zhao X, Adams RD, da Silva LFM. A new method for the determination of bending
moments in single lap joints. Int J Adhes Adhes 2010;30:63–71.
[33]Lee JY, Choi HK, Shim MJ, Kim SW. Kinetic studies of an epoxy cure reaction by isothermal DSC analysis. Thermochim Acta 2000;343:111–7.
[34]Sauvage J-B, Aufray M, Jeandrau J-P, Chalandon P, Poquillon D, Nardin M. Using the 3-point bending method to study failure initiation in epoxide-aluminum joints. Int J Adhes Adhes 2017;75:181–9.
[35]Bergman B. On the estimation of the Weibull modulus. J Mater Sci Lett 1984;3:689–92.
[36]Pobočíková I, Sedliačková Z. Comparison of four methods for estimating the Weibull distribution parameters. Appl Math Sci 2014;8:4137–49.
[37]Sadowski Ł, Nikoo M, Nikoo M. Principal component analysis combined with a self organization feature map to determine the pull-off adhesion between concrete layers. Constr Build Mater 2015;78:386–96.
[38]Zhang J, Zhao X, Zuo Y, Xiong J, Zhang X. Effect of surface pretreatment on ad-hesive properties of aluminum alloys. J Mater Sci Technol 2008;24:236–40. [39]Boutar Y, Naïmi S, Mezlini S, Ali MBS. Effect of surface treatment on the shear
strength of aluminium adhesive single-lap joints for automotive applications. Int J Adhes Adhes 2016;67:38–43.
[40]Rider AN, Arnott DR. Boiling water and silane pre-treatment of aluminum alloys for durable adhesive bonding. Int J Adhes Adhes 2000;20:209–20.
[41]Zain NM, Ahmad SH, Ali ES. Effect of surface treatments on the durability of green polyurethane adhesive bonded aluminium alloy. Int J Adhes Adhes 2014;55:43–55. [42]Öchsner Andreas, Grácio J. An evaluation of the elastic properties of an adhesive
layer using the tensile-butt joint test: procedures and error estimates. Int J Adhes Adhes 2007;27:129–35.
[43]Bresson G, Jumel J, Shanahan MER, Serin P. Statistical aspects of the mechanical behaviour a paste adhesive. Int J Adhes Adhes 2013;40:70–9.