O
pen
A
rchive
T
OULOUSE
A
rchive
O
uverte (
OATAO
)
OATAO is an open access repository that collects the work of Toulouse researchers and
makes it freely available over the web where possible.
This is an author-deposited version published in :
http://oatao.univ-toulouse.fr/
Eprints ID : 16715
To link to this article : DOI:10.1080/13640461.2016.1142238
URL :
http://dx.doi.org/10.1080/13640461.2016.1142238
To cite this version : Lacaze, Jacques and Sertucha, Jon Effect of Cu,
Mn and Sn on pearlite growth kinetics in as-cast ductile irons. (2016)
International Journal of Cast Metals Research, The, vol. 29 (n° 1-2).
pp. 74-78. ISSN 1364-0461
Any correspondence concerning this service should be sent to the repository
administrator:
[email protected]
Effect of Cu, Mn and Sn on pearlite growth
kinetics in as-cast ductile irons
J. Lacaze
*1and J. Sertucha
2In a previously published work, pearlite growth in cast irons was investigated and it was claimed that
growth kinetics of pearlite in nodular cast iron does not depend on alloying elements and that only
the start temperature for the transformation is modified. Since then, the authors have investigated the
effect of copper at low level of manganese and the combined effect of copper and tin at intermediate
manganese contents. In the first case, thermal records confirmed that copper decreases the formation
temperature for both ferrite and pearlite. In the second work, an optimised content for tin, manganese
and copper was found so as to improve mechanical properties while keeping fully pearlitic structures.
The thermal records obtained during this latter study are here used to estimate the pearlite growth
kinetics and the effect of copper and tin on it. Tin has been shown to reduce pearlite undercooling
(increase of start transformation temperature) and thus to favour the formation of this constituent.
Keywords: Ductile irons, Pearlite growth, Copper, Manganese, Tin, Eutectoid transformation
Introduction
In common ductile cast irons, a fully pearlitic matrix is achieved by varying the cooling rate and/or adding elements that favour the metastable (pearlitic) instead of the stable (fer-ritic) eutectoid reaction. This latter alternative is most often used in industrial practice for producing fully pearlitic cast-ings either slowly cooled or having areas submitted to very different cooling rates. Copper, manganese and tin are the elements most used to achieve fully pearlitic microstructure, though their use should be limited to the exact need to avoid additional costs and defects such as carbides and graphite degeneracy.
In a previous review on pearlite growth in cast irons,1
anal-ysis of literature data2,3 showed that growth kinetics of pearlite
in nodular cast iron does not depend on alloying elements and that only the start temperature for the transformation is modified by alloying. This result stressed the importance of the nucleation step of pearlite in the competitive growth of the metastable and stable eutectoids.
Since then, the authors have investigated the effect of cop-per at low level of manganese4 and it was effectively found
that an increase of copper content in the alloy decreases the temperature for the start of ferrite and pearlite formation. However, the pearlite promoting effect of this element was found to be weak, below a critical content (around 0.6 wt.%) where a sharp increase of pearlite fraction was detected. This was related to the decrease of the temperature for formation of ferrite and the associated decrease of the rate of austenite decomposition in the stable system because carbon diffusion in ferrite becomes very sluggish as the temperature drops
down. In a second work, the authors studied the combined effect of copper and tin at intermediate manganese content.5
In this investigation, increasing copper addition again proved to decrease the temperature for the start of the ferritic and pearlitic reactions while no attempt was made to look for any such effect of tin. Furthermore, looking at the cross effects of copper, manganese and tin, it was found possible to pro-pose a tin-equivalent Sneq based on the final microstructure of the castings. However, it appears of interest to perform a more quantitative investigation of these results accounting for nucleation and growth kinetics. The thermal records obtained during the most recent study5 are here used to estimate the
effect of alloying with Sn and Cu on pearlite growth kinetics at constant Mn content.
Experimental details
In this previous work5 a series of six alloys was prepared with
a constant manganese content at 0.6 wt.%, various contents in copper, 0.5, 0.7 and 0.9 wt.%, and two tin levels, 0.05 wt.% (labelled Sn0.05 series) and 0.1 wt.% (labelled Sn0.1 series). These compositions were selected so as to ensure a fully pearlitic matrix in the as-cast condition. From each of these melts, three standard keel blocks (UNE EN-1563 Type II), two standard thermal analysis (TA) cups and a sample for chemical analysis were cast. Two of the keel blocks were equipped with a K-type thermocouple located at the geometrical centre, while the third keel block was removed from the mould little after solidification was completed so as it cooled down to room temperature under calm air. These latter keel blocks will not be used here, as they were not equipped for thermal record.
The compositions in the main elements of the six alloys are listed in Table 1 where the corresponding Sneq values are also indicated, according to the equation Sneq = 0.0725
· wMn + 0.125 · wCu + wSn.5 It is seen that all Sn
eq values are
DOI 10.1179/1743133615Y.0000000031
*Corresponding author, email [email protected]
1CIRIMAT, Université de Toulouse, ENSIACET, Toulouse, France
2Área de Ingeniería, I+D y Procesos Metalúrgicos, IK4-Azterlan, Durango,
above the critical value of 0.13 wt.% over which a fully pearl-itic matrix is expected for the used cooling conditions. The Tp
values that appear also in Table 1 are estimates of the lower temperature of the three-phase ferrite-austenite-cementite field, i.e. the temperature at which pearlite is expected to be able to start growing upon cooling.6 The way this estimate
was obtained is detailed in the discussion section.
For each alloy, cooling curves were simultaneously recorded from the two TA-cups and the two instrumented keel blocks. All these thermal records were then differenti-ated with respect to time in order to determine the onset of the eutectoid transformation as already described.4 In order
to decrease the physical noise on the derivative curves, a smoothing by moving average was applied to the data, con-sidering five successive points for TA-cups and ten for keel blocks. The start and end of austenite decomposition could easily be detected at the point where the record deviates from the baseline on the high temperature side (start of transforma-tion) or when it reaches the baseline on the low temperature side (end of transformation), see the results section for exam-ple. Transformation kinetics was then evaluated by simple integration of the area between the record and the line joining the start and end points.
Results
TA-cup records on the Sn0.05 series showed time to reach 675 °C of about 800 s while it was 1100 s for Sn0.1 series. In either series, the overall reproducibility was very high meaning that the curves could appear all superimposed at the scale illustrated with Fig. 1a. The second curve of alloys
#1 and #2 (series Sn0.5) showed however a slightly higher cooling rate after the eutectoid transformation than the four other records. In the case of the keel blocks, the overall cool-ing rate durcool-ing the second record was systematically higher than for the first one, but either series of first records and of second records showed high reproducibility as illustrated in Fig. 1b for alloys #1–#3.
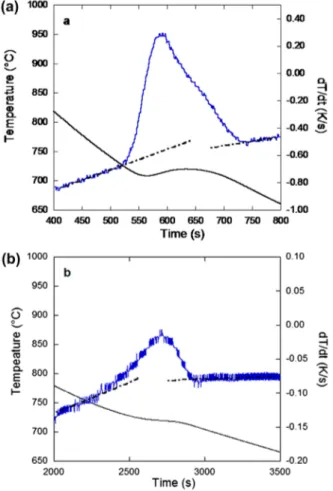
Fig. 2 shows an example of thermal record in the eutec-toid range, together with the derivative of this record, for a TA-cup (a) and a keel block (b) for alloy #1 in both cases. After smoothing by moving average, the baselines before and after the transformation are drawn by hand and the tempera-tures for the start (Tstart) and the end (Tend) of the transformation are evaluated.
Though simple in principle as illustrated with Fig. 2, the determination of the start transformation temperatures appeared easy for TA-cup records and much more difficult for keel blocks because of the remaining noise. The end transformation temper-ature was easily determined in both cases as the base line was better defined. Table 2 gives the data collected, the cooling rate (Vr) calculated between 800 and 760 °C and the start transfor-mation temperature (Tstart). Note that the thermocouple of the
second keel block of alloy #4 failed during casting.
The Tstart values have been plotted in Fig. 3. It is first seen that the values are quite scattered, i.e. the characteristic tem-perature obtained for one alloy in seemingly identical condi-tions may differ by as much as 20 °C for alloys 1–3 (Sn0.05 series) and 10 °C for alloys #4–#6 (Sn0.1 series). These values are nevertheless in the range of scattering of the data previ-ously observed.4
The effect of Cu and Sn on transformation kinetics could be studied by selecting thermal records having strictly similar characteristics, in particular the same cooling rate before and after the eutectoid transformation. Thus, the effect of Cu could be investigated for example by comparing the results for the first TA-cup of the series Sn0.05, as illustrated in Fig. 4a. It is
seen that an increase in copper content slightly decreases the transformation temperature, and thus shifts the transformation curve to slightly longer times. On the contrary, the copper
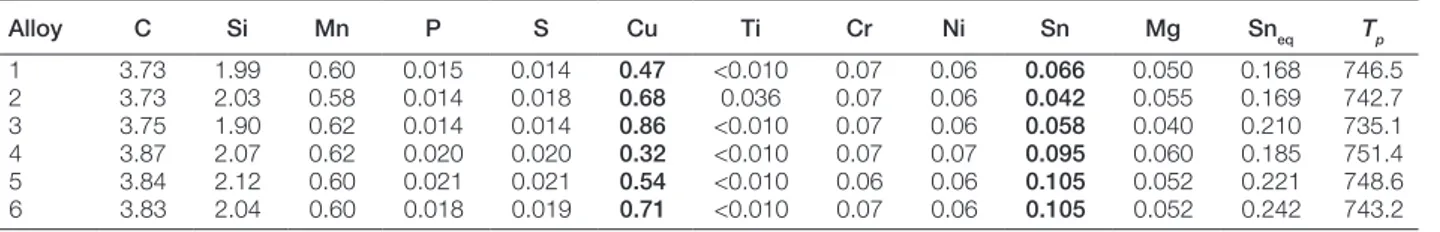
Table 1 Chemical analyses of the alloys (wt.%), values of Sneq (wt.%) and of Tp (°C)
Alloy C Si Mn P S Cu Ti Cr Ni Sn Mg Sneq Tp 1 3.73 1.99 0.60 0.015 0.014 0.47 <0.010 0.07 0.06 0.066 0.050 0.168 746.5 2 3.73 2.03 0.58 0.014 0.018 0.68 0.036 0.07 0.06 0.042 0.055 0.169 742.7 3 3.75 1.90 0.62 0.014 0.014 0.86 <0.010 0.07 0.06 0.058 0.040 0.210 735.1 4 3.87 2.07 0.62 0.020 0.020 0.32 <0.010 0.07 0.07 0.095 0.060 0.185 751.4 5 3.84 2.12 0.60 0.021 0.021 0.54 <0.010 0.06 0.06 0.105 0.052 0.221 748.6 6 3.83 2.04 0.60 0.018 0.019 0.71 <0.010 0.07 0.06 0.105 0.052 0.242 743.2
1 a Comparison of the two TA-cup thermal records for alloy #2; b records from the two keel blocks for all three alloys of the Sn0.05 series (first and second keel blocks are differentiated by the overall cooling time, see text)
content has no clear effect on the transformation kinetics which appears very similar from one sample to another.
Fig. 4b shows the effect of tin in the case of alloys with
0.5 wt.% Cu (#1 and #5) on the records from keel blocks. As already reported,3 it is clearly seen that an increase in
Sn content from 0.05 to 0.1 wt.% increases significantly the transformation temperature. Again, and as already claimed,1
it also appears clearly that the transformation kinetics is not significantly affected by this increase in Sn content.
Discussion
In agreement with previous work1 it is confirmed here that
pearlite promoter elements such as Cu and Sn do not affect pearlite growth kinetics, at least at the level commonly added to cast irons. Note that other elements such as Ni or Mo are known to present a partitioning between ferrite and cementite
in steels that changes with temperature,7,8 so that it would be
worth studying if they do have an effect on pearlite growth in cast irons. The most important result in the present work concerns the temperature for the start of the pearlitic trans-formation, this is detailed below.
Equations for the expected stable and metastable start transformation temperatures have been proposed that express these temperatures as a function of matrix composition.6 To 2 Example of temperature-time records and of their derivative
for a TA-cup a and a keel-block b cast with alloy #1 Table 2 Cooling rate Vr (K/min) and start transformation
temperature Tstart (°C) for all samples
Alloy TA-cup #1 TA-cup #2 Keel-block #1 Keel-block #2
Vr Tstart Vr nt Vr Tstart Vr Tstart
1 47.0 727.9 47.1 715.5 8.40 745.6 11.50 736.1 2 47.1 729.6 45.3 729.7 9.16 745.3 13.14 744.6 3 48.0 729.5 48.0 717.6 9.30 730.2 13.10 729.6 4 33.3 736.5 33.8 737.0 8.82 744.4 5 33.3 749.8 32.9 742.9 8.33 749.4 12.24 737.0 6 33.3 732.9 32.9 744.3 8.60 738.6 12.20 737.7
3 Start transformation temperature for the six alloys and the four records (two TA-cups and two keel blocks for each alloy)
4 Example of the effect of Cu content a and Sn content b on the eutectoid transformation kinetics
agree with the regression line previously obtained, and show lower undercooling than for alloys having first partly trans-formed to ferrite. This shift in undercooling is certainly related to microsegregation effects, but this assumption would be worth of further investigation. This shift could explain as well, part of the scatter of the data for ferritic-pearlitic alloys previously studied4 but this does not change the conclusion
concerning the necessary undercooling for pearlite formation in alloys with low level of Sn.
consider the effect of Sn on these temperatures, it is noted that this element appears as a ferrite stabiliser according to the phase diagram,9 in much the same way as silicon does.
The slope of the gamma loop in the low temperature range was thus used to estimate the effect of Sn on the eutectoid transformation, which amounts to 21 K/wt-% Sn. This value is very much comparable to the effect of Si on the gamma loop in the Fe–Si system. The equation for the start of pearlitic transformation given previously6 can thus be complemented
to account for Sn and writes:
where wi stands for the content in ‘i’ element in the matrix. This wi value is obtained by multiplying the nominal content of the alloy by 1.05 to account for graphite fraction at about 11% as already indicated.6 The T
p values calculated for the
present alloys according to equation (1) are listed in Table 1. It is then of interest to plot the temperature difference between the calculated Tp and the experimental values recorded for the transformation start (Tstart), i.e. the undercool-ing for pearlite formation. The values thus obtained are plotted in Fig. 5 vs. the cooling rate Vr (listed in Table 2). As expected, it is seen that the undercooling of the transformation increases with cooling rate, i.e. the transformation start temperature decreases with increased cooling rate. In the low cooling rate range, negative values of undercooling are observed which should be seen as resulting from experimental inaccuracies which can be evaluated at about ±5 °C according to Fig. 2. In the same range, it is also observed that the undercooling values for low and high Sn contents are all similar which may be associated with the fact that the Sn term introduced in equation (1) compensates for the differences seen in Fig. 3.
In Fig. 6, the solid line relates to the evolution of the undercooling with cooling rate for pearlite start according to a previous work.4 The alloys investigated in this former study
contained various amounts of copper (0.1–0.95 wt.%), low levels of manganese (0.1–0.2 wt.%) and no tin. As stressed earlier,4 these results show that pearlite starts undercooling
extrapolates to a value of about 40 K at zero cooling rate. In other words, a minimum undercooling of 40 K is necessary before pearlite nucleation in alloys without tin.
Some results relevant for the present study were found in the recent work by Samuel and Viswanathan10 who studied
the solid state transformation of two alloys in a large range of cooling rates. The compositions of these alloys are given in Table 3 where the calculated Tp temperatures estimated as above – equation (1) – are also listed. It is seen that they contain a small amount of tin, but yet present a Sneq value much lower than the critical value of 0.13 wt.% mentioned above. Accordingly, these alloys undergo both a ferritic and a pearlitic transformation at low cooling rate while they are fully pearlitic at high cooling rate. The start of pearlite growth obtained by Samuel and Viswanathan10 has been plotted in
Fig. 6 with plus signs and crosses when some ferrite appeared and with open symbols when only pearlite formed. It is seen that the data for pearlite appearance at high cooling rate do
(1)
Tp=727 + 21.6⋅ wSi+0.023⋅ (wSi)2−21.0⋅ wCu −25.0⋅ wMn+8.0⋅ wMo+13.0⋅ wCr
−33.0⋅ wNi+21.0⋅ wSn
Table 3 Chemical analyses of the alloys investigated by Samuel and Viswanathan. 10
Alloy C Si Mn Cu Cr Ni Mo Sn Sneq Tp
Laboratory heat 3.94 2.38 0.32 0.028 n.a. n.a. n.a. 0.015 0.042 772.4
65-45-12 3.74 2.49 0.25 0.164 n.a. n.a. 0.251 0.012 0.051 776.7
5 Pearlite undercooling with respect to the calculated Tp temperature for the start of austenite transformation to pearlite vs. the cooling rate Vr (see text)
6 Comparison of pearlite undercooling vs. the cooling rate for different sets of alloys: crosses and plus symbols correspond to alloys with ferrite and pearlite,10 open squares and circles represent fully pearlitic alloys10 and solid dots show the results of the present work. The solid line relates to undercooling for pearlite formation in alloys without Sn,4 and the interrupted line is the same but shifted to a zero undercooling for a zero cooling rate, and is seen to fit with present data
rate. However, extrapolation of the data to a zero cooling rate leads to a zero undercooling for alloys with 0.05 wt.% Sn or more as studied in the present work. This is in contradistinc-tion with previous results that showed a necessary minimum undercooling of about 40 °C for alloys without Sn or at low Sn level. In other words it is suggested that the main role of Sn as a pearlite promoter is to strongly reduce the minimum undercooling for pearlite nucleation.
References
1. J. Lacaze: ‘Pearlite growth in cast irons: a review of literature data’, Int.
J. Cast Met. Res., 1999, 11, 431–436.
2. M. J. Lalich and C. R. Loper: ‘Effects of pearlite promoting elements on the kinetics of the eutectoid transformation in ductile cast irons’, AFS
Trans., 1973, 79, 217–228.
3. E. N. Pan, M. S. Lou and C. R. Loper: ‘Effects of Cu, Sn, and Mn on the eutectoid transformation of graphitic cast irons’, AFS Trans., 1987,
95, 819–840.
4. J. Sertucha, P. Larrañaga, J. Lacaze and M. Insausti: ‘Experimental investigation on the effect of copper upon the eutectoid transformation of as-cast and austenitized spheroidal graphite cast iron’, Int. J. Metalcast., 2010, 4, 51–58.
5. J. Lacaze, J. Sertucha, P. Larrañaga and R. Suárez: Proc. “Word Foundry Congress”, Monterrey, Mexico, 2012, The organizers were Sociedad mexicana de fundidores (SMF) and La Camaranacional de la industria de la transformacion (CANACINTRA). “available upon request to the authors”.
6. V. Gerval and J. Lacaze: ‘Critical temperatures of spheroidal graphite cast irons: a review of literature data’, ISIJ Int., 2000, 40, 386–392. 7. M. P. Puls and J. S. Kirkaldy: ‘The pearlite reaction’, Metall. Trans.,
1972, 3, 2777–2796.
8. M. Hillert: Proc. Int. Conf. “Solid/solid phase transformations”, Pittsburg, TMS, 1981, 789–806
9. ‘Binary phase diagrams’, ASM specialty handbook, ASM International, The Materials Information Society.
10. C. Samuel and S. Viswanathan: ‘Determination of transformation kinetics and ferrite-pearlite ratios in ductile iron castings’, AFS Trans., 2009, 117, 573–586.
In Fig. 6, the solid dots are the same data as in Fig. 5. They definitely show that pearlite grows in Sn-bearing alloys with much smaller undercooling than in the case of alloys with no Sn or low level in this element, and that this undercooling seems to extrapolate to zero with decreasing cooling rate. This has been stressed in the graph by drawing the dotted line that is the same as the solid line but shifted to a zero undercooling for zero cooling rate. This should be indicative that addition of Sn suppresses the nucleation barrier for pearlite formation, and most probably by strongly decreasing the nucleation bar-rier for cementite precipitation.
It has been reported previously that, at given cooling con-ditions, the ferrite fraction drops abruptly at a certain level of Cu or Sn added, about 0.6 wt.% Cu4 and 0.05 wt.% Sn.5
This could well explain the difference in behaviour shown by the alloys investigated by Samuel and Viswanathan10 and the
alloys studied in the present investigation because the former ones behave as alloys without Sn.
Conclusions
The present work presented first a short review of phase transfor-mations that occur during the eutectoid reaction of ductile cast irons with different Cu, Sn and Mn contents. For further ana-lysing the effect of alloying on pearlite growth kinetics, thermal records obtained from standard TA-cups and keel blocks cast using a set of six alloys with varying Cu and Sn contents have been studied. Following previous analysis, it is confirmed that pearlite growth kinetics remains unchanged when the amount in these elements is varied within commonly used values.
As expected, it was also observed that the temperature for the start of pearlite growth does decrease with cooling rate, meaning that the undercooling with respect to the appro-priate reference temperature, Tp, does increase with cooling