En vue de l'obtention du
DOCTORAT DE L'UNIVERSITÉ DE TOULOUSE
Délivré par :
Institut National Polytechnique de Toulouse (Toulouse INP)
Discipline ou spécialité :
Informatique et Télécommunication
Présentée et soutenue par :
M. MATTHIEU PIZENBERG
le vendredi 28 février 2020
Titre :
Interactive Computer Vision through the Web
Ecole doctorale :
Mathématiques, Informatique, Télécommunications de Toulouse (MITT)
Unité de recherche :
Institut de Recherche en Informatique de Toulouse ( IRIT)
Directeur(s) de Thèse :
M. VINCENT CHARVILLAT M. AXEL CARLIER
Rapporteurs :
M. MATHIAS LUX, ALPEN ADRIA UNIVERSITAT Mme VERONIQUE EGLIN, INSA LYON
Membre(s) du jury :
Mme GÉRALDINE MORIN, TOULOUSE INP, Président M. AXEL CARLIER, TOULOUSE INP, Membre
M. CHRISTOPHE DEHAIS, ENTREPRISE FITTINGBOX, Membre M. OGE MARQUES, FLORIDA ATLANTIC UNIVERSITY, Membre
Acknowledgments
First I’d like to thank my advisors Vincent and Axel without whom that PhD would not have been possible. I would also like to thank Véronique and Mathias for reviewing this manuscript, as well as the other members of the jury, Oge, Géraldine and Christophe for your attention, remarks and interesting discussions during the defense. Again, a special thank you Axel for all that you’ve done, throughout this long period and even before it started. I haven’t been on the easiest path toward completion of this PhD but you’ve always been there to help me continue being motivated and that’s what mattered most!
Wanting to begin a PhD certainly isn’t a one-time moment, but for me, the feeling probably started during my M1 internship. I was working in the VORTEX research team (now REVA) on a project with Yvain and Jean-Denis and it was great! Yet “I don’t think so” was more or less what I kept answering to my teachers when they would ask if I wished to start a PhD at that time. And it lasted until almost the end of my M2 internship in Singapore, when working on a project to transfer research to a product. The internship and my first experience in Singapore was great and I’d like to especially thank Axel, Vincent, Thanh, Nizar and Igor for that. It was at that period I realized this is what I wanted!
As a consequence, a significant time of this PhD was spent in Singapore. It is at the origin of all the visual odometry part of this thesis. I’d like to thank Mounir, Xiong Wei and Janice in addition to my supervisors who made that possible. I also met amazing friends there without whom this would have been a much different experience. Justin, Yolanda, Thomas, Ariane, Flo, Bastien, Clovis, Martin, Ana and Joaquim thank you!
The major part of my PhD was spent in Toulouse, surrounded by wonderful colleagues and friends. Some of them became futsal mates, running partners, Tarot and Belotte players, oxidizers (increasing my amount of Rust), temporary flatmates, gaming friends, and night watchers (on TV as well as in bars!). In the lab, it’s all the little things, from Super AdMinistrative powers to team workshops or even Thursday burgers, that add up to form a very welcoming and enjoying working environment. Outside the lab, I’ve been lucky to meet all my friends in Toulouse and I hope that I’ll be able to keep in touch. Jean-Denis, Yvain, Simone, Géraldine, Sylvie, Pierre, Charlie, Sam, Axel, Vincent C, Vincent A, Thibault, Bastien, Chafik, Arthur, Julien, Paul, Thomas, Matthieu, Thierry, Damien, Sonia, Jean, Richard, Simon, Patrick, Alison, Etienne, Antoine, Matthias, Nicolas, Korantin thank you
all! A dedication also to the friends that helped me becoming who I am before joining the pink city, Yanis, Alexandre, Alain, Baptiste, Bastien, Océane and Alice thank you!
Finally, I would like to thank my family for always encouraging me and giving me the means to pursue that science quest of mine. En particulier, merci Papa, Maman.
Abstract
Computer vision is the computational science aiming at reproducing and improving the ability of human vision to understand its environment. In this thesis, we focus on two fields of computer vision, namely image segmentation and visual odometry and we show the positive impact that interactive Web applications provide on each.
The first part of this thesis focuses on image annotation and segmentation. We introduce the image annotation problem and challenges it brings for large, crowdsourced datasets. Many interactions have been explored in the literature to help segmentation algorithms. The most common consist in designating contours, bounding boxes around objects, or interior and exterior scribbles. When crowdsourcing, annotation tasks are delegated to a non-expert public, sometimes on cheaper devices such as tablets. In this context, we conducted a user study showing the advantages of the outlining interaction over scribbles and bounding boxes. Another challenge of crowdsourcing is the distribution medium. While evaluating an interaction in a small user study does not require complex setup, distributing an annotation campaign to thousands of potential users might differ. Thus we describe how the Elm programming language helped us build a reliable image annotation Web application. A highlights tour of its functionalities and architecture is provided, as well as a guide on how to deploy it to crowdsourcing services such as Amazon Mechanical Turk. The application is completely open-source and available online.
In the second part of this thesis we present our open-source direct visual odometry library. In that endeavor, we provide an evaluation of other open-source RGB-D camera tracking algorithms and show that our approach performs as well as the currently available alternatives. The visual odometry problem relies on geometry tools and optimization techniques traditionally requiring much processing power to perform at realtime framerates. Since we aspire to run those algorithms directly in the browser, we review past and present technologies enabling high performance computations on the Web. In particular, we detail how to target a new standard called WebAssembly from the C++ and Rust programming languages. Our library has been started from scratch in the Rust programming language, which then allowed us to easily port it to WebAssembly. Thanks to this property, we are able to showcase a visual odometry Web application with multiple types of interactions available. A timeline enables one-dimensional navigation along the video sequence. Pairs of image points can be picked on two 2D thumbnails of the image sequence to realign cameras and correct drifts. Colors are also used to identify parts of the 3D point cloud, selectable to reinitialize camera positions. Combining those interactions enables improvements on the tracking and 3D point reconstruction results.
Contents
Introduction 1
I
Image Annotation
5
1 The Image Annotation Problem 7
1.1 Computer vision problems that require annotation . . . 9
1.1.1 Image classification . . . 9
1.1.2 Image captioning . . . 10
1.1.3 Object detection . . . 11
1.1.4 Object segmentation . . . 13
1.2 Discussion on dataset gathering . . . 14
1.2.1 Explicit vs. implicit annotation process . . . 14
1.2.2 Expert vs. non-expert annotators . . . 16
1.2.3 Quality check of annotations . . . 17
1.2.4 Annotation interaction usability . . . 18
1.3 Existing interactions for user-assisted segmentation . . . 19
2 Outlining for Segmentation 23 2.1 Introduction . . . 24
2.2 Outlining objects for interactive segmentation . . . 26
2.2.1 Outline erosion . . . 27
2.2.2 Blum medial axis algorithm . . . 28
2.2.3 Enhancing foreground with superpixels . . . 29
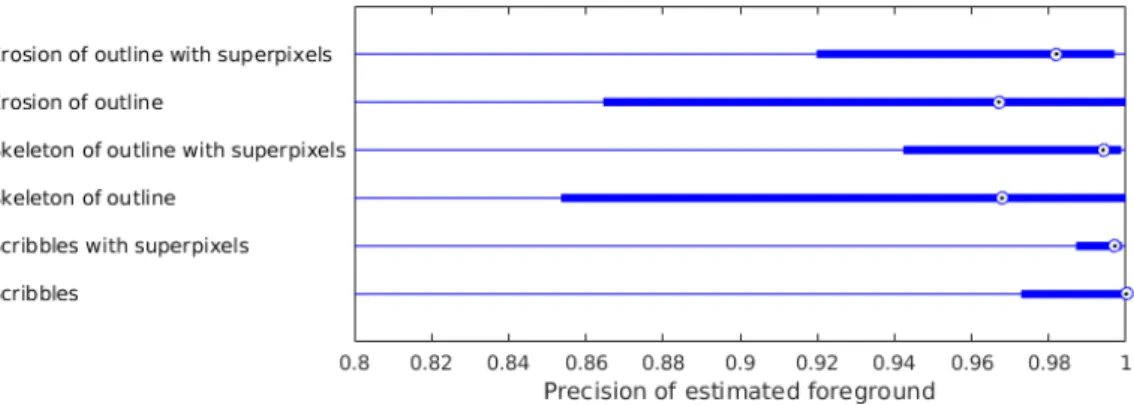
2.3 Experiments . . . 29 2.3.1 Experimental setup . . . 29 2.3.2 Usability metrics . . . 32 2.3.3 Interaction informativeness . . . 34 2.3.4 Segmentation quality . . . 36 2.3.5 Discussion . . . 37
CONTENTS
2.4 Conclusion . . . 38
3 Reliable Web Applications 39 3.1 What is the Web? . . . 40
3.1.1 What is a Web application? . . . 40
3.1.2 Rich Web Application . . . 42
3.2 JavaScript, formally known as ECMAScript . . . 42
3.2.1 Genesis of JavaScript . . . 42
3.2.2 Browser performance . . . 42
3.2.3 Explosion of JavaScript . . . 44
3.2.4 JavaScript issues . . . 45
3.2.5 JavaScript as a compilation target . . . 50
3.3 Frontend Web programming . . . 53
3.3.1 Single Page Application (SPA) . . . 53
3.3.2 Reactive programming . . . 54
3.3.3 Virtual DOM . . . 55
3.3.4 How to choose? . . . 57
3.4 Elm . . . 59
3.4.1 Pure functions . . . 59
3.4.2 Algebraic Data Types (ADT) . . . 60
3.4.3 Total functions . . . 62
3.4.4 The Elm Architecture (TEA) . . . 64
3.4.5 Elm-UI, an alternative layout strategy . . . 65
3.4.6 Reliable packages . . . 67
4 Interactive Annotation on the Web 69 4.1 Introduction . . . 70
4.2 Presentation of the application . . . 71
4.3 Technical choices . . . 73
4.3.1 The model states . . . 73
4.3.2 The messages . . . 73
4.3.3 The view . . . 75
4.3.4 Library and application duality . . . 75
4.4 Crowdsourcing annotations . . . 76
4.5 Acknowledgments . . . 76
September 5, 2020 CONTENTS
II
RGB-D Visual Odometry
79
5 Introduction to the RGB-D Visual Odometry Problem 81
5.1 Modeling Image Capture in a Camera . . . 82
5.1.1 Historic Remarks . . . 82
5.1.2 Projective Geometry . . . 82
5.1.3 Pinhole Camera Model . . . 83
5.1.4 Intrinsic Parameters . . . 84
5.1.5 Radial Distortion . . . 85
5.2 Modeling Camera Movements . . . 86
5.2.1 Origins of Visual Odometry . . . 86
5.2.2 3D Space & Rigid Body Motion . . . 86
5.2.3 The Lie Group SO(3) and Lie Algebra so(3) . . . 88
5.2.4 The Lie Group SE(3) and Lie Algebra se(3) . . . 90
5.3 Visual Odometry Approaches . . . 90
5.3.1 Capturing Device . . . 91
5.3.2 Relation to Visual SLAM . . . 92
5.3.3 Reducing Drift . . . 93
5.4 Motion Estimation . . . 94
5.4.1 Feature-Based Motion Estimation . . . 94
5.4.2 Appearance-Based Motion Estimation . . . 96
6 Performant Web Applications 101 6.1 A Brief History of Native Code in the Client . . . 102
6.1.1 Java Applets . . . 102
6.1.2 Flash . . . 104
6.1.3 Google Native Client (NaCl) . . . 104
6.1.4 Emscripten and asm.js . . . 105
6.2 WebAssembly . . . 106
6.2.1 Relation to Previous Technologies . . . 107
6.2.2 Compilation to WebAssembly . . . 108
6.2.3 WebAssembly Minimum Viable Product (MVP) . . . 108
6.2.4 WebAssembly Bright Future . . . 108
6.2.5 Why this Matters for Research . . . 109
6.3 C++ Portability Pitfalls . . . 110
6.3.1 Web Limitations . . . 110
6.3.2 Low Level Native or Architecture Specific Code . . . 110
6.3.3 No Dynamic Linking to OS Libraries . . . 110
6.4 Rust and WebAssembly . . . 111
CONTENTS
6.4.2 WebAssembly in Rust . . . 112
6.5 Conclusion . . . 112
7 Interactive Visual Odometry on the Web 115 7.1 Visual Odometry in Rust (VORS) . . . 116
7.1.1 Overview of VORS . . . 116
7.1.2 Intuition on Direct Image Alignment . . . 116
7.1.3 Sparse Points Selection . . . 118
7.1.4 Multi-Resolution Direct Image Alignment . . . 119
7.1.5 Limits of the Implementation . . . 122
7.2 RGB-D Visual Odometry Evaluation . . . 122
7.2.1 Dataset Creation / Acquisition . . . 123
7.2.2 Evaluation Metrics . . . 126
7.2.3 Setup and Algorithms Evaluation . . . 128
7.3 Interactive VORS on the Web . . . 133
7.3.1 Port of VORS to WebAssembly . . . 133
7.3.2 Interactive VORS Web Interface . . . 135
7.3.3 Human in the Loop Closure . . . 137
7.4 Conclusion . . . 140
Conclusion 141 A Gradients of Reprojection Function 145 A.1 Notation . . . 145
A.2 Reprojection Using Twist Coordinates . . . 146
A.3 Jacobian Expression . . . 146
A.4 Partial Derivatives Relative to Linear Velocity Terms . . . 147
A.5 Partial Derivatives Relative to Angular Velocity Terms . . . 148
A.6 Partial Derivatives with Normalized Coordinates . . . 149
Bibliography 151
Introduction
Computer vision is the computational science aiming at reproducing and improving the ability of human vision to understand its environment from light sensors. Throughout a somewhat unconventional, multidisciplinary journey, this document aims at answering the following question. How can we leverage user interactions and the Web platform to improve fields of computer vision such as image segmentation and visual odometry.
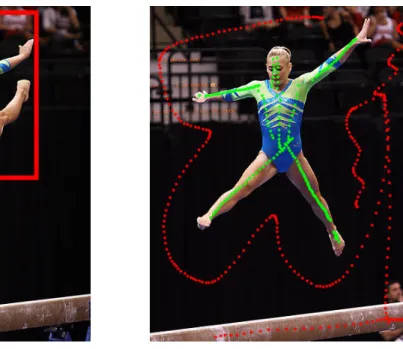
On the one hand, image segmentation (cf Figure 1) is the task of identifying precise regions in an image that are structurally or semantically different. For medical images, it could be localizing cancer cells while for urban images, differenciating people, vehicles and traffic signs. On the other hand, visual odometry consists in analyzing the video stream of a sensor such as a camera to locate and track its trajectory with regard to its environment (cf Figure 2).
Figure 1: Outlining interaction in red and resulting segmentation mask.
Thanks to improvements in imaging and algorithms, we are now able to automate tasks that were considered science-fiction until recently. For instance, some companies [142] claim to have reached level 3 of SAE classification [110], meaning that a self-driving vehicle pro-vides autonomy at limited speed, conditionned by locality and weather among other re-strictions. Nethertheless, we are still far from reaching level 5 of SAE classification which requires full autonomy in any driving condition. One non-technical reason is that owners of autonomous vehicles would be reluctant to accept liability for potential accidents like the incident of March 18, 2018, that killed Elaine Herzberg [67]. I believe that such vehicles
CONTENTS
Figure 2: Camera trajectory (purple) and sparse 3D reconstruction generated by visual odometry.
will only widespread when they are safe enough for manufacturers to bear responsability of accidents. Those capabilities depend on many research fields including object detection and segmentation of urban images, as well as visual odometry. The former is required to detect the road, understand traffic signs, avoid people, while the latter is needed to precisely record the vehicle trajectory, especially in situations where other sensors are not available or sufficiently precise, such as GPS in covered areas.
There exist many approaches for object detection and image segmentation. Today, the ones performing best rely on a field of research named machine learning. It consists in building prediction models by aggregating knowledge from databases of pairs of inputs and outputs called learning datasets. There are subtleties within the field and not all algo-rithms perform equal but a general rule is that the bigger and most accurate the learning dataset is, the best will be the detection and segmentation results. I will thus not focus on machine learning algorithms but rather on the creation of those datasets. That process is known as image annotation. Annotating an image may take different forms depending on the task, whether it is classification, object detection or segmentation. In general, it consists in people using image manipulation tools to draw rectangles, lines, polygons, and other geometric shapes to identify regions of an image and assign it a label. The Microsoft COCO dataset [136] for example contains 2.5 million labeled instances accross 328k images annotated by humans, and required over 22 hours per thousand segmentations. For a French worker, 35h a week, 228 day a year, this represents approximately 35 years, almost a full career devoted to that single task. It is thus understandable that building such datasets must be carefully thought of.
September 5, 2020 CONTENTS
Chapter 1 introduces in more details the image annotation problem and challenges it brings for large, crowdsourced datasets. In Chapter 2, we focus on the interactive segmentation task. Many interactions have been explored in the literature to help segmentation algo-rithms. The most common consist in designating contours [185], bounding boxes around objects [183], or interior and exterior scribbles [143]. Crowdsourcing such tasks however implies that non-expert users have to perform those interactions and the distinction be-tween expert and non-expert users is rarely touched. Inspired by the work of Korinke et al. [123, 124], we present a user study showing the advantages of the outlining interaction for crowdsourcing annotations to a non-expert public. This work has been published at ACM Multimedia 2017 [172]. Another challenge of crowdsourcing is the distribution medium. While evaluating an interaction in a small user study does not require complex setup, dis-tributing an annotation campaign to thousands of potential users might differ. The best way to proceed is to build a Web application; and since online annotators are paid for the task, we need the Web application to be as reliable as possible. Therefore, in Chapter 3 we review evolutions of the Web since its creation in 1991, especially regarding the development of re-liable frontend applications. In particular, we describe how the Elm programming language can help us build a bug-free annotation Web application. Finally in Chapter 4, we present the open-source Web application we built for the image annotation task. A highlights tour of the functionalities and the application architecture is provided, as well as a guide on how to deploy it to crowdsourcing services such as Amazon Mechanical Turk. The presentation of this application was published in the open-source competition track of ACM Multimedia 2018 [173].
Being a computational science, progress in visual odometry tends to bring larger, more complex and computationally intensive algorithms over time. Although beeing a poor unit of measure, number of lines of code provide an approximation of the relative algorithmic complexity of similar projects. Let’s examine SLAM, which is an extension to visual odom-etry. Figure 3 illustrates the growth of open-source SLAM libraries. As visible in that figure, projects code bases are growing to unreasonable sizes for research purposes. This observation is even worse when considering complete structure from motion libraries such as OpenMVG, reaching 461k lines of code.
Most of SLAM projects are developed using the C++ programming language for per-formance reasons. I will argue however, that by continuing to do so, we are hindering mid and long-term research in the field. C++ projects are difficult to build, mainly because of assumptions on requirements, dependency conflicts and usage of Linux, Mac, Windows or architecture specific libraries. To mitigate those issues, projects tend to include within the source code all of their dependencies. From the 461k lines of code in OpenMVG, 390k are coming from the src/nonFree/ and src/third_party/ directories. Although seemingly matters of engineering, those characteristics actually influence research by putting a very high barrier to entry for new approaches to be able to reproduce already available results and
CONTENTS
Figure 3: Growth of SLAM libraries over time.
compare with them. One should also note that frozing dependency versions brings security concerns, since upstream security patches requires manual actions to be replicated. This is especially true in the context of open-source, where we have less control over contributions. Even careful companies like Microsoft suffer from C++ memory safety bugs for 70% of their critical security issues [132]. Research code will eventually reach critical software, such as autonomous vehicles. With great research comes great responsability!
In the second part of this document, we will focus on visual odometry. Chapter 5 introduces the visual odometry problem and the fundamental geometry tools required to modelize it. Since we aspire to run those algorithms directly in the browser, Chapter 6 reviews past and present technologies enabling high performance computations on the Web. In particular, we detail how to target a new standard called WebAssembly from C++ and Rust. In Chapter 7 we present our open-source visual odometry library, which features a new points selection algorithm for the camera tracking. We started it from scratch in the Rust programming language, which allowed us to easily port it to WebAssembly. Finally, we showcase an interactive visual odometry Web application, enabling improvements on the tracking and 3D geometry results thanks to user interactions. A paper describing the open-source library and the interactive application is intended to be published.
Part I
Chapter 1
The Image Annotation Problem
Contents
1.1 Computer vision problems that require annotation . . . 9
1.1.1 Image classification . . . 9
1.1.2 Image captioning . . . 10
1.1.3 Object detection . . . 11
1.1.4 Object segmentation . . . 13
1.2 Discussion on dataset gathering . . . 14
1.2.1 Explicit vs. implicit annotation process . . . 14
1.2.2 Expert vs. non-expert annotators . . . 16
1.2.3 Quality check of annotations . . . 17
1.2.4 Annotation interaction usability . . . 18
CHAPTER 1. THE IMAGE ANNOTATION PROBLEM
In this chapter we will discuss the concept of image annotation, and review the body of work that have been researched in this domain. But first, what is image annotation? Fundamentally, it is the process of augmenting an image with information. This information can be of various nature, typically provided by a human operator, also called annotator.
We could consider image captioning as the first historical example of image annotation, simply consisting in adding a caption to an image. We could also consider photogrammetry as a form of image annotation which, long before digital images even existed, is the process of measuring distances and lengths of the real world from 2D images. It requires annotating these distances and lengths in the image space, before inferring the values in the real world. Early techniques in the old cinema also involved manually editing the filmstrip to create special effects, which is a form of annotation.
Digital imaging has progressively brought new needs for image annotation. The first digital image was scanned from a photograph in 1957 by Russell Kirsch, and the first digital camera was built in 1975 by Kodak engineer Steve Sasson. Commercial models of digital cameras became really available in the 1990s, and from then the volume of digital images produced grew exponentially every year. Meanwhile the field of computer vision, aiming at understanding those images, also developed its own research community. The highly influ-encial journal IEEE Transactions on Pattern Analysis and Machine Intelligence (TPAMI) was for example created in 1979. Computer vision is also related to the field of machine learning, which designates a class of algorithms in which a model learns from experience, materialized by data samples. One sub-domain of machine learning, called supervised ma-chine learning, requires in particular annotated samples, meaning that a label should be assigned to each piece of data before an algorithm can be trained to predict these labels. Supervised machine learning gained traction in the 1990s during which some applications reached high enough maturity to be exploited commercially. A famous example of this is the digit recognition algorithm from Lecun et al. [131] which was used by AT&T to auto-matically process cheques in ATM (see Figure 1.1). A nowadays popular dataset, called MNIST (Mixed National Institute of Standards and Technology) was created for this work; this dataset associates labels (digits, from 0 to 9) to 28 × 28 pixel images of handwritten figures.
This dataset illustrates how image annotation could be used to produce desirable ap-plications, and is only a small example of what has now become a classic pipeline to solve problems in the computer vision community. Since image annotation has become key in this community, this chapter focuses on computer vision but the machine learning pipeline we mention is also used in many other problems such as audio or natural language processing. Theoretical results in machine learning postulate that problems of great complexity could be adressed with this technique, provided that (i) there exists a model of sufficient capacity to cope with the problem complexity, and (ii) a sufficiently large sample of annotated data is available. Some thresholds have been established by the community to estimate what
September 5, 20201.1. COMPUTER VISION PROBLEMS THAT REQUIRE ANNOTATION
Figure 1.1: Illustration of the digit recognition algorithm from Lecun et al. [131]
“sufficiently large” means [177, 111], but computer vision problems typically requires millions of annotated images to be solved with an acceptable performance. Models relying on deep neural networks are nowadays the most popular techniques in machine learning, but other models, such as deep random forests, used in the human body pose estimation embedded in the Kinect [196], may still be considered depending on the application. Note that while gathering more and more data is the current trend in computer vision, an important field of research conversely focuses on learning on few samples; this field regroups the notions of semi-supervised learning, weakly-supervised learning, one-shot and few-shots learning, etc.
In what follows, we will motivate the study of image annotation techniques by reviewing the computer vision problems for which large datasets, often combined with (deep) machine learning techniques, have recently significantly improved the state-of-the-art. We will then discuss the process of gathering these annotations, focusing on some key aspects such as expert vs. non-expert annotations, quality control, etc. Finally, we will end this chapter with a focus on image segmentation, reviewing the possible interactions that can be used to provide such type of annotation. This last part will naturally lead to the next chapter that present our contribution on interactive segmentation.
1.1
Computer vision problems that require annotation
1.1.1
Image classification
Image understanding forms a category of hard problems, but among them, what could be considered the simplest one is image classification. Classifying an image consists in assigning it labels describing either the type of scene it depicts such as interior, exterior, beach, mountain, forest, city, or the objects that are displayed, sorted by importance. This task requires an advanced understanding of the images.
In fact, two of the most important challenges in computer vision have highlighted this task as one of the main problem to be solved. The first one, Pattern Analysis, Statistical
CHAPTER 1. THE IMAGE ANNOTATION PROBLEM
Modelling and Computational Learning Visual Objects Challenge, often called PASCAL VOC [72], has run from 2005 to 2012 and figured at its peak 11,530 images depicting 20 classes. It is interesting to note that this challenge coincides in time with the rise of machine learning popularity in the computer vision community. In a way, PASCAL VOC has been both a marker and a catalyzer of the importance of machine learning in image processing problems. PASCAL VOC stopped in 2012 sadly due to the passing of one of its most invested organizers, Mark Everingham, as well as due to the growing importance of a much larger challenge: the ImageNet Large Scale Visual Recognition Challenge (ILSVRC).
ILSVRC [184] started in 2010, motivated by the goal to solve larger scale problems. ILSVRC relies on a gigantic dataset called ImageNet, that originally intended to match a natural language dataset called WordNet [146]. WordNet is a database of english words, grouped into sets of synonyms called synsets. The goal of ImageNet is to provide a set of images to describe each of these synsets. As of December 4th 2019, ImageNet displays 14,197,122 images that depict 21,841 different synsets.
We should also mention a parallel effort funded by the Canadian Institute for Advanced Research, which led to the creation of CIFAR-10 and CIFAR-100. Those datasets contain images of size 32 × 32 collected over various Web images searching tools, and classified under 10 and 100 classes respectively. ImageNet and CIFAR-100 are often both used to assess the performance of image classifiers.
While many subsequent work have further improved state-of-the-art classification results, we could synthesize the progress in classification by citing two papers. The first one from Krizhevsky et al. in 2012 [127], nicknamed AlexNet, was probably key in the rise of deep learning that followed. AlexNet won the ILSVRC 2012 challenge by a large margin, starting the trend of using deep neural networks to solve computer vision problems. The second paper from He et al. in 2016 and often called ResNet [102], introduced residual blocks through skip connections to ease the training of very deep neural networks, up to 1000 layers! The 152 layers version of ResNet won the ILSVRC 2015 challenge by reaching an error rate so low that it could be considered below the average human performance. The general trend in subsequent work has been to reach comparable or higher performance than ResNet while reducing the number of parameters and operations to a minimum.
1.1.2
Image captioning
Another important topic, that extends in a sense the image classification problem, is the one of image captioning. It consists in describing an image with a set of sentences. Image cap-tioning is a much harder problem than classification, because captions require a higher level of image understanding as well as natural language capabilities to generate valid sentences. In terms of annotations, it is also much longer to caption an image than just assigning it a class. Another difficulty for data gathering is the quality check of the annotations, since two sentences from two different users may be completely different but still convey the same
September 5, 20201.1. COMPUTER VISION PROBLEMS THAT REQUIRE ANNOTATION
Table 1.1: Datasets for image classification and their characteristics. Dataset Year # classes # images annotation process PASCAL VOC [72] 2005 – 2012 20 11.5k In-house
ESP Game [212] unreported any 100k ESP Game players CIFAR-10 [126] 2009 10 60k Recruited students CIFAR-100 [126] 2009 100 60k Recruited students
SUN397 [227] 2010 397 130k
ImageNet [184] 2010 – now 21k 14M Mechanical Turk Open Images [128, 125] 2016 – now 8.5k 9.2M In-house and
Crowdsource app Table 1.2: Datasets for image captioning and their characteristics. Dataset Year # captions # images annotation process Flickr30k [231] 2014 150k 30k Mechanical Turk MS COCO [41] 2015 1M 164k Mechanical Turk Conceptual Captions [194] 2018 3.3M 3.3M Web crawling nocaps[3] 2019 166k 15k Mechanical Turk
semantic meaning.
The datasets introduced in Table 1.2 have brought large enough sets of examples to efficiently train deep neural networks. Image captioning requires more advanced architec-tures, as it involves performing two difficult tasks at the same time: (i) image understanding (computer vision) and (ii) sentence generation (natural language processing). The first task has become fairly standard, provided that large datasets are available, and relies on convo-lutional neural networks. The latter is a well-known task as well, and can be solved using recurrent neural networks, which are useful to handle sequential data as well as generating sequences (such as sentences) of variable length. One of the first and most popular papers to build a system that brought together these two components was published by Xu et al. [228]. This work, named Show, Attend and Tell, uses an attention model to focus on different regions of an image while guiding the sentence generation. Attention models have been later extended to Transformers models [210], and this extension has been adapted to image captioning by the authors of the Conceptual Captions dataset [194].
1.1.3
Object detection
On top of naming or precisely describing the objects in an image, many applications also require to locate the objects. There are several levels of precision to which this problem can be achieved. The coarser grain application is often coined object detection and consists in drawing a bounding box around objects in an image. Object detection is a generalization of the object localization problem, for which there can be at most a single instance of each object in an image. Object detection is a much more difficult problem, since there could be
CHAPTER 1. THE IMAGE ANNOTATION PROBLEM
Table 1.3: Datasets for object detection and their characteristics.
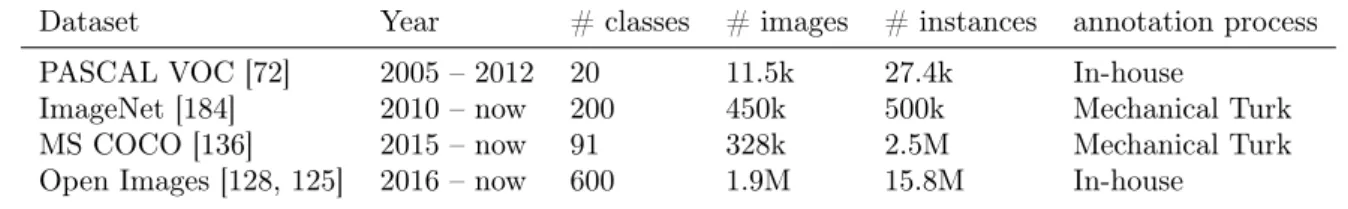
Dataset Year # classes # images # instances annotation process PASCAL VOC [72] 2005 – 2012 20 11.5k 27.4k In-house
ImageNet [184] 2010 – now 200 450k 500k Mechanical Turk MS COCO [136] 2015 – now 91 328k 2.5M Mechanical Turk Open Images [128, 125] 2016 – now 600 1.9M 15.8M In-house
hundreds of instances of the same object in a scene (such as humans in a crowd picture, or cars in a parking lot for example).
Object detection datasets mostly originate from the image classification datasets inro-duced in Table 1.1, which they are often extending. Table 1.3 sums up the main charac-teristics of four of the most prominent ones. The PASCAL Visual Objects Challenge [72] for example, has included a detection challenge ever since it first ran in 2005 but on only a few thousands image. The dataset increased in size over time and reached almost 30k annotated bounding boxes in the end in 2012. The ImageNet challenge, which originally started in 2010, later added a detection task (in 2013 and 2014) with a large dataset of more than 500k annotated bounding boxes on 200 classes (which include for the most part the 20 classes of PASCAL). Note that ImageNet also ran a localization challenge for which more than 500k images of the 1000 classes that were used in the classification challenge were annotated with one, and sometimes more, bounding boxes per image. The difference between localization and detection is that there is only one instance of object in an image of a localization dataset. In total, there are more than a million images including one or more bounding box annotations in the ImageNet dataset. The third dataset, called Microsoft Common Objects in Context (MS COCO) was released in 2014 [136]. It figures annotations that are in fact object segmentations, but that are used to generate bounding boxes valid for an object detection task. MS COCO was designed to provide a larger number of annotations per class than ImageNet and PASCAL, but on a smaller number of 91 classes. Finally, the most recent and large dataset is called Open Images [128, 125] and features a tremendous amount of more than 15 million bounding boxes of 600 classes on almost 2 million images.
These datasets have largely contributed to the performance improvements observed in the literature from 2014 to 2016. Such improvements are mainly due to two body of works that have driven the research in object detection forward. The first line of work directly derives from a trend that emerged at the end of the 2010s in computer vision. A category of segmentation algorithms called superpixels became quite popular and many influential papers [76, 1, 133] proposed solutions for computing oversegmentations that could be used as a building block of more complex methods. In particular, some object detection algorithms started using a set of object proposals [209], computed from a superpixel segmentation, that would be later classified as objects or not. This approach constitutes the core idea of the Mask-RCNN paper [87], the classification step being performed by a standard convolutional
September 5, 20201.1. COMPUTER VISION PROBLEMS THAT REQUIRE ANNOTATION
Table 1.4: Datasets for object segmentation and their characteristics.
Dataset Year # classes # images # instances annotation process PASCAL VOC [72] 2005 – 2012 20 11k 7k In-house
SUN2012 [227] 2012 4479 131k 313k LabelMe [185, 19] MS COCO [136] 2015 – now 91 328k 2.5M Mechanical Turk Open Images [128, 125] 2016 – now 350 1M 2.8M In-house
neural network. This approach was later optimized by the same author [86] (Fast-RCNN), until the whole process was merged into a single end-to-end neural network that jointly performs object proposals and classification [181] (Faster-RCNN). A second line of work adopts a different type of neural network architectures. It focuses on the task of predicting bounding box coordinates for all object classes, splitting an image into a grid and being able to predict a bounding box centered in each cell of the grid. This approach, called YOLO (You Only Look Once) [178], was later optimized to be able to handle very large scale problems [179], up to 9000 classes, and to improve performances [180].
1.1.4
Object segmentation
The finer grain at which localization can be achieved is at pixel level: this is called image segmentation, or image parsing. This problem can also be stated as classifying each pixel in an image. A variant of this problem is called object segmentation, or instance segmentation, in which only some objects of an image are segmented. Annotations for the segmentation are much more difficult to gather, due to the need for a pixel-wise precision and the potential complexity of objects contours. The problem of automatic image segmentation is also a very complicated one, and requires a large number of annotations to be efficiently solved. The first dataset to offer an important number of annotations is once again PASCAL, with roughly 7,000 annotated instances of the same 20 classes as the one used for the classification and detection tasks. A parallel effort was developed in the framework of the SUN database, thanks to a popular labelling tool called LabelMe [185], that produced more than 300k labelled instances. LabelMe is a tool that allows drawing polygons around objects of interests. The segmentations obtained with this method are often quite coarse, but the authors of [136] nonetheless reported that it takes 22 hours of human annotations to segment 1000 object instances. In their dataset, which was described in an earlier paragraph, more than 2 millions instances were annotated. The latest dataset is again Open Images, with a million images depicting 350 classes and 2.8 million segmented instances.
The first paper to implement an end-to-end neural network for image segmentation was published in 2015 [138]. J. Long et al. present a fully convolutional architecture which com-bines predictions at different levels of resolution to produce a detailed segmentation map. This architecture was improved by two papers, who systematize the combination of pre-dictions by introducing an encoder-decoder architecture, with skip connections that allows
CHAPTER 1. THE IMAGE ANNOTATION PROBLEM
retrieving fine-grained details. U-Net [182] is one of these two papers, and originated from the medical imaging community. SegNet [11] on the other hand specifically targets urban scenes segmentation, with autonomous driving as a direct application. These two papers share the same neural network architecture, with slight specificities in the skip connection implementation. Another very popular paper in the field of segmentation is DeepLab [40]. Previous architectures use an autoencoder structure, which allowed to derive a global un-derstanding of the image in the bottleneck region of the network before retrieving a more local clasification of the pixels. Instead, DeepLab uses a spatial pyramid of different filter sizes to perform a multi-scale analysis of the image and make a local prediction that takes into account a larger area.
1.2
Discussion on dataset gathering
Instead of specifically commenting on each dataset methodology for gathering annotations, we will discuss in this section particular points that are of interest when one wants to create its own dataset.
1.2.1
Explicit vs. implicit annotation process
As visible in the tables of Section 1.1 the annotation process was predominantly explicit to the human annotators. By explicit, we mean that the humans involved in the task were fully conscious of the tasks they were performing, and that their goal was to create an annotated dataset. This is mostly due to the fact that image annotation takes time, and requires an incentive, typically money on crowdsourcing platforms. There are however a few exceptions, some of which have been mentioned before.
First, the Conceptual Captions dataset [194] has been obtained through a mostly auto-mated process, looking for sentences on Web pages that accompany the images. One could say the original authors of the sentences implicitly annotated the images for this dataset.
A more interesting example is the ESP Game dataset [212]. The ESP Game has been created by Luis Von Ahn in 2005 and figures two humans playing collaboratively over the same image, as depicted in Figure 1.2. They score points whenever they manage to write matching words to describe the image. From an annotation point of view, whenever the two players agree on a word one can safely assume this word describes an object present on the image, or an action happening on the image. In order for the game to provide a good annotation coverage, words can be ruled out of the game, called taboo, which means the players can see these words and know they have to specify a different one. The ESP game started a trend of Games With A Purpose (GWAP) [213] including some games designed to perform image annotation such as PeekaBoom [214], KissKissBan [106] and Click’n’Cut [36], but ESP remains the only game that gathered enough data to create a dataset.
September 5, 2020 1.2. DISCUSSION ON DATASET GATHERING
Figure 1.2: Screenshot of the ESP game, by Luis Von Ahn [212]
There exists another well-known mean to gather data in an implicit way: CAPTCHAs. The term has been originally coined by Luis Von Ahn (again) et al. [211] and stands for Com-pletely Automated Public Turing Test to Tell Computer and Humans Apart. CAPTCHAs have been created to stop automated attacks on websites, to prevent automated creation of millions of malicious email accounts. The idea is to create a Turing test [208], i.e. a test that a human should be able to complete effortlessly while a machine would be unable to perform it. Original versions of CAPTCHAs displayed distorted, geometrically transformed words which would make it unrecognizable by standard optical character recognition (OCR) softwares. The task remained fairly easy to humans, and required in average 13s [215]. At the time, ambitious projects were ran in parallel to digitize tremendous collections of books, like Google Books, which makes available searching through millions of books. This process of digitizing books was automated using OCR softwares, but failed for 20% of the words in older books due to faded ink for example. The reCAPTCHA system offers a clever way to match the two very different problems of securing websites and digitizing old books by proposing words from old books, that could not be recognized automatically, to humans who wish to use an online service and are perfectly able to recognize them. The authors report that in 2008, after one year of deployment, reCAPTCHA has helped decipher 440M words, which amounts for more than 17,000 books.
While there are no further publications on reCAPTCHA, one has been able to observe its evolution through the years (see figure 1.3). Driven by the need to come up with problems that still resist computers, it went from text to image recognition, from digit recognition in pictures probably extracted from Google Street View to object detection in urban scenes pictures, very likely to target autonomous vehicles applications.
CHAPTER 1. THE IMAGE ANNOTATION PROBLEM
Figure 1.3: Screenshots illustrating the evolution of reCAPTCHA [215] tasks over the years.
1.2.2
Expert vs. non-expert annotators
Whether they are implicit or explicit, annotations need to be performed by human anno-tators and there have been several trends throughout the years. In essence, we could split annotators into two sets of users: experts, from whom we can expect high quality annota-tions but are rare and expensive, and non-expert users who tend to make more mistakes but provide much cheaper annotations.
Historically, the first datasets of reasonable scale which are PASCAL and CIFAR, did not require too many annotators. In fact, the authors of PASCAL [72] reported that a “party” of users annotated the images after an initial training. They were probably students, but no details are provided as to how many of them. These users were also regularly observed during annotations to ensure the quality of their work. Finally, one of the organizers of the PASCAL challenge checked all the annotations. Similarly, the CIFAR dataset [126] was labelled by a group of students paid for the task.
With time, there was a demand for larger datasets. They aimed at expanding the number of classes, as well as the number of annotated images. With this new goal in mind, the dataset authors started crowdsourcing the annotations. Crowdsourcing is a process in which a task that should usually be performed by an expert is outsourced to a crowd of non-expert users. The term was first coined by Jeff Howe in 2006 [107]. The creation of specific online platforms such as Amazon Mechanical Turk or Crowdflower considerably eased the process of crowdsourcing image annotation. ImageNet and MS COCO have both been annotated by Turkers, i.e. humans recruited and paid through Amazon Mechanical Turk. Since the difficulty to clearly instruct remote users is increased, the annotations interfaces need to be carefully designed, and the annotation quality need to be properly ensured; this will be described in Section 1.2.3.
While crowdsourcing is widely used, it may not be relevant to all setups. In cases when images are sensitive for example, it is not possible to outsource the annotation process outside of a company. In addition, the need for redundancy to ensure annotation quality limits the positive impact on cost that crowdsourcing is supposed to provide. Although being
September 5, 2020 1.2. DISCUSSION ON DATASET GATHERING
one of the largest annotated dataset, Open Images has been for the most part annotated by in-house employees at Google. To achieve this, interactions have been specially designed to lead to good annotations in a faster way. For example, extreme clicking for bounding box annotations [165] introduces a clever interaction that allows to draw bounding boxes more quickly, avoiding the errors that usually force users to start over. Alternatively, the authors of [21] propose an interactive segmentation algorithm in which user clicks guide a deep neural network and refine the segmentation mask. The images can be annotated 3 times faster than when using a standard polygon drawing tool such as with LabelMe [185], and the segmentation boundaries are much more precise. We present a similar contribution in the next chapter.
1.2.3
Quality check of annotations
As stated in the previous section, crowdsourcing is currently one of the leading methods to gather annotations for creating image datasets. However, and while the annotations come at a relative cheap cost, the quality of the collected data is often questionable. Oleson et al. [162] have classified three categories of errors that non-expert users are likely to commit when performing Human Intelligence Tasks (HIT), the term coined in Amazon Mechanical turk to designate the micro-jobs offered to the users. The first source of errors, called unsufficient attention by Oleson, simply occurs when the humans enrolled to perfom HITs, called workers, make occasional mistakes, due to the task complexity or a lack of attention for example. Some other workers, called incompetent by Oleson, may not understand the task and behave unpredictably. The data they provide is often unusable. Finally, a last class of workers, called scammers, designates users who try to trick the system to collect the reward. A good quality checking process should account for these three types of possible errors. Oleson et al. point out the advantages of adding gold standard images i.e. images for which a ground-truth annotation is known, among the data to be able to estimate workers reliability. The authors of ImageNet [184] also reported using this technique. Using gold standard is a good practice to detect scammers and incompetent workers.
Figure 1.4: Illustration of possible mistakes that happen during a crowdsourcing cam-paign [38]: on the left, annotations from a user who misunderstood the task, to be compared with the expected results on the right (red points on the background, green points on the foreground). In the middle, annotation of a scammer.
CHAPTER 1. THE IMAGE ANNOTATION PROBLEM
The most obvious way to detect workers mistakes is to introduce redundancy in the annotations. Multiple workers are tasked to label the same image, and the annotations are validated if they are similar enough. This straightforward strategy has been formalized by Luis Von Ahn [213] under the term output agreement: multiple users agree on the same output annotation for a given image. Authors of MS COCO [136] report asking up to 8 workers to perform the same task, for example to increase the recall in an instance spotting task. Redundancy helps reducing the impact of unsufficient attention.
Another technique to prevent having too many incompetent workers is to go through a tutorial before starting the task. Gottlieb et al. [92] have shown that the performance of users who complete a tutorial beforehand is significantly higher than users who did not. In [136], users are filtered based on their performance in an initial training task and are periodically verified during the whole annotation process.
The error rate can also be limited by a clever labor division. A Human Intelligence Task should always be an atomic operation, simple to explain and quick to perform. For example, the authors of [204] introduce a Find-Fix-Verify pattern for object detection annotations. Output agreement is difficult to implement for bounding boxes due to the the presence of thresholds to measure similarity. Therefore, the authors introduce a series of micro-tasks ensuring the quality of the final bounding boxes. A first group of workers is tasked to draw bounding boxes (Find ), and a second group of different workers is asked to validate each of the bounding boxes (Fix ). Being a binary decision, it is easier to implement output agreement on this second task. Finally a last group of users is in charge of checking whether some objects have been omitted by the first pool of workers (Verify). Another example of work division is described in [41] for instance segmentation. Four different tasks are defined and sequentially operated by different workers: image labelling (Which objects appear in the image? ), instance spotting (users should click on each instance of a particular object), instance segmentation, and segmentation verification. Redundancy is introduced at every step except for the third one, which is the more time-consuming and is especially verified by the fourth task.
A final control of the annotations quality can be done at the end of the study. This is an approach adopted in PASCAL [72] for example, but also in Open Images [128] in which the expert annotators verify automatically derived labels, obtained through deep learning.
1.2.4
Annotation interaction usability
A common feature of all the points we have discussed in the three previous sections is that the goal of the annotation process is to obtain the largest possible number of annotations, of the highest possible quality, and at the lowest possible cost. Implicit annotation is cheaper but often difficult to put into place in practice. Expert annotators provide reliable annotations but are expensive, whereas a large number of less precise annotations can come at a cheaper cost when using crowdsourcing. Quality check helps ensuring annotations reliability but
September 5, 20201.3. EXISTING INTERACTIONS FOR USER-ASSISTED SEGMENTATION
introduce new expenses.
With that goal in mind, there also exists another variable which is rarely taken into account: the usability of the annotation interaction. Usability is a computer-human inter-action concept that has been defined by Nielsen [154]. In essence, it describes the extent to which an interface can be mastered and used to efficiently perform the task it has been designed for. Nielsen also introduces five criteria that help measuring an interface usabil-ity: subjective satisfaction, easiness to learn and to remember, efficiency with respect to a certain task, and error robustness. It is really interesting to note that all of these criteria are relevant to image annotation; we want the users to be efficient, i.e. to provide good annotations in the minimum amount of time. We want the users to make as few errors as possible, and we also want them to easily learn and remember their task, once again, to be cost-effective. While usability is a core concept of computer human interaction, very few of the annotation tools that we described previously mention they want to optimize it.
Korinke et al. [123, 124] have studied how touch devices should be used to perform image segmentation. They compare several types of interactions and conduct two user studies to evaluate and compare these interactions. More recently, and while usability is not explicity mentioned, the work of Papadopoulos et al. [165] on extreme clicking is particularly interesting. The goal of the work is two-fold: reducing the annotator cognitive load and improving the quality of the annotations. The authors propose replacing the traditional bounding box drawing by clicking four extreme points (top, down, left and right) of the object and deriving the bounding box from these points. This interaction offers an interesting advantage: it reduces the time needed to appropriately draw a bounding box by a factor of 5. Users otherwise tend to start over multiple times due to the non-convexity of objects shape. It also provides richer annotations as four points lying on the object boundary are provided; the authors take advantage of this property to generate reasonable quality segmentations from this very weak information of only four points. Some subsequent work of the same group adopt similar approaches for image segmentation, providing users with the ability to correct segmentations by scribbling [4] or clicking [21].
1.3
Existing interactions for user-assisted segmentation
As image segmentation involves annotating images with a very rich amount of information, many interactions have been explored in the literature to provide users a way to bring semantic information to help existing segmentation algorithms. We review the interactions in this section and present briefly the algorithms that are attached to them.
The most intuitive methods are the ones that require the user to manually designate the contours of the object. The LabelMe tool [185] (Figure 1.5) is the most famous example of such an interface. The Web-based interface developed by the authors allows users to draw a polygon around an object. The segmentation obtained with this technique is not
CHAPTER 1. THE IMAGE ANNOTATION PROBLEM
necessarily precise at the pixel level, but is sufficient in many cases and has the advantage of being easily understood by users. In a variant of this technique called the Intelligent Scissors [148], the users click points on the contour of the object and a dynamic programming algorithm searches the optimal path that ties those points. There exists another variation of contour drawing called Soft Scissors [218]. One has to follow the contour using a soft constrained, size-adaptable thick contour brush, requiring less precision than exact polygon contour drawing.
Figure 1.5: Visualization of an image annotated with the LabelMe tool [185].
A second possibility for interactive segmentation has been proposed by Rother et al. [183]. The user is only required to draw a bounding box around the object (Figure 1.6), which is used to learn a background model. The foreground is then obtained using iterative graph-cut and alpha matting. This method works very well for objects that distinctly emerge from a repetitive background. However in the case of complex scenes, the authors allow users to perform an additional refining step based on scribbles.
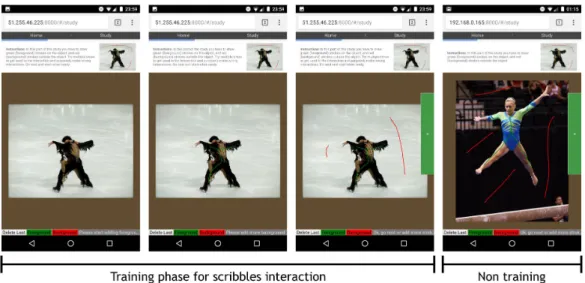
Scribbles form another category of interactions for segmentation, and are undoubtedly the most widely used (Figure 1.6). Users can typically draw foreground and background scribbles on the image, and receive a feedback on the current state of the resulting segmen-tation mask. Boykov and Jolly [27] use this input to build a trimap, i.e. a partition of the
September 5, 20201.3. EXISTING INTERACTIONS FOR USER-ASSISTED SEGMENTATION
Figure 1.6: Example bounding box and scribbles interactions. On the left image, a user drew a bounding box around the gymnast. On the right image, a user drew green foreground scribbles on the gymnast and red background scribbles outside.
image into hardly constrained foreground and background regions, and a softly constrained in-between region. They run a graph-cut algorithm to find the optimal object boundary on the softly constrained region. McGuinness and O’Connor [143] describe how to use scribbles to segment an image using a Binary Partition Tree (BPT) [187]. The BPT is a hierarchy of image segments that can be used to propagate the foreground and background inputs between similar regions. Scribbles have also been used in the context of image co-segmentation [20], to provide foreground and background information across a set of images depicting the same object. As an alternative to scribbles, single foreground and background points have been used as input to select the best masks among a set of object candidates [37], or to guide the prediction of deep neural networks [21].
The mouse is used in most of these work as interaction device, which probably explains why outlines are rarely studied in the literature. Outlines are indeed tedious to perform with a mouse. However, most of the literature algorithms can take outlines as an input; in the work we present in the next chapter, we choose to use GrabCut to obtain a segmentation from the outlines.
Chapter 2
Outlining for Segmentation
Contents
2.1 Introduction . . . 24 2.2 Outlining objects for interactive segmentation . . . 26 2.2.1 Outline erosion . . . 27 2.2.2 Blum medial axis algorithm . . . 28 2.2.3 Enhancing foreground with superpixels . . . 29 2.3 Experiments . . . 29 2.3.1 Experimental setup . . . 29 2.3.2 Usability metrics . . . 32 2.3.3 Interaction informativeness . . . 34 2.3.4 Segmentation quality . . . 36 2.3.5 Discussion . . . 37 2.4 Conclusion . . . 38
CHAPTER 2. OUTLINING FOR SEGMENTATION
Interactive segmentation consists in building a pixel-wise partition of an image, into foreground and background regions, with the help of user inputs. Most state-of-the-art algorithms use scribble-based interactions to build foreground and background models, and very few of these work focus on the usability of the scribbling interaction. In this chapter, we study a very intuitive interaction to non-expert users on touch devices, named outlining. We present an algorithm, built upon the existing GrabCut algorithm, which infers both foreground and background models from a single outline. We conducted a user study on 20 participants to demonstrate the usability of this interaction, and its performance for the task of interactive segmentation.
2.1
Introduction
The number of pictures that are captured, stored and shared online is growing everyday. In march 2017, Facebook reported that 300 million pictures were uploaded each day on their website. These pictures are increasingly used by companies and individual users, enabling new applications trying to improve everyday life. Object segmentation serves as an impor-tant step toward automatic image understanding which is key to those smart applications.
Object segmentation in an image remains a challenging task. This process of assigning a label to each pixel is very sensitive to the classical difficulties encountered in computer vision such as lighting conditions or occlusions. Recent advances in deep learning have enabled researchers to obtain state-of-the-art results [138] by training on the PASCAL segmentation dataset [73]. Some other techniques learn to infer a pixel-wise segmentation from weak annotations, i.e. bounding boxes around objects [166]. These methods are very promising but need huge amount of human labeled samples in order to train deep neural networks. Recent approaches have tried to overcome this issue, introducing active learning to train deep neural networks using a limited amount of selected samples [137] on the problem of image classification, but none of these methods have yet been applied on semantic segmentation.
Since fully automatic segmentation is still in many cases out of algorithms’ reach, re-searchers have introduced the concept of interactive segmentation. This problem has often been approached with a task-driven point of view: what type of interaction may bring the necessary information to significantly help an algorithm achieve an acceptable segmentation? The users providing the interactions are often supposed to have a fair understanding of what segmentation is. This assumption is problematic, especially when putting into perspective the extraordinary amount of images to be annotated. That is why our target audience is composed of non-expert users who are not knowledgeable about image processing and seg-mentation. As a consequence, most of the existing work are not suitable to our problem. They rely on foreground and background scribbles requiring high cognitive load from the users.
September 5, 2020 2.1. INTRODUCTION
Figure 2.1: A user outlining an object on a touch device, and the resulting segmentation mask obtained with our method.
performed quickly and lead to good segmentation results while keeping users from entering a process of iterative segmentation refinement. This outlining interaction is particularly well suited for touch devices, which is appropriate considering the growing usage of tablets and smartphones compared to computers. All these properties make the outlining interaction very interesting for crowdsourcing segmentation annotations on thousands of images, with non-expert users.
We present two main contributions in this work: first, a modification of the GrabCut algorithm that takes as input an outlining interaction, instead of a bounding box. We take advantage of the free-form shape drawn by the users to extract information about foreground (using the Blum Medial Axis computation) from a background annotation (the outline). The second contribution of this work is the usability comparison of various interactions used in interactive segmentation. We argue that the outline offers the advantage of being a quick, easy-to-understand and usable interaction while providing a high amount of supervision to obtain a good segmentation.
The rest of the chapter is organized as follows. Since we have already extensively de-scribed the state-of-the-art in the previous chapter, we first introduce the outlining interac-tion along with our method to compute segmentainterac-tion masks in Secinterac-tion 2.2. We then present in Section 2.3 our experiments and the results showing that our simple interaction leads to segmentations of good quality.
CHAPTER 2. OUTLINING FOR SEGMENTATION
2.2
Outlining objects for interactive segmentation
In this section we detail why we use outlining interactions, and our method to compute segmentation masks from those.
As stated in the previous section, most of prior crowdsourcing campaigns in image seg-mentation have asked users to draw a polygon around the object of interest. This interaction has some merit in terms of usability: it is straightforward to understand, and does not re-quire iterative refinement from the user. In addition, the user does not have to evaluate the quality of the produced segmentation mask to know when to stop interacting. When the polygon is drawn, the segmentation is over.
However, we have two main concerns with this interaction. First, it is tedious and time consuming. It requires users’ full attention, in order to precisely click on the object boundary. It also requires users to implicitly determine the number of edges of the polygon they should draw. A second limitation of this interaction is the pixel-wise quality of the segmentation mask obtained. Shape details and curved boundaries can only be approximated by a polygon, and their quality is correlated with the time the human annotator is willing to spend annotating.
Outlining an object has the same merits than drawing a polygonal shape around the object: the task is easily defined, and it is easy for a user to assess the quality of an outline. It also adresses the first limitation of the polygons: since it requires less precision in following the object boundaries, it is less tedious and time consuming. It has however an important drawback: it does not provide an accurate segmentation.
In order to address this problem, we choose to rely on the popular GrabCut algo-rithm [183]. The original GrabCut takes a bounding box as an input. It considers every pixel outside of the bounding box as fixed background, and aims at separating foreground from background inside the bounding box. To this end, a background model is estimated from the fixed background, and a foreground model is estimated from the pixels inside the bounding box. The likelihood of each pixel inside the bounding box to be foreground or background is then estimated, and graph-cut is applied to obtain a temporary segmentation mask. This mask is then used to update the foreground and background models, and the process is iterated until convergence.
In our implementation, we slightly alter the GrabCut algorithm to take into account a major difference between outlines and bounding boxes: we can make stronger assumptions on the foreground positions from an outline than from a bounding box by looking at the general shape of the outline. We restrict the initial foreground model computation to the pixels that are most likely to be foreground, which decreases the number of iterations needed for convergence and improves the segmentation quality.
In the rest of the section, we explain two different methods to infer foreground from the ouline shape: the first method consists in eroding the outline, and the second is based on the Blum medial axis computation. We then post-process the foreground pixels using
September 5, 20202.2. OUTLINING OBJECTS FOR INTERACTIVE SEGMENTATION
superpixels.
(a) Erosion of outline (b) Skeleton of outline
(c) Erosion of outline extended with superpixels (d) Skeleton of outline extended with superpixels
Figure 2.2: Different foreground inferring methods from a user outline. The ground truth mask is in dark blue. The user outline is in cyan. The inferred foreground is in yellow.
2.2.1
Outline erosion
The simplest method to obtain points that are likely to be foreground from an outline is to apply morphological erosion of a mask representing the inside points of the outline. We use a disk as a structuring element for the erosion, and the only parameter of this method is the radius of the disk.
CHAPTER 2. OUTLINING FOR SEGMENTATION
the outline performed by the user on a reference image. We compute the mean md and
standard deviation sd of the distance d from each outline point to the ground truth mask.
Assuming the user consistently outlines all images, i.e. the mean distance of the user outline to an object is more or less constant across all images, a disk radius equal to md+ 2 · sd
should produce an eroded outline that is almost certainly completely foreground.
An example of this process can be visualized on Figure 2.2a. The eroded outline (yellow) is almost entirely contained in the ground truth mask (dark blue).
2.2.2
Blum medial axis algorithm
In shape analysis and model animation, the Blum medial axis transform [25] is one of the most popular tools. The Blum medial axis of a shape is composed of the centers of the circles that are tangent to the shape in at least two points. It is especially appropriate to compute skeletons, composed of the medial axis points inside the shape.
Figure 2.3: Skeleton (in green) computed using the Blum medial axis algorithm from an outline (in red). Few example disks are shown in blue. In the image on the left, all disks centers (green points) are kept, generating a very noisy skeleton. In the image on the right the skeleton is pruned, by filtering out centers of small disks.
One of the problems of the medial axis algorithm is its stability when the shape frontier is noisy. It tends to create a high number of branches (Figure 2.3), which deteriorates the simplicity of the skeleton, and incidentally the comprehension of the shape. In our case, this is rather an advantage. Indeed more ramifications lead to a higher number of points inside the shape for our foreground scribbles. However, we need to filter the inside points, since those close to the outline have a high probability of being outside of the object to segment. Radius of the inside circles of medial axis points constitute a good filter option because the medial axis points with the smaller radius are typically close to the outline. In
September 5, 2020 2.3. EXPERIMENTS
our implementation, we choose to keep only centers with a radius higher than half the larger radius. Figure 2.2b depicts a ground truth mask in dark blue, a user outline in cyan and the filtered medial axis points in yellow. Most of the yellow points fall inside the ground truth mask, thus making it a good starting point to learn the foreground model.
2.2.3
Enhancing foreground with superpixels
These two methods, Blum medial axis and outline erosion, allow to select foreground points that make a valuable input to the GrabCut algorithm. However, we add a post-processing step to (i) extend this foreground information and (ii) filter as much false foreground points as possible.
To do so, we compute a superpixels segmentation of the image, i.e. an oversegmentation that groups neighbouring pixels with similar colorimetric properties. We (i) extend the foreground labels from pixels to the superpixels they belong to. This considerably increases the surface of the foreground region. In addition, we (ii) handle conflicting superpixels, which contain both pixels denoted as foreground and a piece of the outline, by removing them from the foreground mask. An example of the result can be seen on Figure 2.2c and Figure 2.2d. Note that the errors arising from the first step (between the knees in Figure 2.2a and Figure 2.2b) have successfully been removed in the post-processed inferred foreground mask.
We choose to use the Mean-Shift superpixels [51] because no compacity constraint is used in their computation. As a consequence, a superpixel can cover a large area (especially in the case of similar background regions, such as an homogeneous sky) and will more likely correct wrongly inferred foreground points.
2.3
Experiments
In this section we describe the setup of our experiments and analyze the outcome of the study.
2.3.1
Experimental setup
Interactions Since the subject of the study is interactive segmentation on touch devices, we choose to compare only three annotations: outlines, scribbles, and bounding boxes. We do not include polygon drawing since it is clearly not adapted to a touch device. Indeed, fingers are too big to precisely touch the boundary of an object, they would hide the area where the user should try to place the vertex on.
The interfaces are kept as simple as possible. The user is shown an image and has to provide a valid input to be allowed to move on to the next image.
![Table 1.1: Datasets for image classification and their characteristics. Dataset Year # classes # images annotation process PASCAL VOC [72] 2005 – 2012 20 11.5k In-house](https://thumb-eu.123doks.com/thumbv2/123doknet/2945061.79586/21.892.160.727.181.348/datasets-classification-characteristics-dataset-classes-annotation-process-pascal.webp)
![Figure 1.3: Screenshots illustrating the evolution of reCAPTCHA [215] tasks over the years.](https://thumb-eu.123doks.com/thumbv2/123doknet/2945061.79586/26.892.171.733.145.339/figure-screenshots-illustrating-evolution-recaptcha-tasks-years.webp)
![Figure 1.5: Visualization of an image annotated with the LabelMe tool [185].](https://thumb-eu.123doks.com/thumbv2/123doknet/2945061.79586/30.892.210.689.325.757/figure-visualization-image-annotated-labelme-tool.webp)